Instant download of desktop and mobile sites: part 1
Hi, Habrovchane! Today we talk about optimizing the speed of loading the site. This is the first thing that the user pays attention especially when entering from mobile devices. What problems leads to the low speed of the site:
- reduced conversion ( Walmart study );
- reduction of audience coverage;
- increase in bounce rate;
- reducing the availability of the site;
- reducing the speed of indexation by search robots.
In the series of articles we will consider the stages and methods of site optimization.
- Analysis and evaluation of the current state of the site.
- Tools and approaches to reduce bitmaps.
- Reducing vector images.
- Minimize the number of requests.
- Font optimization.
- Caching
- The structure of web pages.
- Using CDN.
- Optimization of CSS, HTML and JavaScript code.
- Improved usability.
1. Analysis and evaluation of the current state of the site
Most often, the optimization is done in fact on work projects. Therefore, we will analyze the current state of the pages to determine the list of priority improvements.
')
Google Insights PageSpeed
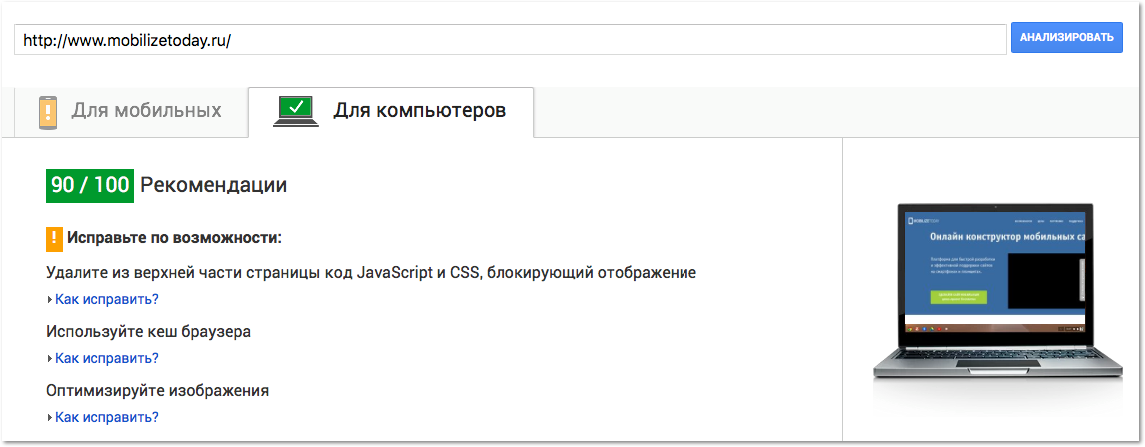
Page Speed Insights measures web page loading speed. The URL is checked twice - with a regular and mobile user agent. Score PageSpeed can be from 0 to 100 points. The higher the score, the better. If the page has scored more than 85 points, then it loads quickly.
An acceptable result can be considered an assessment: 70-80 points.
Please note that PageSpeed Insights is constantly evolving, so as new rules are added or analytical algorithms are improved, the score sometimes changes.
PageSpeed Insights defines how you can improve the following indicators:
- document object model load time: the total time from the moment the page is requested to the moment it is drawn.
- full page load time: the total time from the moment the page is requested to its full display in the browser.
Since the connection speed is different for different users, PageSpeed Insights considers only the web-independent aspects of the operation of the page: server configuration, HTML structure, use of external resources (images, JavaScript and CSS). Therefore, we can optimize the relative page load speed, absolute in much the same depends on the speed of connection to the network. In addition, the service offers download optimized images, JavaScript and CSS resources for the analyzed page.
Each recommendation has a priority indicator corresponding to its importance:
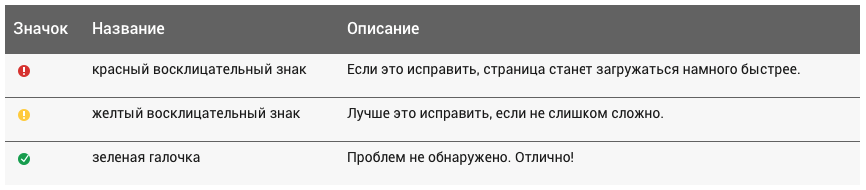
To automate the debugging process, you can use PageSpeed Tools .
Pingdom
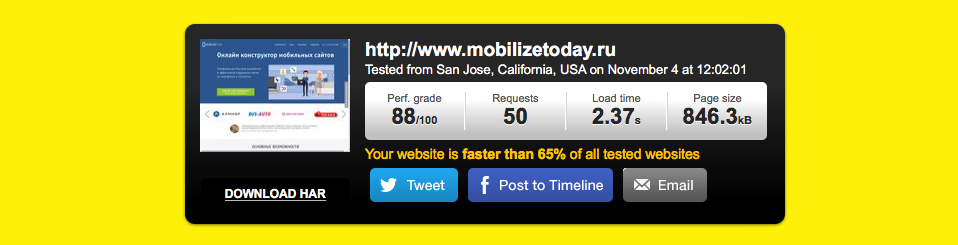
Using the Pingdom service, we measure the speed of access to the actual page, performance, general results for the page, as well as in separate tabs, we can evaluate the correctness of the DNS server settings and make a ping check to the host or ip address. The test is convenient for evaluating performance before and after optimization.
Chrome devtools
The Networks tab in DevTools allows you to evaluate the boot order, speed, page size and emulate various types of connections. When reanalyzing, it is advisable to disable the cache to improve the performance of the first user visit (“cold load”).
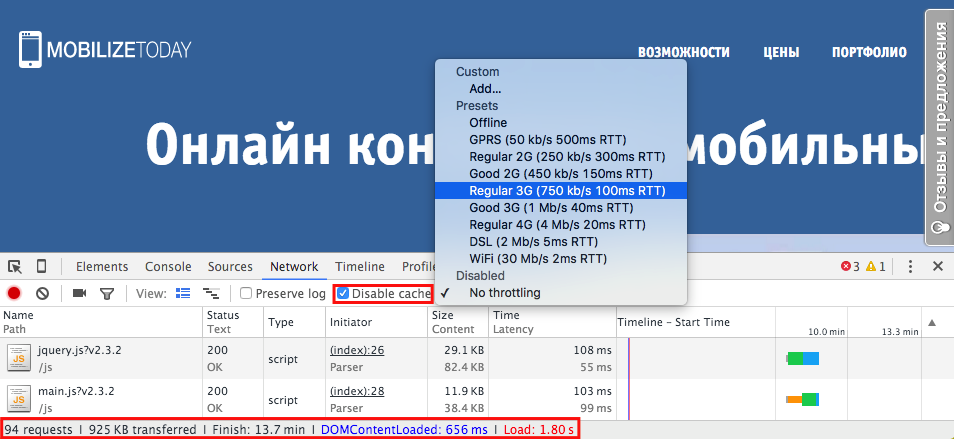
As a basic benchmark for an adaptive site, we take the following indicators:
- Mobile version of the site
Download speed: 2-3 seconds
Page size: 1 MB or less (if possible 500 KB or less)
- Desktop version
Download speed: 2-3 seconds
Page size: 2 MB or less
During this time, not all content may be shown, but the upper part, visible without scrolling. While the visitor views the materials available to him, the rest of the content will be downloaded.
2. Tools and approaches to reducing raster images
In most cases, the most resource-intensive is the process of downloading images, taking into account the number of devices and permissions. Optimizing the size and quality of images using image editors does not give the maximum effect. Usually, Internet graphics can be compressed by 10-40%, without loss of quality, including reducing the number of colors and transcoding files.
But it is optimal to use specialized programs and web services, three of them will be discussed below. As an experiment, the same sets of GIF, PNG and JPG images were taken, each of which is a sample of web graphics.
ImageOptim (Mac)
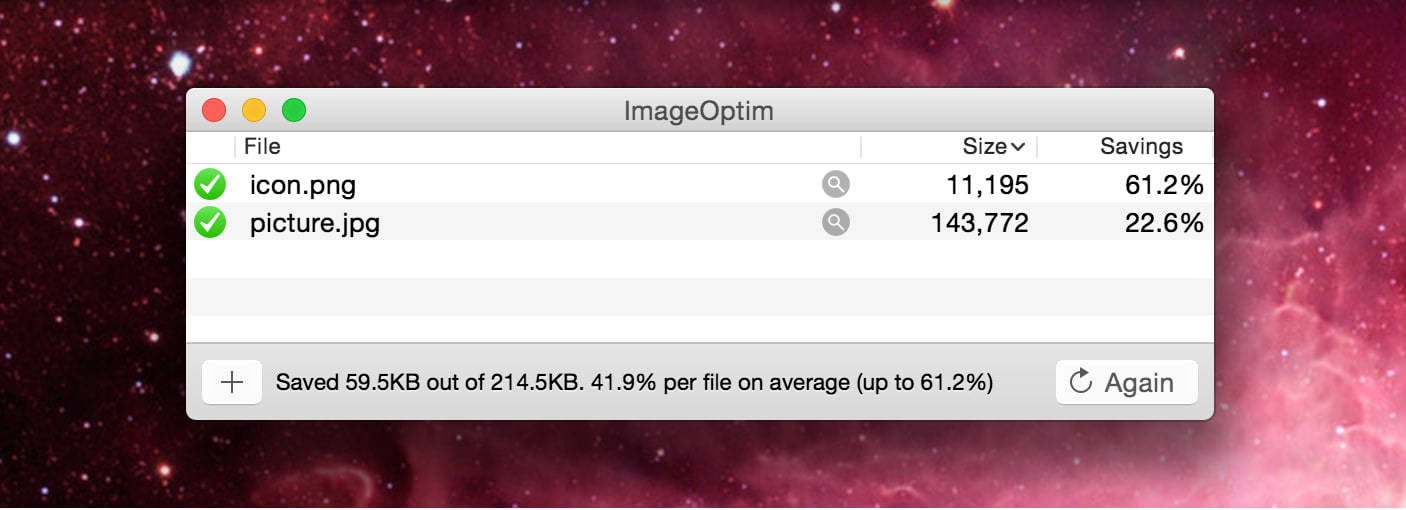
Easy to use desktop application with open source ImageOptim for MacOS allows you to reduce the size by 10-30% GIF, JPEG and PNG without any loss of quality. This is achieved by removing metadata and unnecessary color profiles without re-encoding or reducing the number of colors.
The ImageOptim interface is also quite convenient. Drag a single file, group or folder and the program will begin to compress them with the replacement of the source files and displaying the results.
FileOptimizer (Win)
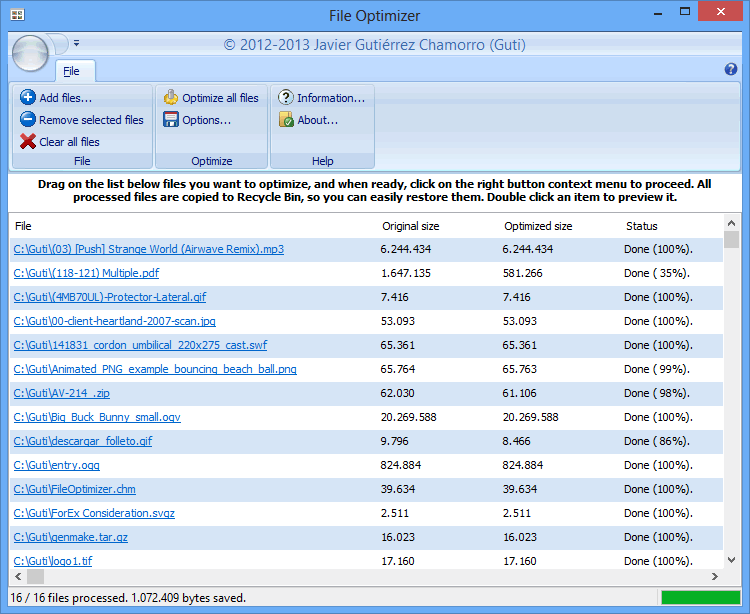
In addition to lossless compression of standard formats, FileOptimizer features are quite extensive. It also reduces executables, archives, Microsoft Office documents, PDFs, and more. The way of working with the program is similar to ImageOptim.
PUNYpng (Web)
PUNYpng is a web service that applies compression at 16-32% lossless. Registration is free, but restrictions apply: you can download only 15 images in batch mode, each not more than 150 kb. For $ 2 per month, you can upgrade your account to PRO, allowing you to improve compression and upload more files.
Lossless compression results table
| Tool | Platform | PNG,% | JPG,% | GIF,% |
|---|---|---|---|---|
| ImageOptim | Mac | 17,8 | 18.3 | 16.2 |
| Fileoptimizer | Win | 42.2 | 17.7 | 15.9 |
| Punypng | Web | 32.1 | 27.5 | 16.1 |
There is no one perfect format, tool or optimization algorithm that would be suitable for all images. To get the best result, you should choose the format and its settings depending on the content, as well as visual and technical requirements.
Useful links to other tools:
- ImageMagick is a command line utility and image editor with a large set of functions ( instructions for setting up ).
- GraphicsMagick is an ImageMagick branch providing better performance thanks to support for multiprocessing.
- Gifsicle - creates and optimizes GIFs.
- Jpegtran - optimizes jpeg images.
- Pngquant - compresses lossy PNGs.
Retina display support
Making mindless support for Retina can be resource intensive, so you must first make sure that you need to support it. To clearly display an image of 100x100 on the screen, say the iPhone, you need to prepare an image of 200x200 in size and display it in a size of 100x100 by compressing the scales.
<img src="hoge.jpg" width="100" height="100"> <!-- hoge.jpg - 200x200 --> Of course, the file size of the image used becomes larger, so you need to use image compression as described above. For JPG, set the compression level to about 30-50. If there is a concern that quality will be lost, it is best to experiment with the level of compression to find the optimal one.
Srcset attribute (HTML5)
The attribute allows the browser to select the most appropriate version of the image based on data such as information reception speed, delay, PPI , device orientation, etc. The idea is to free the developer from the need to describe the conditions under which one or another version of the image should be used. It is necessary to specify only the data on the image, size and density, and the browser will decide for itself what is best to use in this situation.
<img src = "hoge.jpg" srcset = "hoge@2x.jpg 2x"> Picture tag (HTML5)
Similar to the srcset attribute, supported so far only in Chrome, Firefox and Opera browsers.
<picture> <source media="(min-width: 320px)" srcset="s.jpg 1x, s@2x.jpg 2x"> <source media="(min-width: 640px)" srcset="b.jpg 1x, b@2x.jpg 2x"> <img src="s.jpg"> </picture> CSS sprites
Using sprites can improve performance, reduce the weight of graphics and organize the interface elements. Thanks to a single server load of all the elements at once (icons or buttons) in one file. And with CSS, you can display each element separately. To automate the process of creating sprites, you can use the Compass framework or the Grunt collector .
Data: URI
There is an alternative for generating CSS sprites based on data: uri . It minimizes the number of calls to the server and automates the process of assembling and regenerating sprites.
<img src="data:image/gif;base64,R0lGODdhMAAwAPAAAAAAAP///ywAAAAAMAAw AAAC8IyPqcvt3wCcDkiLc7C0qwyGHhSWpjQu5yqmCYsapyuvUUlvONmOZtfzgFz ByTB10QgxOR0TqBQejhRNzOfkVJ+5YiUqrXF5Y5lKh/DeuNcP5yLWGsEbtLiOSp a/TPg7JpJHxyendzWTBfX0cxOnKPjgBzi4diinWGdkF8kjdfnycQZXZeYGejmJl ZeGl9i2icVqaNVailT6F5iJ90m6mvuTS4OK05M0vDk0Q4XUtwvKOzrcd3iq9uis F81M1OIcR7lEewwcLp7tuNNkM3uNna3F2JQFo97Vriy/Xl4/f1cf5VWzXyym7PH hhx4dbgYKAAA7"> But it has limitations: the data encoded in Base64 in this way is about 33% larger in size than their binary equivalent.
To be continued…
Source: https://habr.com/ru/post/269397/
All Articles