Combined ABC and XYZ analysis in Retail
Once upon a time a store owner, he is a seller, could easily remember all the products of his range. Tell about the features of each, the story, how effective the product, knew exactly how it is sold, when to order more ...
With the development of retail, the movement of goods requires other approaches. Accounting systems and analytics of sales, assortment management complement the experience of employees of a store or distribution network.
Serious decisions, for example, on the removal of goods from the range, are not so easy to make. Both the category manager and the store manager need justification for such actions.
')
Therefore, one type of analysis is not enough. Apply the combination of several types (in other words, cross-analysis).
In the article we will consider the main approaches to the organization of cross-analysis using the example of the “Confectionery” product group. And find out who is to blame for the fact that Raffaello is a product with unstable sales.

When working with an assortment of a network or store, a cross-approach is used, which includes ABC and XYZ analyzes.
ABC analysis is a common method of studying the range, with which you can determine the contribution of each product to the turnover and profit of the store, distribute goods into categories for effective management of the range.
The main advantages of ABC analysis:
Minuses:
We wrote more about the ABC analysis methodology here .
XYZ analysis determines the stability of sales of goods for a certain period. The results allow you to divide products into categories and allocate for them a place in stock, inventory levels and the organization of delivery.
Pros XYZ analysis:
Minuses:
More about the XYZ analysis described here .
Combining the results of ABC and XYZ-analyzes is a popular approach to the management of product range. Both methods complement each other well. If ABC analysis allows us to estimate the contribution of each product to the sales structure, then XYZ analysis allows us to estimate sales jumps and its instability.
Combining and using the cross-approach, we get the status or place of each product in the range of product groups, stores or the entire distribution network.
Using the combined analysis gives a number of additional advantages :
It is worth remembering that these types of analysis, as well as their combination, are possible only with a clear account of turnover and sales statistics.
There are 2 ways to conduct cross-analysis: sequential and parallel.
The choice of one of them depends on the goal and the desired results. Explain in detail.
The sequential method assumes that the analysis is first carried out according to one of the types, according to a separate criterion. Further, for each of the categories obtained, an analysis is applied according to 2 criteria, or type, etc.
Visually, it looks like this.
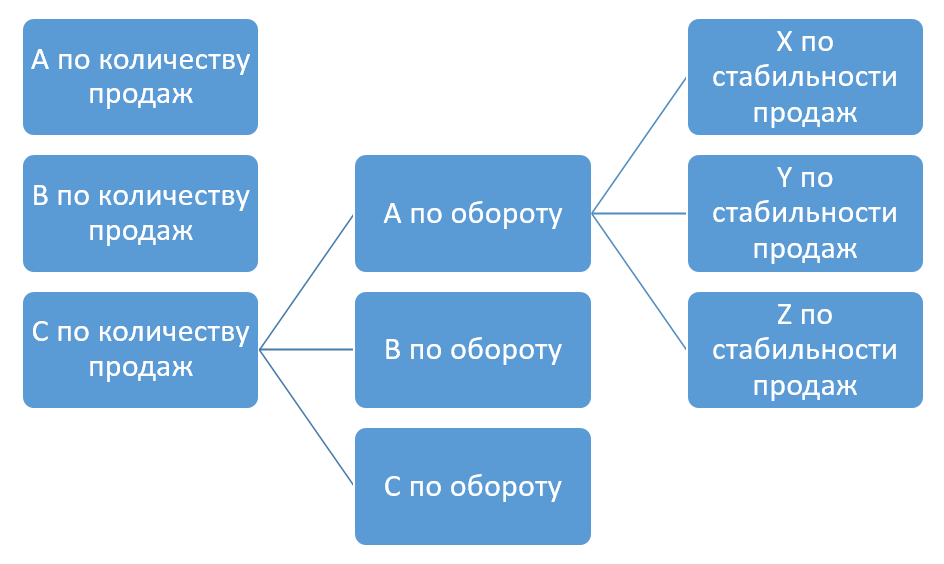
This approach is used for large data arrays. For example, if the cross-analysis is carried out across the entire range of the network, for a large product group.
The second aspect - this analysis involves significant analytical efforts of its organizer. It is necessary to determine the importance of each criterion for future analysis and to build the structure of the analysis in the right order.
For example, the goal of cross-analysis is to optimize the space in the store's warehouse; in this case, the first criterion will be the stability of sales, i.e. XYZ analysis, the second criterion - the number of sales of each product by ABC, the third - the turnover, again by ABC.
When choosing another goal - say, the definition of elite goods - the first criterion of analysis will be the turnover of the store, then the number of sales and entry into checks. But the stability of sales of goods using XYZ analysis, it is not so important.
Those. sequential analysis can be carried out if the quantity of goods in the product group is large enough, if it is necessary to determine the policy of working with the group, develop a management strategy and promote the necessary goods.
The parallel approach involves the construction of a categorical matrix for a given number of criteria, analysis and work with each category in the matrix cell.
This is the matrix for cross-analysis on ABC and XYZ. Usually, the analyst, in any case, simplifies it even more and determines the general format of work for several categories.

For ABC analysis, the matrix can be constructed by several criteria. For example, in the picture below, A in terms of turnover + A in terms of sales + X in terms of sales stability.
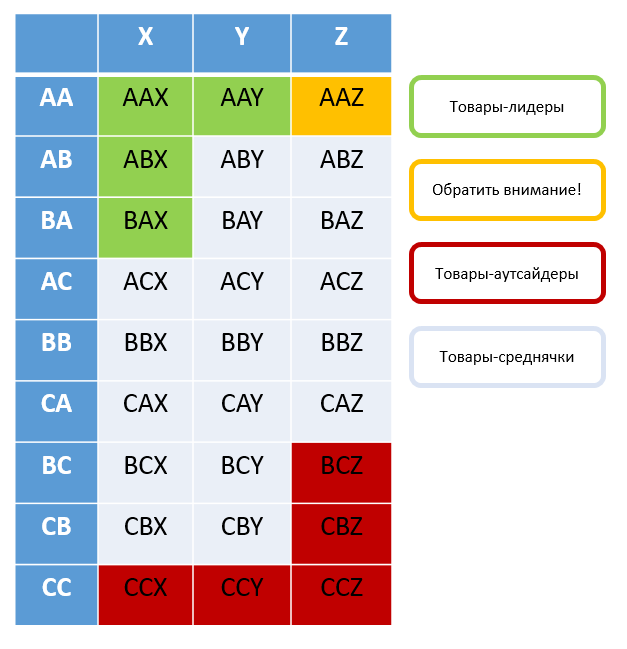
It is possible that not all cells of the ABC-XYZ matrix will be filled. Because quite often sales of goods are not stable, and therefore the X category cannot be distinguished. Or the analyst of the trading network puts such analysis factors that products do not fall into some categories.
A parallel approach should be used when it is necessary to develop clear recommendations for working with products of each category. For example, from store analysts a list of general network recommendations for store managers, for the purchasing department.
This approach is used if there are not so many goods in the assortment.
We use the cross-analysis for the “Confectionery” product group in the supermarket chain conducted using the BI Datawiz.io service.
The analysis will be carried out according to 4 criteria :
The period for analysis is the current year, the interval is a week.
The main range - products sold more often than 2 times a week.
The number of products and the percentage of selected categories can be seen in the picture below.

Let us analyze the results, go through only the key (boundary) categories:
AAAH - for leading goods;
AAAZ - products that are important for the turnover of the network, but with unstable sales, which should definitely pay attention;
BBBY - for middle goods;
CCCZ - for outsider goods.
Category AAAH - 28 products from 1260.
The most "sweet" products. Provide the main turnover of the network, so you need their constant presence.
If you analyze the products included in this category - this is mainly chewing gum, cookies and popular children's sweets.
As can be seen in the picture below, the largest number of sales for chewing gum, sold at cash registers, as they quite significantly affect the turnover of the commodity group.
There are two options for working with the category - creating an excess “insurance” stock or organizing delivery “just in time”, since the goods are sold steadily and an accurate sales forecast is possible.
But it is worth remembering that AAAX products are key for the store, so if the delivery at any stage fails, it can lead to significant problems in the store.
AAAZ - a category with a large question mark.
Why, with a high number of sales, a significant impact on the turnover of the store and frequent entry into checks, sales of goods of this category are so hard to predict?
In category Z there are 23 products from 1260.
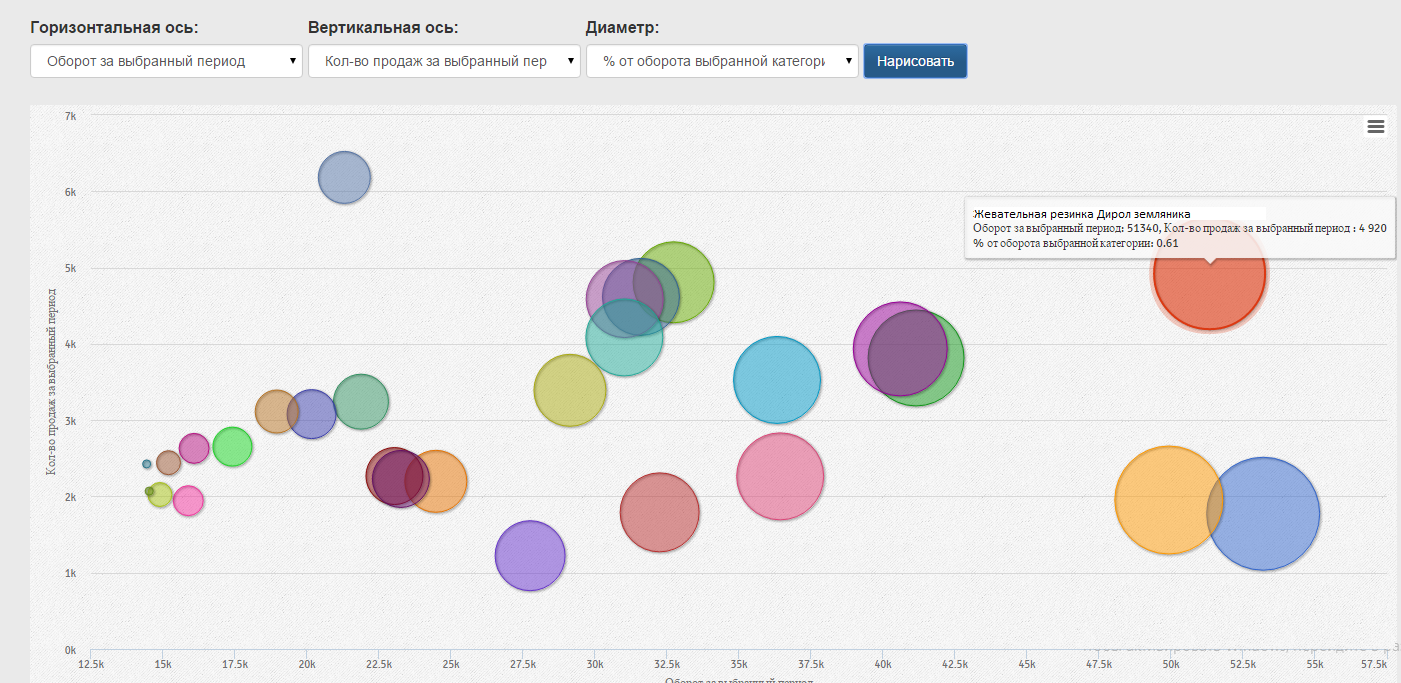
Visualization of key indicators - the turnover and the number of sales showed that Raffaello sweets have the most influence on the turnover of the network and its product group.
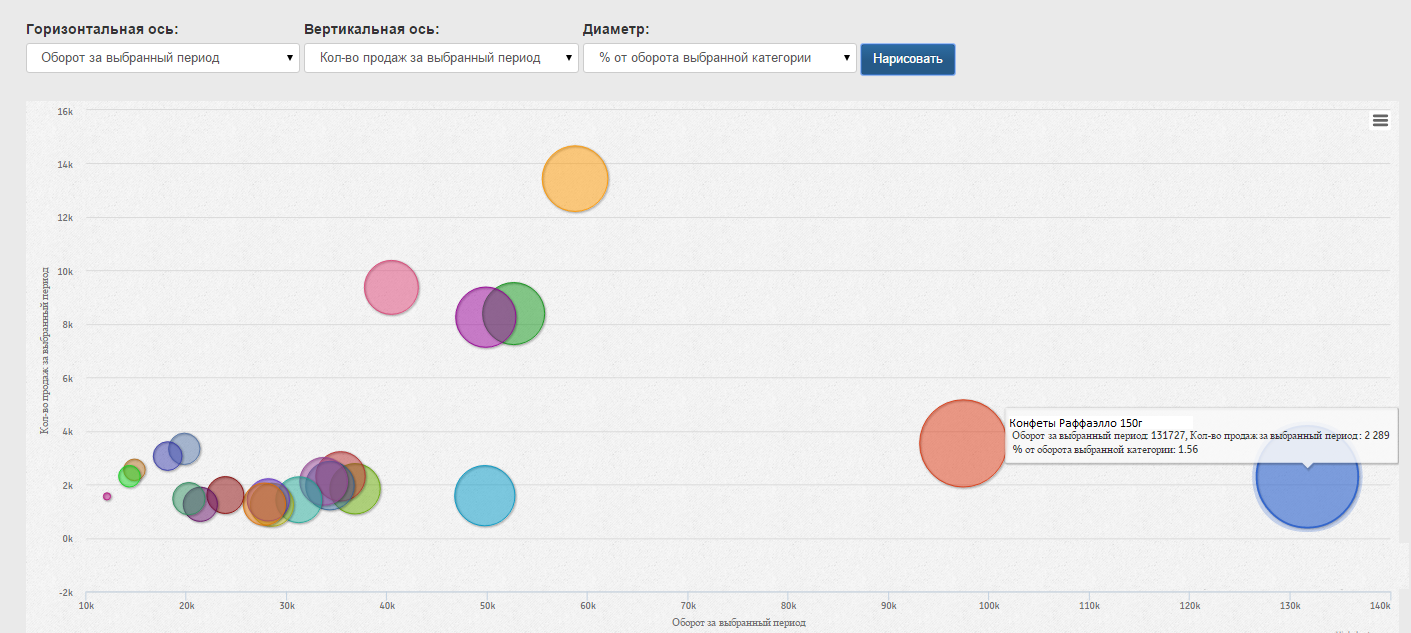
Judging by our life experience, they are quite popular. Why are their sales so unstable, the coefficient of variation is 0.73?
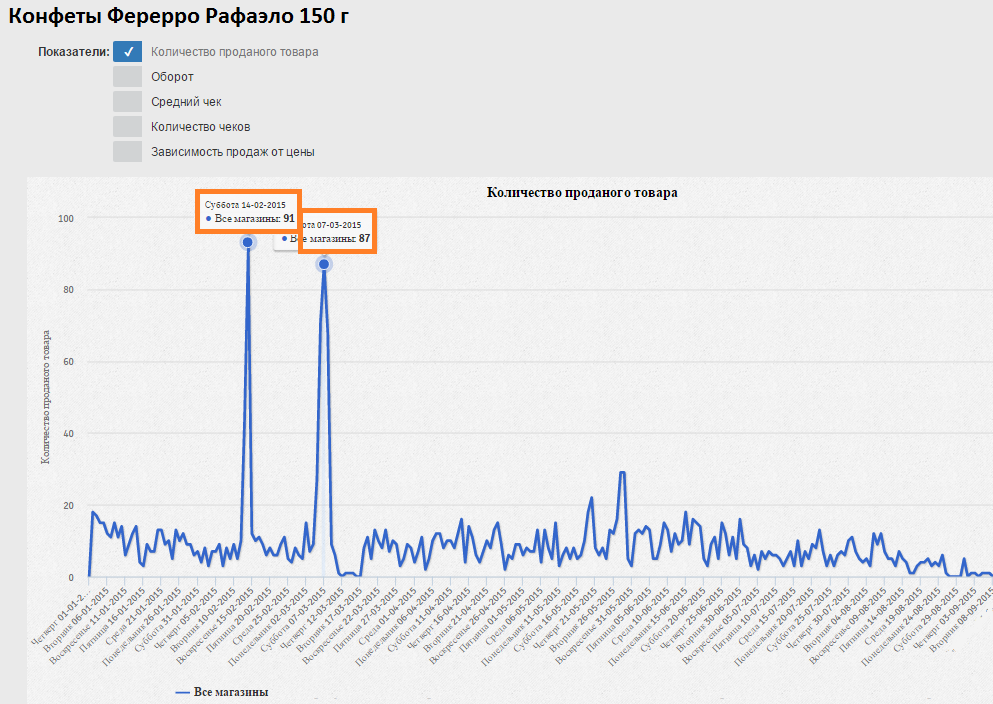
Having opened sales of a particular product, we received an answer to the question.
Sales of candies of this brand just take off twice a year - on February 14 and on March 8. Hence the instability.
AAAZ products with high sales rates are characterized by low predictability, so it’s worthwhile to work out the supply chain:
In the example of Raffaello, it’s just to provide a greater supply of candy for the holidays.
The BBBY category is one of the “average” product categories, they form the basis of the product range. This category includes 63 products from 1260.
Sales of goods are not stable enough in order to ensure continued availability, you need to maintain inventory for insurance.
You can go to the system with a constant time or order quantity.
CCCZ , as the lower category of the matrix, is objectively the most problematic goods - 85 records.
It is important to remember that new products, elite products, custom products, etc. can get here. Therefore, a category requires a thoughtful analysis of each position, and only then radical actions.
But, working with this and related categories makes it possible to select products that can and should be withdrawn from the range by selling off the remains.
On the screenshot below, you can see these products, which are in the area of the schedule around 0 and have virtually no effect on the turnover of the trading network.
Thus, the approaches to working with each category are highlighted.
The main conditions for organizing such a fairly complex analytical activity is the consideration of all the necessary indicators, the speed of processing the results, saving time and effort of the network staff.
BI Datawiz.io allows you to combine up to 4 criteria when analyzing the product range.
The combination of several options for analysis, or several criteria makes it possible to more clearly see all the nuances of the range. And that means applying complex solutions and recommendations for managing the assortment of a commodity group, a store or the entire network, warehouse stocks and organizing supplies.
With the development of retail, the movement of goods requires other approaches. Accounting systems and analytics of sales, assortment management complement the experience of employees of a store or distribution network.
Serious decisions, for example, on the removal of goods from the range, are not so easy to make. Both the category manager and the store manager need justification for such actions.
')
Therefore, one type of analysis is not enough. Apply the combination of several types (in other words, cross-analysis).
In the article we will consider the main approaches to the organization of cross-analysis using the example of the “Confectionery” product group. And find out who is to blame for the fact that Raffaello is a product with unstable sales.
When working with an assortment of a network or store, a cross-approach is used, which includes ABC and XYZ analyzes.
What is the essence and why we choose them?
ABC analysis is a common method of studying the range, with which you can determine the contribution of each product to the turnover and profit of the store, distribute goods into categories for effective management of the range.
The main advantages of ABC analysis:
- rationalization of assortment management - makes it clear the importance of goods, distribute the efforts of store managers, categories;
- quick result and quick application of management decisions;
- if carried out regularly, a comparison with previous periods makes it possible to track the stages of the product life cycle.
Minuses:
- It is necessary to take into account many additional factors, such as new items, elite goods, etc.
- You need an array of data for analytics for a certain period: a database of checks, sales or other retail data;
- stability of the commodity market is important, if any unforeseen situations occur (sharp inflation, political unrest, etc.), the data of the ABC analysis may be inaccurate.
We wrote more about the ABC analysis methodology here .
XYZ analysis determines the stability of sales of goods for a certain period. The results allow you to divide products into categories and allocate for them a place in stock, inventory levels and the organization of delivery.
Pros XYZ analysis:
- data for managing the range of goods and stocks, organizing work with suppliers;
- setting up different delivery options for different product categories;
- using analysis to predict the stability of demand;
- identification of problem stores with unstable sales;
- definition of commodity holes, correction of the supply chain of goods.
Minuses:
- need, as well as for ABC, stability of indicators, without shaking the market;
- data for several years are needed for full analysis;
- It is difficult to work with seasonal products, and there are quite a lot of them in retail;
- cannot be used on products with a short life cycle.
More about the XYZ analysis described here .
Combining the results of ABC and XYZ-analyzes is a popular approach to the management of product range. Both methods complement each other well. If ABC analysis allows us to estimate the contribution of each product to the sales structure, then XYZ analysis allows us to estimate sales jumps and its instability.
Combining and using the cross-approach, we get the status or place of each product in the range of product groups, stores or the entire distribution network.
Using the combined analysis gives a number of additional advantages :
- identification of goods with stable sales, significant for the turnover of the store or network, and unprofitable goods;
- an increase in the share of profitable goods without violating the principles of assortment policy;
- determination of the causes affecting the quantity and place of goods stored in the warehouse;
- the redistribution of efforts by staff to manage the range and its stocks.
It is worth remembering that these types of analysis, as well as their combination, are possible only with a clear account of turnover and sales statistics.
Combined analysis methods
There are 2 ways to conduct cross-analysis: sequential and parallel.
The choice of one of them depends on the goal and the desired results. Explain in detail.
The sequential method assumes that the analysis is first carried out according to one of the types, according to a separate criterion. Further, for each of the categories obtained, an analysis is applied according to 2 criteria, or type, etc.
Visually, it looks like this.
This approach is used for large data arrays. For example, if the cross-analysis is carried out across the entire range of the network, for a large product group.
The second aspect - this analysis involves significant analytical efforts of its organizer. It is necessary to determine the importance of each criterion for future analysis and to build the structure of the analysis in the right order.
For example, the goal of cross-analysis is to optimize the space in the store's warehouse; in this case, the first criterion will be the stability of sales, i.e. XYZ analysis, the second criterion - the number of sales of each product by ABC, the third - the turnover, again by ABC.
When choosing another goal - say, the definition of elite goods - the first criterion of analysis will be the turnover of the store, then the number of sales and entry into checks. But the stability of sales of goods using XYZ analysis, it is not so important.
Those. sequential analysis can be carried out if the quantity of goods in the product group is large enough, if it is necessary to determine the policy of working with the group, develop a management strategy and promote the necessary goods.
The parallel approach involves the construction of a categorical matrix for a given number of criteria, analysis and work with each category in the matrix cell.
This is the matrix for cross-analysis on ABC and XYZ. Usually, the analyst, in any case, simplifies it even more and determines the general format of work for several categories.
For ABC analysis, the matrix can be constructed by several criteria. For example, in the picture below, A in terms of turnover + A in terms of sales + X in terms of sales stability.
It is possible that not all cells of the ABC-XYZ matrix will be filled. Because quite often sales of goods are not stable, and therefore the X category cannot be distinguished. Or the analyst of the trading network puts such analysis factors that products do not fall into some categories.
A parallel approach should be used when it is necessary to develop clear recommendations for working with products of each category. For example, from store analysts a list of general network recommendations for store managers, for the purchasing department.
This approach is used if there are not so many goods in the assortment.
Example and description of options for working with each category
We use the cross-analysis for the “Confectionery” product group in the supermarket chain conducted using the BI Datawiz.io service.
The analysis will be carried out according to 4 criteria :
- turnover (ABC)
- number of sales (ABC)
- the number of checks with a particular product (ABC)
- sales stability (XYZ)
The period for analysis is the current year, the interval is a week.
The main range - products sold more often than 2 times a week.
The number of products and the percentage of selected categories can be seen in the picture below.
Let us analyze the results, go through only the key (boundary) categories:
AAAH - for leading goods;
AAAZ - products that are important for the turnover of the network, but with unstable sales, which should definitely pay attention;
BBBY - for middle goods;
CCCZ - for outsider goods.
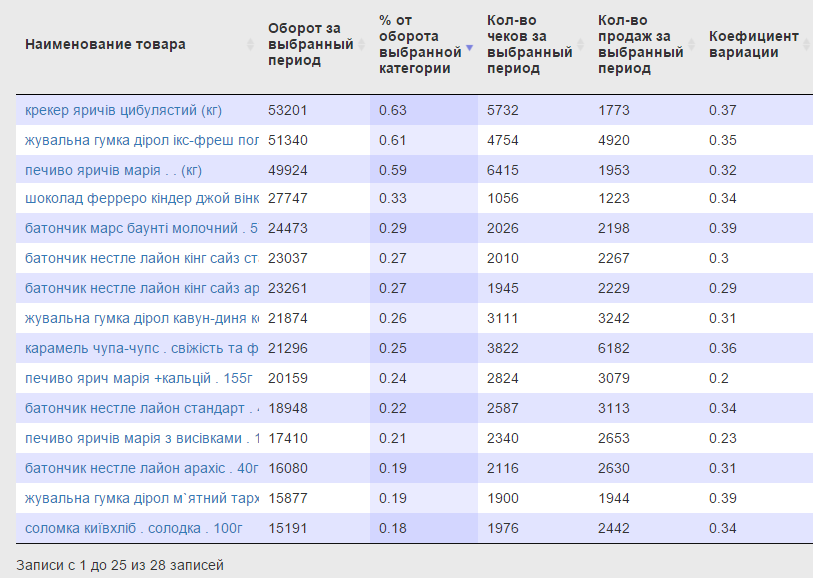
Category AAAH - 28 products from 1260.
The most "sweet" products. Provide the main turnover of the network, so you need their constant presence.
If you analyze the products included in this category - this is mainly chewing gum, cookies and popular children's sweets.
As can be seen in the picture below, the largest number of sales for chewing gum, sold at cash registers, as they quite significantly affect the turnover of the commodity group.
There are two options for working with the category - creating an excess “insurance” stock or organizing delivery “just in time”, since the goods are sold steadily and an accurate sales forecast is possible.
But it is worth remembering that AAAX products are key for the store, so if the delivery at any stage fails, it can lead to significant problems in the store.
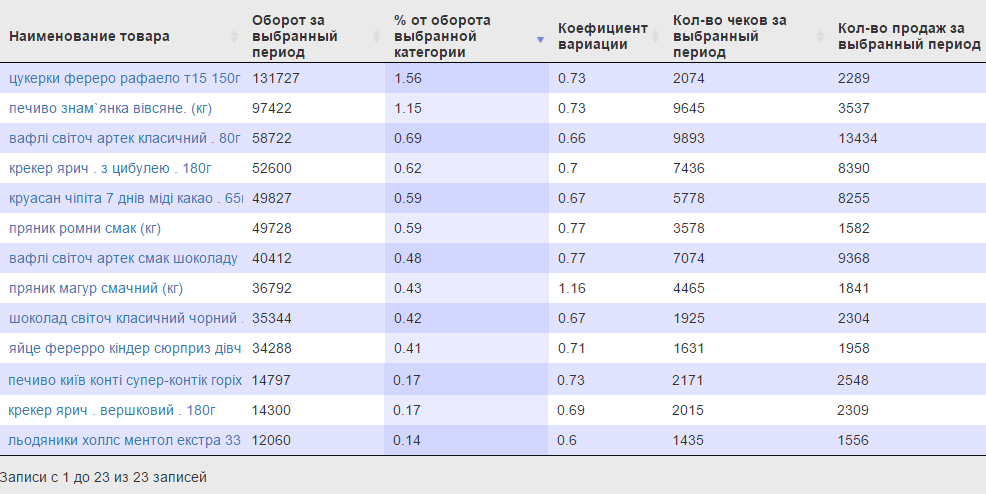
AAAZ - a category with a large question mark.
Why, with a high number of sales, a significant impact on the turnover of the store and frequent entry into checks, sales of goods of this category are so hard to predict?
In category Z there are 23 products from 1260.
Visualization of key indicators - the turnover and the number of sales showed that Raffaello sweets have the most influence on the turnover of the network and its product group.
Judging by our life experience, they are quite popular. Why are their sales so unstable, the coefficient of variation is 0.73?
Having opened sales of a particular product, we received an answer to the question.
Sales of candies of this brand just take off twice a year - on February 14 and on March 8. Hence the instability.
AAAZ products with high sales rates are characterized by low predictability, so it’s worthwhile to work out the supply chain:
- transfer part of the goods to the order system with a constant amount (volume) of the order;
- provide more frequent deliveries of goods;
- select suppliers located close to the store, thereby reducing the amount of warehouse stock;
- increase the frequency of control.
In the example of Raffaello, it’s just to provide a greater supply of candy for the holidays.
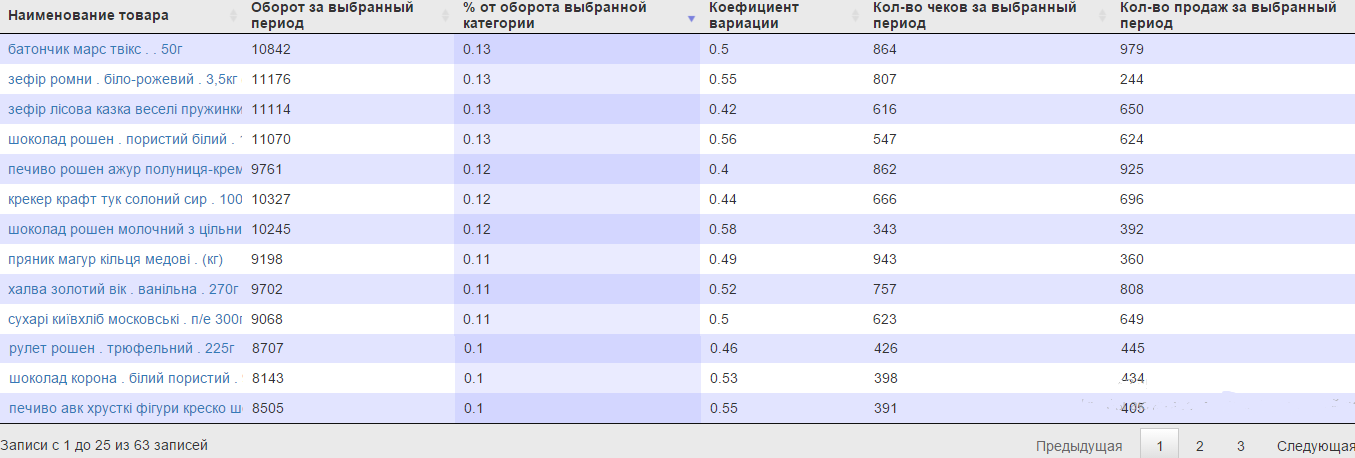
The BBBY category is one of the “average” product categories, they form the basis of the product range. This category includes 63 products from 1260.
Sales of goods are not stable enough in order to ensure continued availability, you need to maintain inventory for insurance.
You can go to the system with a constant time or order quantity.
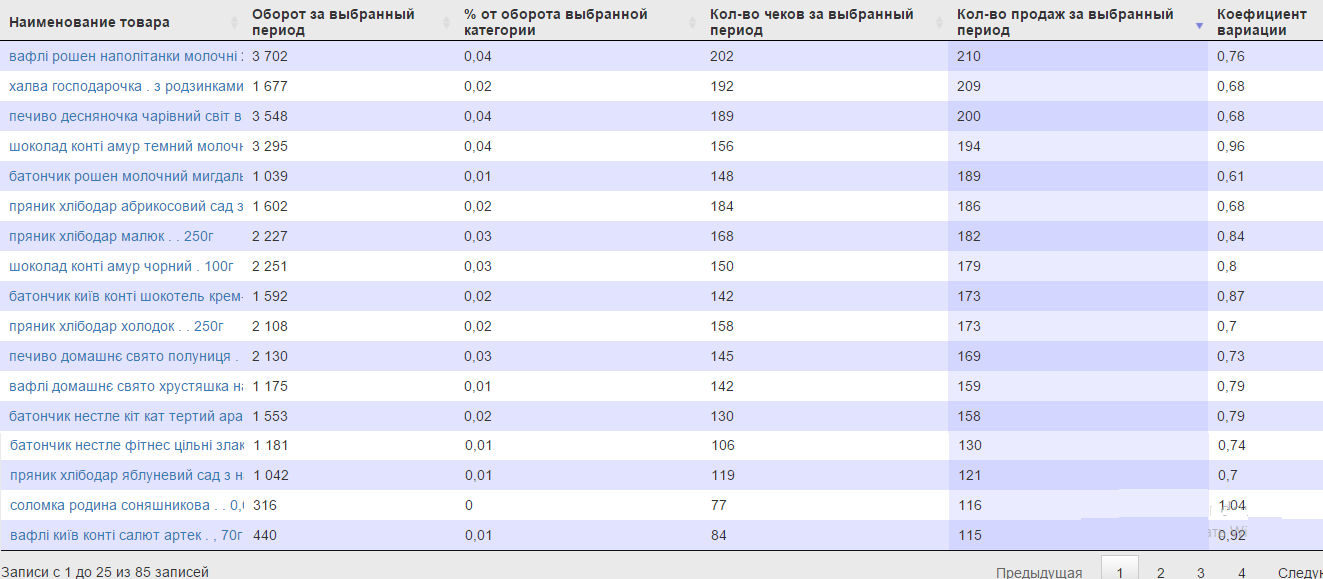
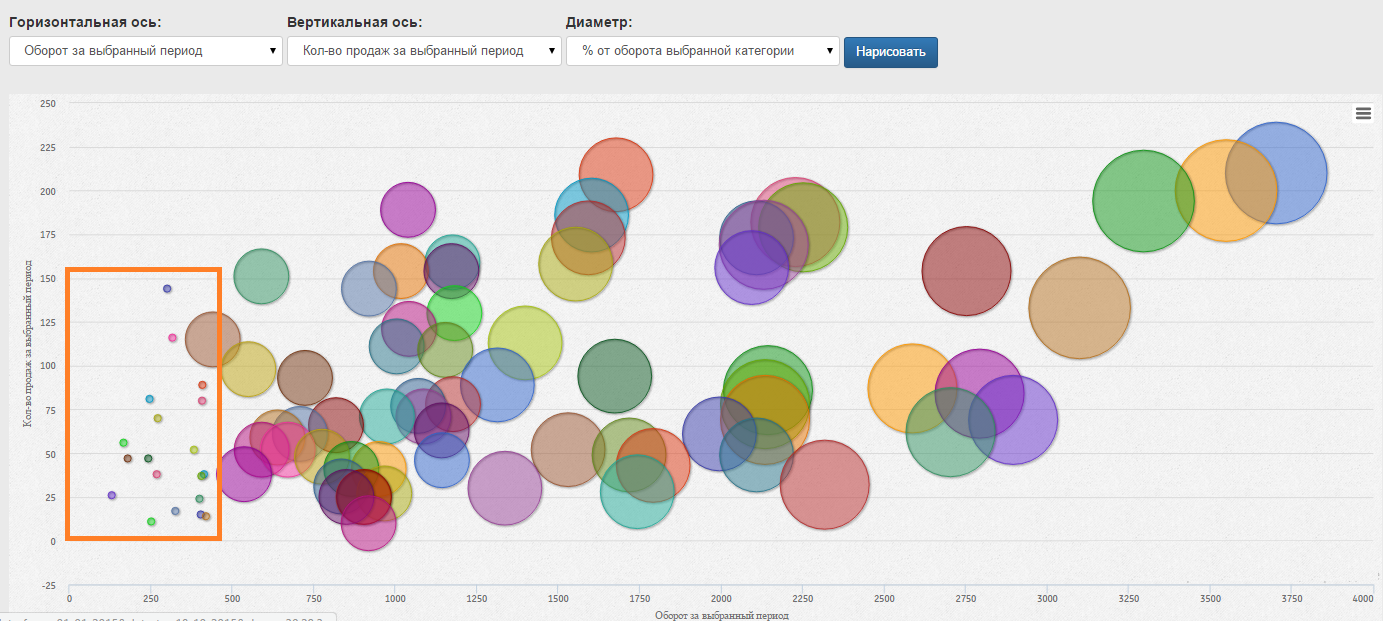
CCCZ , as the lower category of the matrix, is objectively the most problematic goods - 85 records.
It is important to remember that new products, elite products, custom products, etc. can get here. Therefore, a category requires a thoughtful analysis of each position, and only then radical actions.
But, working with this and related categories makes it possible to select products that can and should be withdrawn from the range by selling off the remains.
On the screenshot below, you can see these products, which are in the area of the schedule around 0 and have virtually no effect on the turnover of the trading network.
Thus, the approaches to working with each category are highlighted.
The main conditions for organizing such a fairly complex analytical activity is the consideration of all the necessary indicators, the speed of processing the results, saving time and effort of the network staff.
BI Datawiz.io allows you to combine up to 4 criteria when analyzing the product range.
The combination of several options for analysis, or several criteria makes it possible to more clearly see all the nuances of the range. And that means applying complex solutions and recommendations for managing the assortment of a commodity group, a store or the entire network, warehouse stocks and organizing supplies.
Source: https://habr.com/ru/post/269167/
All Articles