iOs debug master
Once I almost completely abandoned the mouse to navigate Xcode and quite happy about it. The next step is to drop the visual debugger controls. What for? - Increase opportunities, reduce debugging time, spend less calories to move a heavy hand (we need calories to work with our head) and thereby provoke less tunnel syndrome.
.
Particularly new discoveries in the article will not, just summarize that you yourself knew well and how it can be used for someone in a new way.
I don’t consider such topics: how to work in Xcode, how to debug an application at all, at what point you need to do it and why, what is LLDB , what is Step Into and Step Over, etc.
')
Immediately to the examples:
We reject this panel here:

Yes, and that's about this soon forget

Now our new best friend is this tempting white canvas, you can stretch it to the full length or even the whole screen.

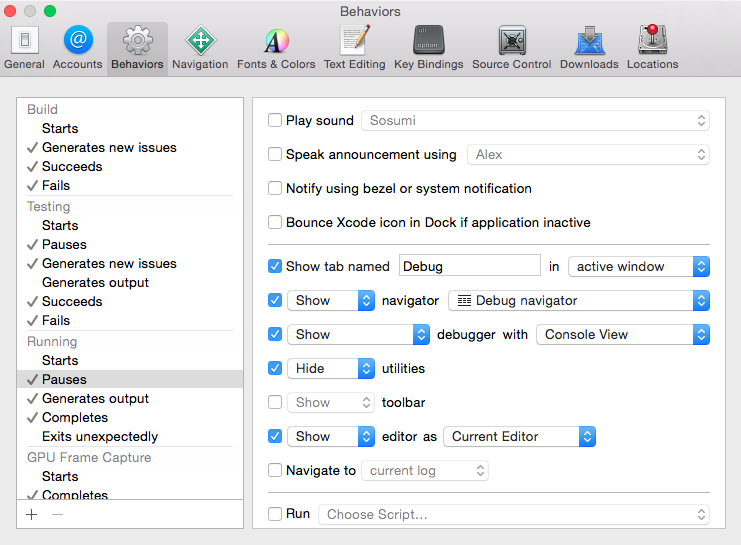
Thanks to my colleague: he realized my old dream - to open the debugger console in a new window. And it always bothered me that I had just opened and set up the tabs as you need, so immediately at the first breakpoint everything got messed up. To prevent this, go to Xcode -> Behaviors -> Edit behaviours ... Next we need the Running section -> Pause .
We select Show tab named , we write our unique tab name there, for example Debug (I note that the tab is not duplicated during repeated starts), at the end we set the active window - this, strangely enough, opens a new tab (Cmd + T) for our debugger. I hid the unnecessary right panel, but this is optional. In general, customization of the environment under different conditions is in the section Behaviors
Everything, we are adjusted, we move further.
Add immediately to the treasury of useful hotkeys who did not know Cmd + Shift + C. This is a quick transition to the console.
Cmd + Shift + Y - this is to hide / show the console.
Our new teams:
Step Into - step or short s
Step Over - next or short n
Step Out - finish
Continue - continue or c
Disable all breakpoints - breakpoint disable
For a complete list of lldb commands, you can go here.
I will not list all the possibilities of direct LLDB commands, but their list is longer than the Xcode visual environment allows us to do and everyone has the right to decide whether to use this approach or not, and which teams are necessary and interesting. I will dwell on what showed where to look.
The convenience of executing commands is that there is the usual transition to the previous / next command in the terminal through the up and down arrows.
As a result, our work with the debugger looks like this:

I do not know about you, but I was not lucky to write a project on Swift from scratch, but with the release of a new language in a huge obj-c project I had to write all new files on Swifte. I do not write about all inconsistencies, but the main problem in debugging is probably the following:
Create a simple model class on Swift
Now we write a simple array on obj-c with our class:
Now we set breakpoint on the next line and look at what we would see in the Variables:
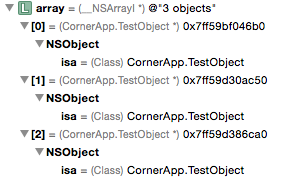
Familiar? And where are our name and index
Now we look that we can do it ourselves in the console:
p is print
po is a print object , throws a description message to an object, note that you can still send a message to debugDescription
po array [0] .name - does not work, because for the debugger, the zero element in the array is of type id. But sending the name message (po [ array [0] name] ) works great. Do not forget that obj-c is a message oriented programming language.
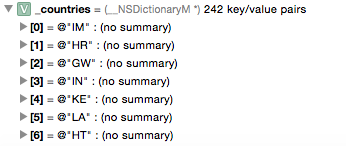
The following case: we have an API - we go to the server for a list of countries, then we convert them into internal logic and store it somewhere. For example, our modelView follows the data in the repository and searches for the model in the dictionary by key:
What do we see in the variables? 242 countries, great, how can we quickly find Russia?
I know, like this:
And I want to note that in the debugger line, autocompletion works perfectly for sending messages in objective-c
Surely, if any non-trivial UI was done, there were situations when something in the interface went away and you need to figure out who is to blame. With this restart, the application is threatened by the fact that it may not be able to reproduce the situation. This is where working with a debugger is irreplaceable.
As a result of doing simple
see something like this:
We immediately see the view set, their frames, properties, everything that Apple developers stuffed into the standard description description.
If you need we can easily clarify some property, you can use the address in memory directly:
But finally, a piece of code that can get across the hierarchy all the views of a given class may seem useful to you. I use it myself.
There is a good collection of Facebook LLDB commands from LindB - Chisel
For example, there is already a command with recursive output of the nested view - pviews and controllers - pvc There are convenient show / hide commands that allow you to hide or show this or that layer, view, without continue.
The git has a description of the commands and installation instructions, I just want to note that you need a brew package manager if you don’t have it and create an .lldbinit file with your hands, which you, like me, may not have and add the code that brew issues after installing chisel'a:
Then we create the .lldbinit file in the root directory and push the script there:
Please note that the script may vary, for example, the one specified in the chisel itself is different.
Commands will be available when you restart Xcode, if you are too lazy to do this, you can:
Thank you all who read. I hope someone has discovered a couple of tricks for himself.
He described each of the possibilities in no detail, but he tried to show the direction to whom he needed - he could sort it out or ask in the comments!
.
Particularly new discoveries in the article will not, just summarize that you yourself knew well and how it can be used for someone in a new way.
I don’t consider such topics: how to work in Xcode, how to debug an application at all, at what point you need to do it and why, what is LLDB , what is Step Into and Step Over, etc.
')
Immediately to the examples:
We configure the console
We reject this panel here:
Yes, and that's about this soon forget
Now our new best friend is this tempting white canvas, you can stretch it to the full length or even the whole screen.
Thanks to my colleague: he realized my old dream - to open the debugger console in a new window. And it always bothered me that I had just opened and set up the tabs as you need, so immediately at the first breakpoint everything got messed up. To prevent this, go to Xcode -> Behaviors -> Edit behaviours ... Next we need the Running section -> Pause .
We select Show tab named , we write our unique tab name there, for example Debug (I note that the tab is not duplicated during repeated starts), at the end we set the active window - this, strangely enough, opens a new tab (Cmd + T) for our debugger. I hid the unnecessary right panel, but this is optional. In general, customization of the environment under different conditions is in the section Behaviors
Everything, we are adjusted, we move further.
Run the debugger
Add immediately to the treasury of useful hotkeys who did not know Cmd + Shift + C. This is a quick transition to the console.
Cmd + Shift + Y - this is to hide / show the console.
Our new teams:
Step Into - step or short s
Step Over - next or short n
Step Out - finish
Continue - continue or c
Disable all breakpoints - breakpoint disable
For a complete list of lldb commands, you can go here.
I will not list all the possibilities of direct LLDB commands, but their list is longer than the Xcode visual environment allows us to do and everyone has the right to decide whether to use this approach or not, and which teams are necessary and interesting. I will dwell on what showed where to look.
The convenience of executing commands is that there is the usual transition to the previous / next command in the terminal through the up and down arrows.
As a result, our work with the debugger looks like this:
Swift and obj-c! What is inside the facility?
I do not know about you, but I was not lucky to write a project on Swift from scratch, but with the release of a new language in a huge obj-c project I had to write all new files on Swifte. I do not write about all inconsistencies, but the main problem in debugging is probably the following:
Create a simple model class on Swift
class TestObject: NSObject { var name: String = "name" var index: Int = 123 } Now we write a simple array on obj-c with our class:
NSArray *array = @[[[TestObject alloc] init], [[TestObject alloc] init], [[TestObject alloc] init]]; Now we set breakpoint on the next line and look at what we would see in the Variables:
Familiar? And where are our name and index
Now we look that we can do it ourselves in the console:
(lldb) p array (__NSArrayI *) $0 = 0x00007f9a1878c6b0 @"3 objects" (lldb) po array <__NSArrayI 0x7f9a1878c6b0>( <CornerApp.TestObject: 0x7f9a1870fc60>, <CornerApp.TestObject: 0x7f9a1878c650>, <CornerApp.TestObject: 0x7f9a1878c680> ) (lldb) po [array debugDescription] <__NSArrayI 0x7f9a1878c6b0>( <CornerApp.TestObject: 0x7f9a1870fc60>, <CornerApp.TestObject: 0x7f9a1878c650>, <CornerApp.TestObject: 0x7f9a1878c680> ) (lldb) po array[0] <CornerApp.TestObject: 0x7f9a1870fc60> (lldb) po array[0].name error: property 'name' not found on object of type 'id' error: 1 errors parsing expression (lldb) po [array[0] name] name (lldb) p is print
po is a print object , throws a description message to an object, note that you can still send a message to debugDescription
po array [0] .name - does not work, because for the debugger, the zero element in the array is of type id. But sending the name message (po [ array [0] name] ) works great. Do not forget that obj-c is a message oriented programming language.
find me
The following case: we have an API - we go to the server for a list of countries, then we convert them into internal logic and store it somewhere. For example, our modelView follows the data in the repository and searches for the model in the dictionary by key:
- (CACountry *)countryByCode:(NSString *)code { return [_countries objectForKey:code]; } What do we see in the variables? 242 countries, great, how can we quickly find Russia?
I know, like this:
(lldb) po [_countries objectForKey:@"RU"] <CACountry: 0x7fae00630ba0> (lldb) po [[[_countries objectForKey:@"RU"] title] string] And I want to note that in the debugger line, autocompletion works perfectly for sending messages in objective-c
Magical UIView
Surely, if any non-trivial UI was done, there were situations when something in the interface went away and you need to figure out who is to blame. With this restart, the application is threatened by the fact that it may not be able to reproduce the situation. This is where working with a debugger is irreplaceable.
As a result of doing simple
(lldb) po self.view.subviews see something like this:
<UICollectionView: 0x7fd9fb81a200; frame = (0 0; 375 667); clipsToBounds = YES; opaque = NO; autoresize = W+H; gestureRecognizers = <NSArray: 0x7fd9fb416cb0>; layer = <CALayer: 0x7fd9fb4067f0>; contentOffset: {0, -180}; contentSize: {375, 843}> collection view layout: <TGLStackedLayout: 0x7fd9fb410000>, <CASortView: 0x7fd9fb4468c0; frame = (67.5 607; 240 60); clipsToBounds = YES; alpha = 0; opaque = NO; autoresize = RM+BM; layer = <CALayer: 0x7fd9fb481290>>, <UIView: 0x7fd9fb47e240; frame = (0 0; 375 687); alpha = 0; layer = <CALayer: 0x7fd9fb4895a0>> We immediately see the view set, their frames, properties, everything that Apple developers stuffed into the standard description description.
If you need we can easily clarify some property, you can use the address in memory directly:
(lldb) po [0x7fae2b792ba0 backgroundColor] UIDeviceWhiteColorSpace 0 1 But finally, a piece of code that can get across the hierarchy all the views of a given class may seem useful to you. I use it myself.
import UIKit extension UIView { func debugAllSubviewsOfClass(cls: AnyClass) -> [String] { func goDeepAndPrint(inout views: [String], currentView: UIView) { for v in currentView.debugSubview() { views.append(v.debugDescriptionWithParent()) goDeepAndPrint(&views, currentView:v) } } var views = [String]() goDeepAndPrint(&views, currentView:self) return views } func debugDescriptionWithParent() -> String { let parentAddress = self.superview != nil ? String(format: "%p", self.superview!) : "nil" return "\(self.description), parent = \(parentAddress)" } func debugSubview() -> [UIView] { return self.subviews } } extension UITableView { override func debugSubview() -> [UIView] { return self.subviews + self.visibleCells } } extension UICollectionView { override func debugSubview() -> [UIView] { return self.subviews + self.visibleCells() } } UPD: expanding the LLDB command set
There is a good collection of Facebook LLDB commands from LindB - Chisel
For example, there is already a command with recursive output of the nested view - pviews and controllers - pvc There are convenient show / hide commands that allow you to hide or show this or that layer, view, without continue.
The git has a description of the commands and installation instructions, I just want to note that you need a brew package manager if you don’t have it and create an .lldbinit file with your hands, which you, like me, may not have and add the code that brew issues after installing chisel'a:
ruby -e "$(curl -fsSL https://raw.githubusercontent.com/Homebrew/install/master/install)" ... brew install chisel ==> Downloading https://github.com/facebook/chisel/archive/1.3.0.tar.gz ==> Downloading from https://codeload.github.com/facebook/chisel/tar.gz/1.3.0 ######################################################################## 100.0% ==> Caveats Add the following line to ~/.lldbinit to load chisel when Xcode launches: command script import /usr/local/opt/chisel/libexec/fblldb.py Then we create the .lldbinit file in the root directory and push the script there:
command script import /usr/local/opt/chisel/libexec/fblldb.py Please note that the script may vary, for example, the one specified in the chisel itself is different.
Commands will be available when you restart Xcode, if you are too lazy to do this, you can:
command source ~/.lldbinit Summary
- You can work with the debugger not only via Xcode buttons.
- How to configure console opening when debugging in a new tab? The very beginning - the big picture
- Quick transition to the console - Cmd + Shift + C ,
minimize / expand console - Cmd + Shift + Y - Our new teams:
Step Into - step or short s
Step Over - next or short n
Continue - continue or c
Disable all breakpoints - breakpoint disable
Here is the entire list of LLDB commands. - Obj-c does not see the properties of a Swift-th class object? No problem:
(lldb) po [array[0] name] - In the variables window 242 key in the dictionary?
Looking for a quick:(lldb) po [[[_countries objectForKey:@"RU"] title] string] - We put chisel and expand the LLDB command set
Thank you all who read. I hope someone has discovered a couple of tricks for himself.
He described each of the possibilities in no detail, but he tried to show the direction to whom he needed - he could sort it out or ask in the comments!
Source: https://habr.com/ru/post/269095/
All Articles