Mastering the Data Science specialty on Coursera: personal experience (part 2)
We publish the second part of the post of Vladimir Podolsky vpodolskiy , an analyst in the department for work with education IBS , who graduated from the specialty Data Science on Coursera. This is a set of 9 course courses from Johns Hopkins University + thesis, the successful completion of which entitles you to a certificate.
Read in the first part : On the specialty Data Science in general. Courses: Data Analysis Tools (R Programming); Preliminary data processing; Documenting data processing.
')
Part 2
Courses on stat. data processing and machine learning; Practice: creation of software for data processing (thesis project); other useful courses on the Curser.
Statistical data processing and machine learning (courses 6, 7, 8)
Perhaps the most mathematic courses of all. They will talk about mathematical statistics, its basic concepts and methods of statistical data processing: testing hypotheses, determining p-values, building confidence intervals, regression models, and much more. The culmination of all mathematics in Data Science is a course on machine learning methods. Although most of the algorithms of machine learning and the mathematics behind them are not disclosed within the courses, this course is also one of the fundamental ones.
I will not go into details - courses 6 and 7 are replete with mathematical definitions, formulas and proofs of theorems. These are very important courses, giving an understanding of how statistics actually work ( and how it does not work , which is also important). Since most of the mathematics described in the lectures is implemented in R with the help of functions, there is no formal need to go into mathematical details. Nevertheless, I am inclined to believe that the most mathematicized DSS courses are among the most useful. Having understood all the subtleties of statistical data processing, you can safely rush to the embrasure, on analytical puzzles with data of almost any dimension and detail.
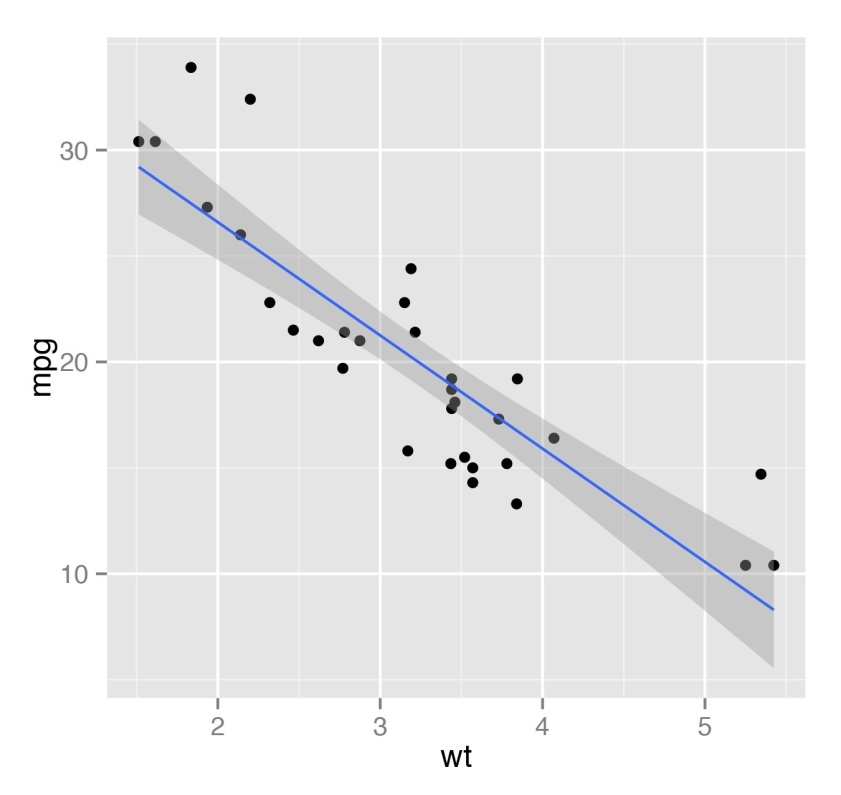
In addition to basic statistics, as part of these courses, they will teach you to summarize data using a mathematical method at a qualitatively new level. In particular, it will be described and shown how to build regression models, how to visualize them. In fact, in regards to regression models, the functional R is very wide. For example, having a small data set in hand, you can immediately build a generalized linear model (generalized linear model - glm), which will describe them and with which you can even predict new data points. The figure below shows an example of the simplest regression line. For the picture, the standard data set for R cars is used.
A serious emphasis in this block of courses is made on a statistical conclusion, that is, proof or refutation of hypotheses. Since, as a rule, we have an incomplete data set (i.e., some sample of them) about a certain thing or phenomenon, we can only judge the characteristics of the complete set with a certain probability. Therefore, assumptions about a particular property of a complete data set are formed in the form of statistical hypotheses that can be proved or disproved with a certain probability. For example, with a certain set of temperature numbers during the winter week, we can formulate and test a hypothesis about the average temperature in winter. Of course, on a limited sample with 100% probability, we will not be able to prove or disprove the hypothesis (for this we would need to observe the temperature throughout the winter), but this can be done for a lower probability, for example, 95%.
Testing statistical hypotheses based on a variety of statistical criteria (for example, Pearson's agreement criterion) allows one to draw certain conclusions about the data set as a whole, which makes it easier for the analyst to understand what the existing data describe, what questions are asked and how they answer. In addition, statistical inference also has value in data visualization, since it makes it possible with a certain degree of probability to determine how the data points are generally distributed.
Despite the rather strong courses on statistical inference and building regression models, the machine learning course is just a general overview of the basic methods of machine learning implemented in R as a set of functions. With several basic interfaces, a wide range of well-documented machine learning algorithms, including support vector machines (SVM), logistic regression, K-proximate, and others, are easily accessible in R. By connecting the required package and using only one or two lines of code, you can train the classifier. R makes machine learning easy and affordable even for an unprepared person, removing unnecessary details. However, this is why the machine learning course on R left a double impression: on the one hand, everything was explained as clearly and transparently as possible, on the other hand, there was clearly not enough detailed explanation of the principles of operation of one or another machine learning algorithm. Of course, such detailing was not the goal of the course, but still the feeling of some “magic” of what was happening remained. To dispel this magical feeling, it is recommended to look at a special basic machine learning course from one of the creators of Coursera, Andrew Una (Andrew Ng).
Practice: creation of software for data processing (course 9, thesis project)
The code written in R will help you in processing the data only if the following conditions are met: you have data at hand in the right format and you have RStudio to execute the data processing code. I think it’s clear what I'm getting at - the end user may not always be installed on the RStudio computer. What if you want to show the user the beauty of your graphs, but do not want to lose the functionality of R? But what if you want to add interactivity for a user, and not stuff it with a set of static reports? In this case, you have a direct road to the development of software products on R. The developers have thought about this point - Rstudio provides high-quality functionality for creating and deploying web applications written in R.
To solve the problem of creating web applications on R, the Shiny application creation framework is used. The final course of the specialty "Science and Data" provides basic knowledge and skills of programming and deploying applications to the shiny R. The diploma project, although it covers to some extent all the skills and knowledge that students have received during the course of studying the "Data Science" courses , more focused on the same creation of the application.
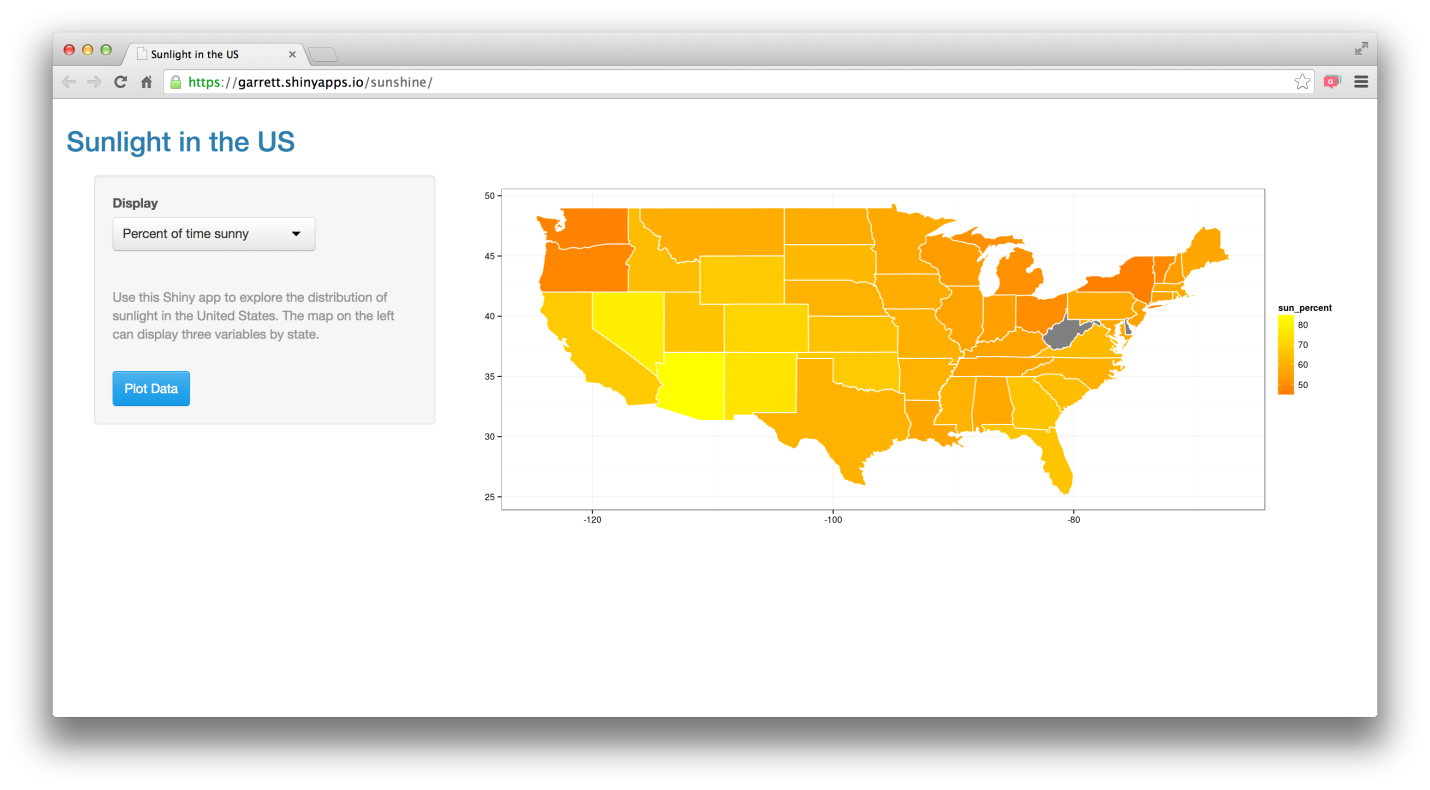
As part of the courses on creating web applications on Shiny R, it is proposed to try yourself in the role of a developer of analytical products. In my opinion, a significant advantage of the 9th course was the possibility of an arbitrary choice of the topic of the application. If your work involves intensive processing of large amounts of data, then it makes sense to try to process them with R (naturally, taking into account the requirements of confidentiality). The main result of the development of a web application on R becomes two files: “ui.R”, which contains the description of the program interface, and “server.R”, which contains the description of the data processing algorithm by the application. The written application can be easily published on the Internet using this site - you just need to register and link it with your RStudio according to the instructions on the site. It should be remembered that the free access to your application for users of shinyapps.io is limited: for free, your application can only be in online status for a limited time - 25 hours. Of course, the corresponding shiny server software can be downloaded and deployed on your server, and then you can freely develop and deploy new applications on the shiny R for free and without time limits. This is more difficult, but it is also a valid option. One way or another, shinyapps.io is enough for the course assignments. Below are screenshots of a pair of publicly available web applications on shiny R (not written by me).

Development on shiny R in my opinion has several non-critical flaws:
- the need to get used to the format of writing code in the ui.R and server.R files;
- few opportunities to configure the interface directly from ui.R;
- low processing speed of large data arrays (due to the high level of abstraction R).
One way or another, you can put up with these shortcomings - you can prepare quite a good web-application on R to demonstrate analytics capabilities or a collective use tool for a team of analysts in a startup or a small company (if existing tools are not satisfied with functionality or are too expensive).
In the framework of the graduation project of the specialization “Data Science” it is proposed to hoard over a web application that predicts the next word that the user wants to enter. Such functionality is useful for mobile phones, although, as practice shows, the predictive power of most such applications is not very high. This application is based on machine learning algorithms and large data sets from Twitter, blogs, and news posts. The task is to create an application on the basis of the available data sets that would predict the next word based on the words already entered by the user. And although solving this problem requires a deep immersion in the topic of automatic analysis of unstructured texts, R provides in the package tm sufficient tools for constructing the simplest algorithms for predicting the next word.
To create a final word prediction application, one has to go through all the studied phases of data analysis: collecting and preprocessing data from blogs, twitter and news; exploratory data analysis (to determine the actual amount of data needed to predict a word); documenting the features of the data sets and the results of their processing; building mathematical models for predicting a new word and developing a machine learning algorithm to predict the next word; development and publication of a web application that can predict the next word based on the set of words entered. The simplest version of such a web application is shown in the figure - just the very application that was written as part of a graduate project in DSS. The application tells us a somewhat absurd answer: “It's interesting to be late” (although tired office workers or students will surely find the logic in this statement ;-))

Of course, I do not set myself the goal of describing all the vicissitudes and subtleties of the graduation project of the “Data Science” specialization, but we can confidently say that it gives a complete understanding of the sequence of applying acquired skills and knowledge in the process of developing real analytical products. From this point of view, the thesis project is simply flawless, although the choice of such a difficult topic as automatic text analysis is traditional and causes criticism from those who take courses in the “Data Science” specialization.
Wrap-up
In general, the Science of Data specialization provides an overview of how to correctly conduct data analysis. It is clear that it is better to have narrow specialists in the company staff to perform individual steps, but, nevertheless, effective and relevant to the needs of the company data analysis will be possible only when the company has a specialist who can build the entire data analysis process, from beginning to end. the end. At the same time, the ability to not only “poking around in the data” is important, but also to provide the result to the client in an accessible and understandable form.
The result of data analysis should help the client to solve his pressing questions - ideally: how to make a business more profitable? Alas, no courses can teach how to answer this question in any situation and with any data. The specialty “Data Science” is the first step on the way to becoming a data analyst; further movement along this winding route is impossible without practical experience. Well, since the labor market in data analytics is still far from saturation, go ahead - challenges and new career horizons are waiting!
Instead of the conclusion - some more useful courses Coursera
The course “Working with Massive Data” : about Big Data in accessible language with the inimitable computer technology guru Jeff Ullman.
Course "Computer Training" : for those who turned out to be a little machine learning in DSS.
Course "Analysis of textual information" : for those who want to predict more than one word at a time ;-)
Read in the first part of this post : About the specialty Data Science in general. Courses: Data Analysis Tools (R Programming); Preliminary data processing; Documenting data processing.
Source: https://habr.com/ru/post/268893/
All Articles