Making an electronic consultant from the Post Hawk chat
Recently a new version of api Post Hawk and a chat based on it has been released. Today I want to show how to transform this chat into an electronic consultant with a simple control panel in the minimum amount of time.
So let's get started.
For the most impatient repository with the fact that it turns out at the end and the ability to "touch with your hands" - the client , the administration panel . After cloning, you need to initialize the submodules:git clone https://bitbucket.org/Slavenin/hawk_advisor git submodule init && git submodule update
')
Our consultant will consist of two parts client and administrative.
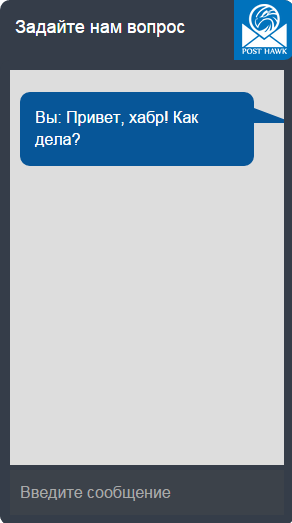
Client part
The client side code is located in two files: index.php and js / client.js . The first is not of great interest, it is connected scripts and setting the basic properties. The example uses the global CHAT_CONTROL object to store the properties of the current user. You can choose any other way which you like, for example, through templating. The md5 hash of the session is used as the user id, again, you are free to use as id, whatever, as long as it satisfies the identifier parameters: / ^ [a-zA-Z \ d \ _] {3.64} $ / (in the future it is planned to get away from this restriction, but so far) Id manager (key CHAT_CONTROL.manager), who will communicate with your customers must also meet the above parameters.
Chat initialization is as follows:
code
$('#chat').hawkChat({ userId: CHAT_CONTROL.userId, //id serverSideUrl: 'Chat.php', // groupName: CHAT_CONTROL.groupName, // useTabs: false, // useUserList: false, // inline: false, // title: ' ', // inMessageFormat: '<div class="chat-row triangle-right left" title="{time}"> \ <div class=""> \ <span class="chat-row-login">{from_login}</span>: \ <span class="chat-row-message">{message}</span> \ </div> \ </div>', // outMessageFormat: '<div class="chat-row triangle-right right" title="{time}"> \ <div class=""> \ <span class="login"></span>: \ <span class="message">{message}</span> \ </div> \ </div>', // openWithUser: [CHAT_CONTROL.manager], // onInMessage: function(msg, str) { if(msg.event === 'hawk.chat_message') { var $body = $('.chat-mesasge-panel.active'); if($body.find('.mCSB_container').size()) { $body = $body.find('.mCSB_container'); } $body.append(str); } } // }); The full set of possible parameters is on the corresponding page of the documentation.
Briefly about what happens during chat initialization: we change the format of incoming and outgoing messages, hide the list of users and tabs, open a chat with the manager appointed earlier, and also listen to incoming messages so that when a message arrives for all users of the group, it is displayed. Making the chat draggable, for this we need jquery ui.
Make the animation of folding / expanding the chat:
code
var $body = $('.chat-body', '#chat'); $('.chat-header', '#chat').dblclick(function () { var $container = $('.chat-container', '#chat'); if($body.is(":visible")) { $body.hide(); $container.stop().animate({ height: '0px' }, 1000); } else { var to = '+=0px'; $container.stop().animate({ height: '465px', top: to }, 1000, 'linear', function () { $body.show(); // var offset = $container.offset(); if(offset.top < 0) { $container.stop().animate({ top: '+=' + offset.top|0 + 'px' }) } $container.find('.chat-text-input').focus(); }); } }); We inform about ourselves by calling the function sendPage () and put its call in the interval for every 15 seconds.
That's all with the client part.
The administrative part.
For a start, let's decide on the minimum set of functionality that the administrative part should have:
- Send a message to any user
- Send message to all users
- Show statistics for current online users
To implement the first two points, we will use the chat plugin, for the third - highcharts and Yandex.Maps.
The administrative part is located in the admin.php and js / admin.js files . As in the case of the client part, the admin.php file does not contain any interesting details, all the same object for user data and some html markup for graphics. It is clear that in such a way as it is now - open - you cannot leave it, but since each site uses its own authorization system, I did not add any code to check it.
Go to the js script. The STAT object is used to store statistics data.
code
$('#chat').hawkChat({ userId: CHAT_CONTROL.userId, //id serverSideUrl: 'Chat.php', // groupName: CHAT_CONTROL.groupName, // onInMessage: function(msg, str) { if(msg.event === 'hawk.ping') { return false; } msg.text.from_login = msg.text.from_login.substr(0, 10); return -1; }// }); Here is the standard chat initialization. We make a handler for incoming messages in order not to miss data from the admin panel and shorten the user login. -1 is a signal to chat to recompile messages based on changed data. Since the ping messages are sent to all users of the group, we ignore them. In this part, the code can be changed by creating two different groups - one for users, the other for administrators and sending messages from one to another.
Next, we initialize the charts and subscribe to ping events and update the list of users. A new list is requested by chat every 30 seconds.
code
// initialize the graphics
initGraphs(); // HAWK_API.bind_handler('ping', onUserPing); // HAWK_API.bind_handler('get_by_group', onUserList); When a user receives a ping, we update information about him in our facility. You can redraw graphics at this point, but in case of a large number of users, there may be problems with browser performance, so we will update the data when we receive a new list of them.
code
function onUserPing(e, msg) { // var info = msg.text.info; STAT.userInfo[msg.from] = info; // if(!STAT.pageToUser.hasOwnProperty(info.page)) { STAT.pageToUser[info.page] = []; } // if($.inArray(msg.from, STAT.pageToUser[info.page]) === -1) { STAT.pageToUser[info.page].push(msg.from); } } function onUserList(e, msg) { var onlineUsers = []; msg.result.forEach(function (record) { for(var gname in record) { record[gname].users.forEach(function (user) { if (user.online) { if($.inArray(user.user, onlineUsers) === -1) { onlineUsers.push(user.user); } } else if (!user.online) { if (STAT.userInfo.hasOwnProperty(user.user)) { delete STAT.userInfo[user.user]; } // HAWK_API.remove_user_from_group([gname], user.user); } }); } }); var pages = STAT.pageToUser; // for(var page in pages) { // pages[page] = pages[page].filter(function (pUser) { // , if($.inArray(pUser, onlineUsers) === -1 || STAT.userInfo[pUser].page !== page) return false; return true; }); // if(!pages[page].length) { delete pages[page]; } } $('#user_count').html(onlineUsers.length); // updatePageGraph(); updateBrowserGraph(); updateMap(); } Further, the functions for updating data on graphs (they do not represent any particular interest, therefore I will not consider them in detail):
code
function updatePageGraph() { // if(STAT.graphPageUpdating) { return; } STAT.graphPageUpdating = true; // var series = []; var pages = STAT.pageToUser; for(var page in pages) { series.push([page, pages[page].length]); } // var chart = STAT.pageGraph.highcharts(); chart.series[0].setData(series); chart.redraw(); STAT.graphPageUpdating = false; } function updateBrowserGraph() { // if(STAT.graphBrowserUpdating) { return; } STAT.graphBrowserUpdating = true; var browsers = {}; var users = STAT.userInfo; // for(var user in users) { var browser = users[user].browser; if(!browser) { continue; } // browser = browser.name.toString().substr(0, 10) + ' ' + ((browser.version) ? ' (' + browser.version + ')' : '( )'); // if(!browsers.hasOwnProperty(browser)) { browsers[browser] = 0; } browsers[browser]++; } // var series = []; for(var browser in browsers) { series.push([browser, browsers[browser]]); } // var chart = STAT.browserGraph.highcharts(); chart.series[0].setData(series); chart.redraw(); STAT.graphBrowserUpdating = false; } function updateMap() { if(!STAT.objectManager) { return; } // STAT.objectManager.removeAll(); var users = STAT.userInfo; // var points = []; for(var user in users) { if(users[user].coords && users[user].coords.length) { points.push({ type: "Feature", id: user, geometry: { type: "Point", coordinates: users[user].coords }, properties: { draggable: false } }); } } // STAT.objectManager.add(points) } And the functions of the initialization of graphs and maps:
code
function initGraphs() { // STAT.pageGraph = $('#chart').highcharts({ chart: { type: 'column' }, title: { text: ' ' }, xAxis: { type: 'category' }, yAxis: { title: { text: ' ' } }, legend: { enabled: false }, plotOptions: { series: { borderWidth: 0, dataLabels: { enabled: true, format: '{point.y}' } } }, tooltip: { headerFormat: '<span style="font-size:11px">{series.name}</span><br>', pointFormat: '<span style="color:{point.color}">{point.name}</span>: <b>{point.y}</b><br/>' }, series: [{ name: "", colorByPoint: true, data: [] }] }); // STAT.browserGraph = $('#browsers').highcharts({ chart: { type: 'pie' }, title: { text: '' }, tooltip: { pointFormat: '{series.name} <b>{point.percentage:.1f}%</b>' }, plotOptions: { pie: { allowPointSelect: true, cursor: 'pointer', dataLabels: { enabled: true, format: '<b>{point.name}</b> {point.percentage:.1f} %', style: { color: (Highcharts.theme && Highcharts.theme.contrastTextColor) || 'black' } } } }, series: [{ name: "", colorByPoint: true, data: [] }] }); } // ymaps.ready(initMap); function initMap () { // var myMap = new ymaps.Map("map", { center: [55.76, 37.64], zoom: 2, controls: ['zoomControl', 'searchControl', 'typeSelector'] }, { searchControlProvider: 'yandex#search' }); // STAT.objectManager = new ymaps.ObjectManager({ // , . clusterize: true, // ObjectManager , . gridSize: 32 }); myMap.geoObjects.add(STAT.objectManager); } That's all with the administrative part.
For styling scrolls, the jquery-custom-content-scroller plugin is optional. If your portal uses its own styling for scrolls, you can override the corresponding function.
The disadvantage of this system is the inability to view statistics on all users immediately after the page loads. However, this problem can be solved in several ways, either by storing statistics in something more reliable than the javascript object, or you can implement the functionality of polling all users from the list in order to get data from them on the current state.
That's all I wanted to tell. Thank you for attention.
Source: https://habr.com/ru/post/268673/
All Articles