My first map on Leaflet.js
How I made my first map on Leaflet.js.
I do not understand anything in cartography and geo-information services, so this article will be more likely an introductory one and to help beginners, since I think there is not much information in Russian on the Internet, and I came to some sort by chance.
So the task was the following: there is a black and white tablet (a small piece of a city map) with a size of 5913x7863 pixels in the format .bmp + .shp layers.
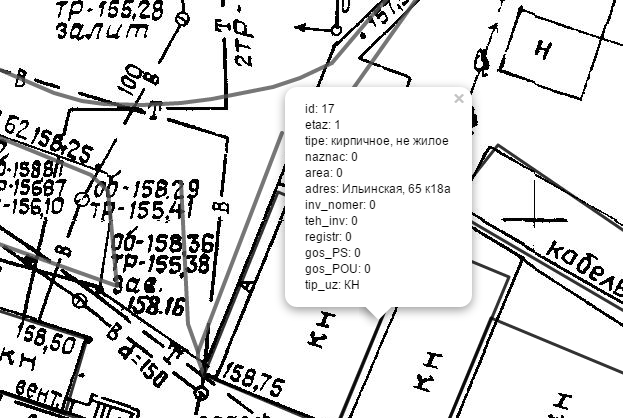
From all this you need to make an online map, the main functionality of which is to display attributes when you click on a layer and enable / disable these layers.
')
The choice fell on leaflet.js , since it is an open source shell, OSM and my favorite 2GIS are made on it. In addition, it works well on mobile devices.
We start with the fact that you need to cut the card into tiles (squares 256x256 px) so that the card loads quickly. Since I understood little of this, I didn’t dig into gdal2tiles.py , and its map shell maptiler costs money, I just downloaded a simple program called LeafletPano . It simply cuts any image into tiles; it is enough to set the minimum and maximum approximation level (variable z).
When we are all cut and uploaded to the hosting, and you can connect:
After cutting, you need to tie the tiles (squares 256x256 px) to the coordinates. And here the most interesting begins: the fact is that the coordinate system of these maps is a conditional local plan of the scheme , that is, it is a flat local urban coordinate system, which essentially has nothing to do with latitude and longitude.
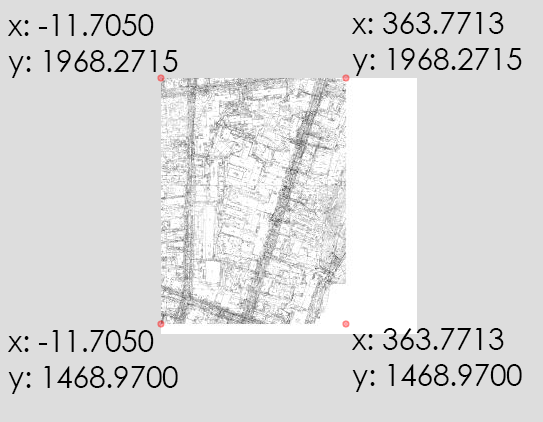
So, what was to be done: a map of 5913x7863 pixels in size should have been located in such coordinates:
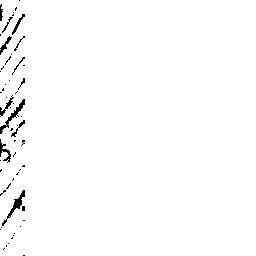
What is the difficulty? In that, as I already said, tiles are 256x256px squares, and the number of pixels in height is 7863 by 256 without the remainder being divisible, 73 pixels are not enough. Accordingly, the LeafletPano program (like any other tile cutter) complements the last squares in white, so that their size is 256x256, and not 256x183.
It looks like this:
Similarly, the width - 5913 is also not divisible by 256 and lacks 231px.
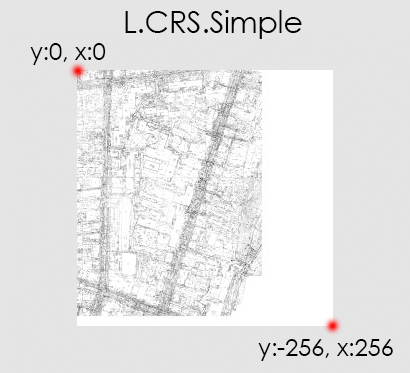
And since we are talking about a flat coordinate system, then going into the documentation, we see a ready-built L.CRS.Simple system built into Leaflet (it is designed for flat images, without reference to coordinates). How does she work? L.CRS.Simple sets the width and height to 256 and -256, respectively.
Based on L.CRS.Simple, we will create our coordinate system using transformation = new L.Transformation (a, b, c, d). The formula in the documentation is very simple: (x, y) are transformed into (a * x + b, c * y + d), all in all 4 numbers. Next a bit of math:
We calculate the height in the coordinates we need:
We divide it by the height in pixels:
Multiply by 73 missing pixels:
We add the height of the map in coordinates to the height of the missing pixels in coordinates (I hope I wrote it clearly):
Now we divide the height in the previous coordinate system (L.CRS.Simple) by the height we need:
And subtract from the unit this ratio:
Hooray! We got a and -c from the formula (a * x + b, c * y + d) , it remains to get b and d
X coordinate (for some reason, without minus) multiplied by the coefficient:
and the Y coordinate is multiplied by the coefficient
Create a new coordinate system:
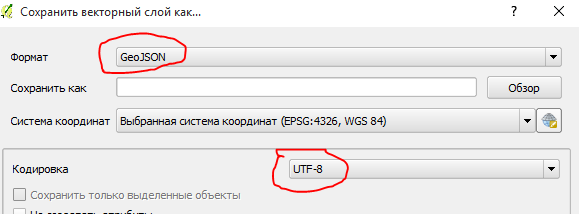
Now we connect .shp. The main essence of these interactive maps in the output of attribute information when you click on the map. When you connect .shp it is, but Russian inscriptions are displayed krakozybrami. The attribute information is stored in the .dbf file and the case is clearly in its encoding, but whatever you do with it does not help (I tried a lot of ways to change the encoding of .dbf), so the only way out is to translate .shp into more native Leaflet .geojson format with utf-8 encoding specified. This can be done using the QGIS program.
Next, we connect a plugin for Leaflet, which facilitates the recording form of the connection .geojson layers called leaflet-ajax
We connect .geojson layers:
Well, at the end we make the display of layers on / off, for this we insert L.control.layers:
Total:
PS What in the future: I want the cards to look adequate, like on OSM, and not just buildings marked with lines. Also, I'm not sure that I am doing the most appropriate way, probably there are ways with GeoServer or something like this, where you don’t have to do so much manually. Most likely you need to dig in the direction of the device cards on the OSM, because now my cards look terrible.
Any hints and comments are welcome.
I do not understand anything in cartography and geo-information services, so this article will be more likely an introductory one and to help beginners, since I think there is not much information in Russian on the Internet, and I came to some sort by chance.
So the task was the following: there is a black and white tablet (a small piece of a city map) with a size of 5913x7863 pixels in the format .bmp + .shp layers.
(the maps were originally drawn in the .dwg format (auto-cad format), but this is a closed format and you can’t do anything with it, so the guys had to save each layer separately in .shp + attribute data in .dbf)
From all this you need to make an online map, the main functionality of which is to display attributes when you click on a layer and enable / disable these layers.
')
The choice fell on leaflet.js , since it is an open source shell, OSM and my favorite 2GIS are made on it. In addition, it works well on mobile devices.
We start with the fact that you need to cut the card into tiles (squares 256x256 px) so that the card loads quickly. Since I understood little of this, I didn’t dig into gdal2tiles.py , and its map shell maptiler costs money, I just downloaded a simple program called LeafletPano . It simply cuts any image into tiles; it is enough to set the minimum and maximum approximation level (variable z).
Screenshot LeafletPano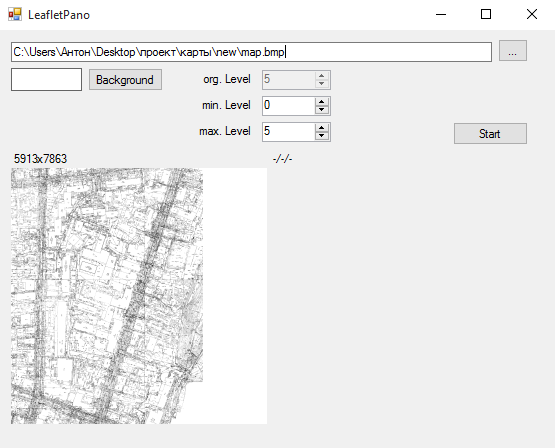
When we are all cut and uploaded to the hosting, and you can connect:
Script code
map = L.map('map', { // crs: L.CRS.Wall, // ( ) maxZoom: 5, // zoom () minZoom: 0 // zoom () }).setView([1700,170], 0); // var osn = L.tileLayer('./images/map/{z}-{x}-{y}.jpg', { // attribution: '-', // ( ) continuousWorld: true, // , , true (- ) noWrap: true // }).addTo(map); After cutting, you need to tie the tiles (squares 256x256 px) to the coordinates. And here the most interesting begins: the fact is that the coordinate system of these maps is a conditional local plan of the scheme , that is, it is a flat local urban coordinate system, which essentially has nothing to do with latitude and longitude.
So, what was to be done: a map of 5913x7863 pixels in size should have been located in such coordinates:
What is the difficulty? In that, as I already said, tiles are 256x256px squares, and the number of pixels in height is 7863 by 256 without the remainder being divisible, 73 pixels are not enough. Accordingly, the LeafletPano program (like any other tile cutter) complements the last squares in white, so that their size is 256x256, and not 256x183.
It looks like this:
Similarly, the width - 5913 is also not divisible by 256 and lacks 231px.
And since we are talking about a flat coordinate system, then going into the documentation, we see a ready-built L.CRS.Simple system built into Leaflet (it is designed for flat images, without reference to coordinates). How does she work? L.CRS.Simple sets the width and height to 256 and -256, respectively.
Based on L.CRS.Simple, we will create our coordinate system using transformation = new L.Transformation (a, b, c, d). The formula in the documentation is very simple: (x, y) are transformed into (a * x + b, c * y + d), all in all 4 numbers. Next a bit of math:
We calculate the height in the coordinates we need:
1968.2715 - 1468.9700 = 499,3015 (This is the height of our map in coordinates).We divide it by the height in pixels:
499,3015 / 7863 = 0,0635001271779219 Multiply by 73 missing pixels:
0,0635001271779219 * 73 = 4,6355092839883 We add the height of the map in coordinates to the height of the missing pixels in coordinates (I hope I wrote it clearly):
499,3015 + 4,6355092839883 = 503,9370092839883 (Got the height of the map + the white remainder of the tile (the same 73 pixels in the coordinates)).Now we divide the height in the previous coordinate system (L.CRS.Simple) by the height we need:
256 / 503,9370092839883 = 0,5079999985786595 And subtract from the unit this ratio:
1 - 0,5079999985786595 = 0,4920000014213405 Hooray! We got a and -c from the formula (a * x + b, c * y + d) , it remains to get b and d
X coordinate (for some reason, without minus) multiplied by the coefficient:
11.7050 * 0,4920000014213405 = 5,758860016636791 and the Y coordinate is multiplied by the coefficient
1968.2715 * 0,4920000014213405 = 968,389580797584 Create a new coordinate system:
L.CRS.Wall = L.extend({}, L.CRS.Simple, { transformation: new L.Transformation(0.4920000014213405, 5.758860016636791, -0.4920000014213405, 968.389580797584), }); Now we connect .shp. The main essence of these interactive maps in the output of attribute information when you click on the map. When you connect .shp it is, but Russian inscriptions are displayed krakozybrami. The attribute information is stored in the .dbf file and the case is clearly in its encoding, but whatever you do with it does not help (I tried a lot of ways to change the encoding of .dbf), so the only way out is to translate .shp into more native Leaflet .geojson format with utf-8 encoding specified. This can be done using the QGIS program.
Next, we connect a plugin for Leaflet, which facilitates the recording form of the connection .geojson layers called leaflet-ajax
We connect .geojson layers:
Embed code .geojson
var dorogi = new L.GeoJSON.AJAX("geoj/dorogi.geojson", {onEachFeature: function (feature, layer) { if (feature.properties) { var info = function(k){ var str = k + ": " + feature.properties[k]; return str; } layer.bindPopup(Object.keys(feature.properties).map(info).join("<br />"),{maxHeight:200}); layer.setStyle({ color: '#555', clickable: true, weight: 4, opacity: 0.8}); } }}); Well, at the end we make the display of layers on / off, for this we insert L.control.layers:
L.control.layers code
var baseMaps = {}; var overlayMaps = { "": osn, "": dorogi, "": gazoprovod, "": vodoprovod, "": zdaniz_new }; L.control.layers(baseMaps, overlayMaps).addTo(map); Total:
PS What in the future: I want the cards to look adequate, like on OSM, and not just buildings marked with lines. Also, I'm not sure that I am doing the most appropriate way, probably there are ways with GeoServer or something like this, where you don’t have to do so much manually. Most likely you need to dig in the direction of the device cards on the OSM, because now my cards look terrible.
Any hints and comments are welcome.
Source: https://habr.com/ru/post/268647/
All Articles