DevTips: Web Developer Tips (1-16)
The Google Chrome browser team is doing a great job in order for developers to live better. Chrome DevTools is an example of a great tool that greatly simplifies debugging your web application. But sometimes not all of the functionality of this system is visible at first glance, so Umar Hansa - a programmer from London - describes it on his website , and in a very convenient format: some text and a short screencast. And we, in turn, decided to make these tips more accessible to the Russian-speaking audience.
Contents :
Continued: 17-32 , 33-48 .
To debug a local site on a mobile device, open a page on it (it will be more convenient to use the Chrome to Phone extension), then enable remote debugging and redirect the local site to a mobile device via a dedicated port. After updating the page you will see how everything works even without using the command line!
If you need to see how a particular DOM element behaves in different states (
After changing the state of the node, a small orange circle indicator will appear in the DOM tree next to its opening tag. In some cases, it appears in the closing tag (if it is not too far out of sight).
')
Note trans. : In recent versions, browser developers have slightly changed the context menu of a node in the Elements panel. Now the state of the element can be selected from it directly without an intermediate “Force element state”. And the orange indicator itself became clickable and opens the same menu.
Each resource displayed in the Network panel has its own context menu containing the Copy as cURL item. When this item is selected, the command that fully emulates the selected request via the cURL utility (including the request headers) will be sent to the clipboard. Insert it into the terminal, edit as necessary and run.
Note trans. : To repeat the XHR request without using cURL, find it in the Network panel and select the Reply XHR item in its context menu.
In DevTools there is a functional called “Snippets”. With it, you can create or delete code that can then be executed in the context of a web page. It is much more convenient to retype the code in the “Console” panel. Just try:
Notice that you have full multi-line editing and confirmation of accidental closing of the snippet without saving.
The “Local modifications” feature allows you to track changes to files that were made via DevTools. After modifying and saving the file via DevTools, select “Local modifications” in the context menu of the file in the left column of the “Sources” panel and you will see a list of changes, each of which can be rolled back.
When you need to record page actions using the Timeline panel, detach the DevTools window from the main browser window and position it so that the start button is located as close as possible to the analyzed page section. Alternatively, use the “Cmd + E” hotkeys to start / stop recording behavior.
Note trans. : such an arrangement of the DevTools window will allow you to avoid the extra noise that occurs while you are moving the mouse from the record button to the desired part of the application.
To quickly find the DOM node you are interested in in the Elements panel, use the search by CSS selectors. The search is invoked by the "Cmd + F" key combination.
To copy a link to an image in the Data URI format (encoded in base64), find the desired image in the Resources panel and select Copy Image as Data URL from its context menu (in the right pane).
Note trans. : this can be useful if you, for example, do not want to send a request for a picture to the server, but use its base64 copy from CSS.
Go directly to the desired place in the file opened via the “Cmd + O” command in the “Sources” panel, indicating the desired position in the format
The “Sources” panel remembers the places of all script changes and allows you to cycle between them using “Alt -” (back) and “Alt +” (forward).
In addition to copying the request headers for the network resource or the response headers for it, you can copy the entire answer.
You can use several cursors at the same time for parallel editing different sections of code in the “Sources” panel. To do this, holding "Cmd", click on the places where you want to put the cursors. You can cancel the selection with the help of "Cmd + U".
You can use block selection in the “Sources” panel by holding “Alt” while moving the mouse.
You can log all object events using the
To use the DOM node selected in the Element panel in the DevTools console, simply type
Note trans. : The Sources panel remembers the last 5 selected items, which are accessed via
A search in the Network panel allows you to filter active (still not received a response) requests using the
Note trans. : Today Chrome Canary 48 supports the following filters:
Wait for the following parts!
Contents :
- Port forwarding allows you to open local links on a mobile device.
- Activating pseudo-classes of a DOM element
- Repeat network request with cURL
- Running saved code blocks (snippets) on any web page
- Tracking file changes through DevTools
- Simple entry page action
- Finding elements of a DOM tree using CSS selectors
- Copy Image in Data URI format
- Go to the desired line when opening a file
- Simplified navigation between edits
- Copy response to network request
- Working with multiple cursors when editing scripts
- Block selection
- Fast event monitoring in the console
- Access to the selected DOM node in the console
- Tracking pending network requests using the is: running filter
Continued: 17-32 , 33-48 .
1. Port forwarding allows you to open local links on a mobile device.
To debug a local site on a mobile device, open a page on it (it will be more convenient to use the Chrome to Phone extension), then enable remote debugging and redirect the local site to a mobile device via a dedicated port. After updating the page you will see how everything works even without using the command line!
View screencast

2. Activation of pseudo-classes of a DOM element
If you need to see how a particular DOM element behaves in different states (
active , focus , hover and visited ), you can activate any of them in Chrome DevTools. To do this, right-click on the desired element in the Elements panel, and then select Force element state. There is another way: in the panel of characteristics of an element in the section “Styles”, click on the button “Toggle element state” and select a specific state.After changing the state of the node, a small orange circle indicator will appear in the DOM tree next to its opening tag. In some cases, it appears in the closing tag (if it is not too far out of sight).
')
Note trans. : In recent versions, browser developers have slightly changed the context menu of a node in the Elements panel. Now the state of the element can be selected from it directly without an intermediate “Force element state”. And the orange indicator itself became clickable and opens the same menu.
View screencast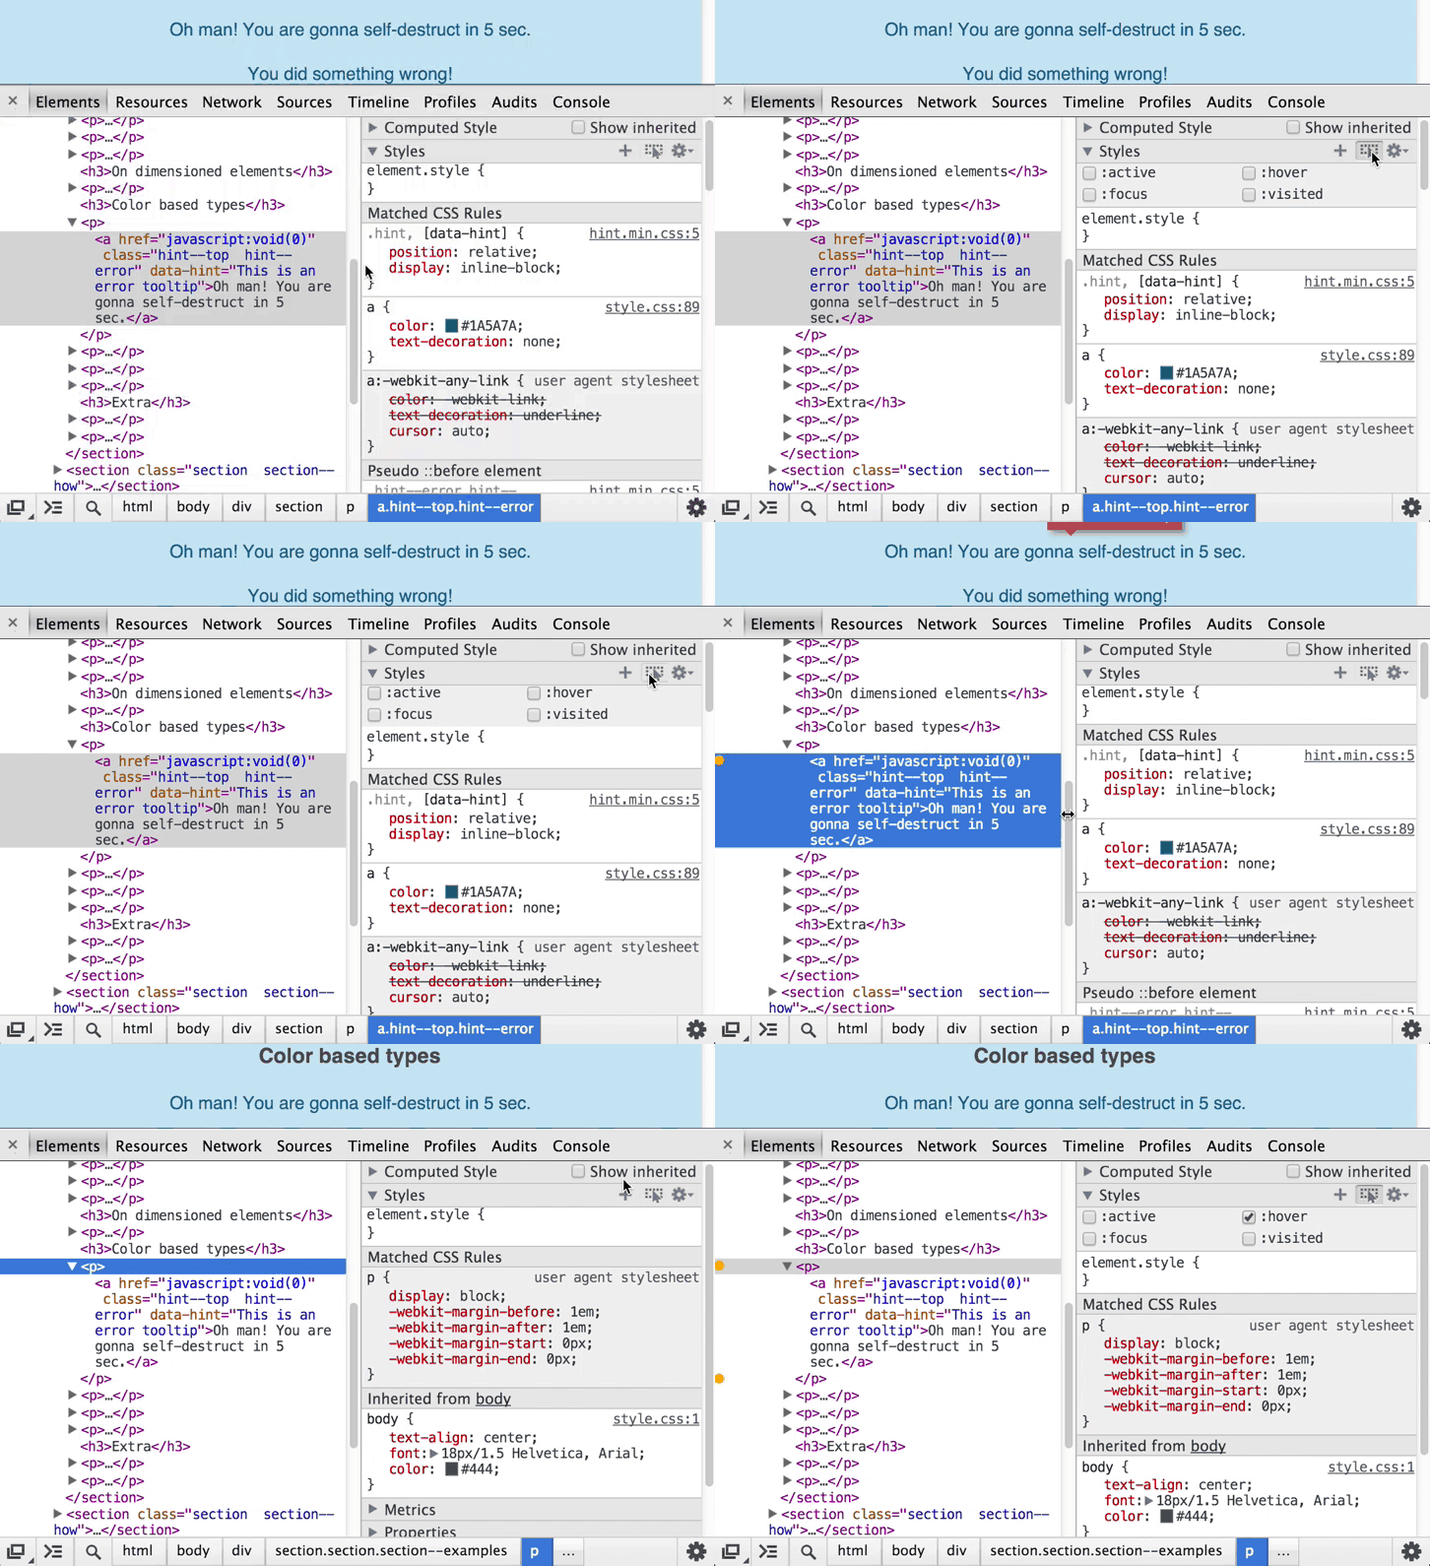

3. Repeat network request with cURL
Each resource displayed in the Network panel has its own context menu containing the Copy as cURL item. When this item is selected, the command that fully emulates the selected request via the cURL utility (including the request headers) will be sent to the clipboard. Insert it into the terminal, edit as necessary and run.
Note trans. : To repeat the XHR request without using cURL, find it in the Network panel and select the Reply XHR item in its context menu.
View screencast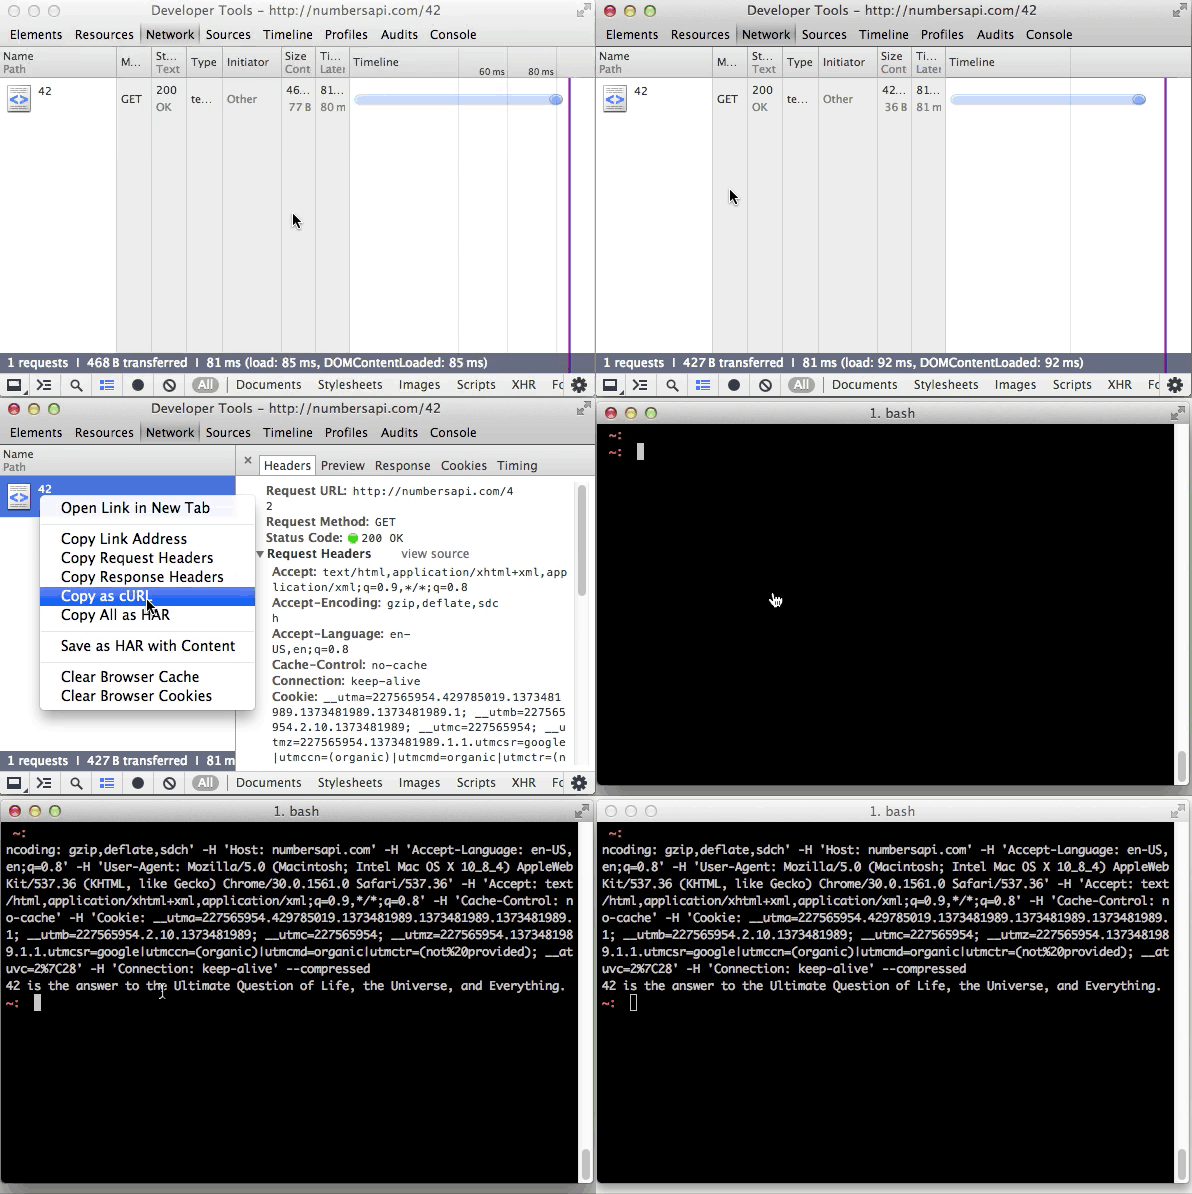

4. Run saved code blocks (snippets) on any web page
In DevTools there is a functional called “Snippets”. With it, you can create or delete code that can then be executed in the context of a web page. It is much more convenient to retype the code in the “Console” panel. Just try:
- open the panel “Source” → “Snippets” (it is in the left tab);
- in the context menu of this tab, select "New"
- enter a suitable name for your snippet;
- launch it by selecting the “Run” item in the snippet menu (or “Cmd + Enter”).
Notice that you have full multi-line editing and confirmation of accidental closing of the snippet without saving.
View screencast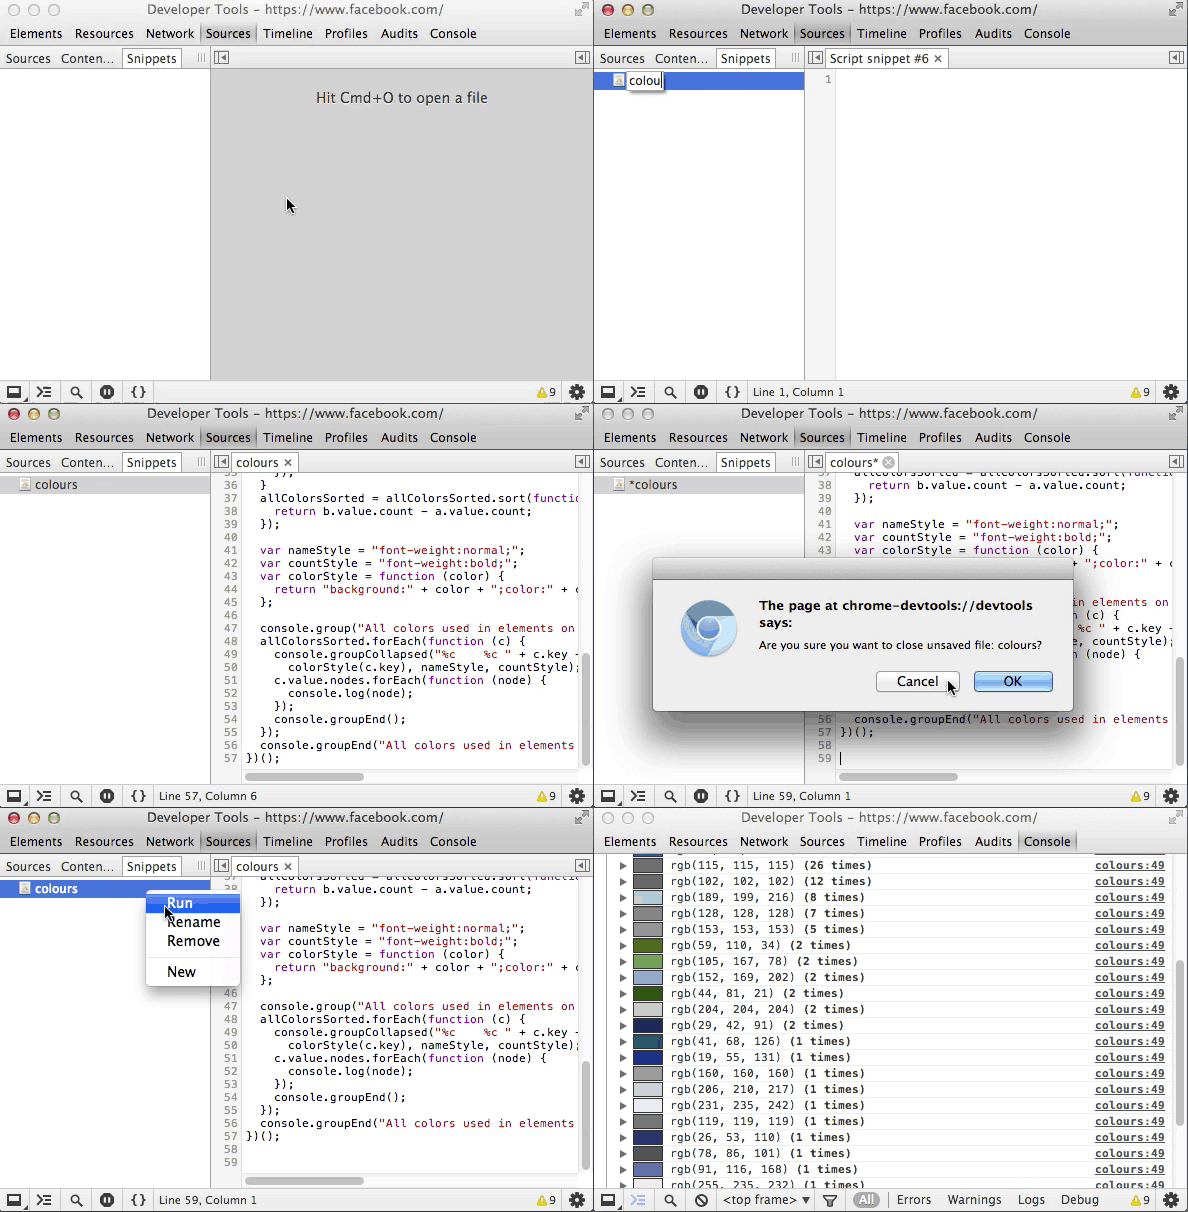

5. Tracking file changes through DevTools
The “Local modifications” feature allows you to track changes to files that were made via DevTools. After modifying and saving the file via DevTools, select “Local modifications” in the context menu of the file in the left column of the “Sources” panel and you will see a list of changes, each of which can be rolled back.
View screencast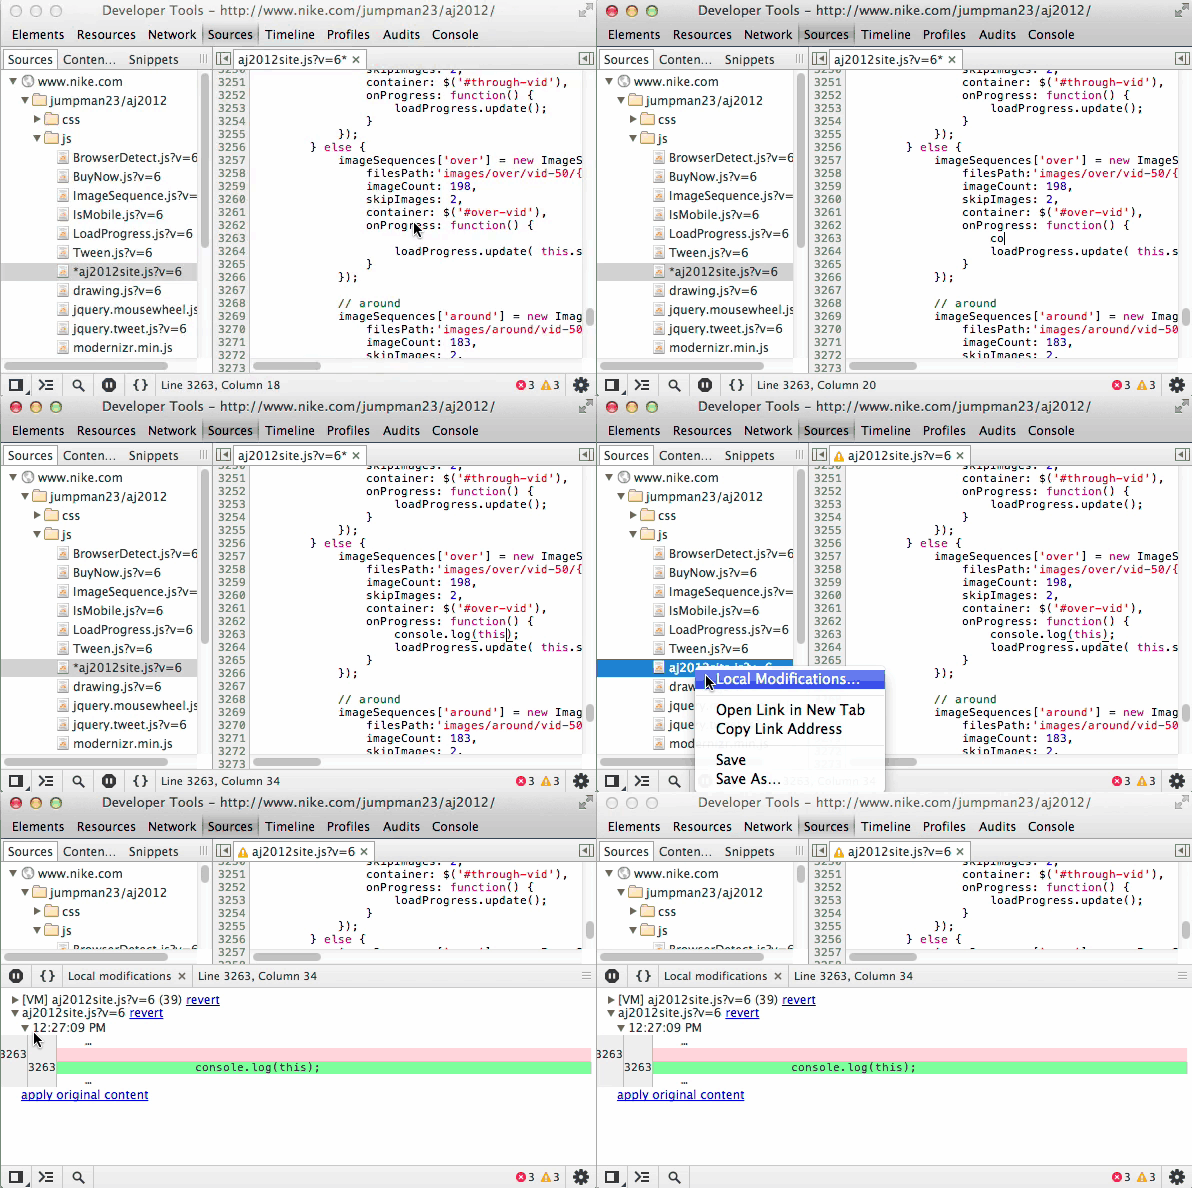

6. Simple recording of page actions
When you need to record page actions using the Timeline panel, detach the DevTools window from the main browser window and position it so that the start button is located as close as possible to the analyzed page section. Alternatively, use the “Cmd + E” hotkeys to start / stop recording behavior.
Note trans. : such an arrangement of the DevTools window will allow you to avoid the extra noise that occurs while you are moving the mouse from the record button to the desired part of the application.
View screencast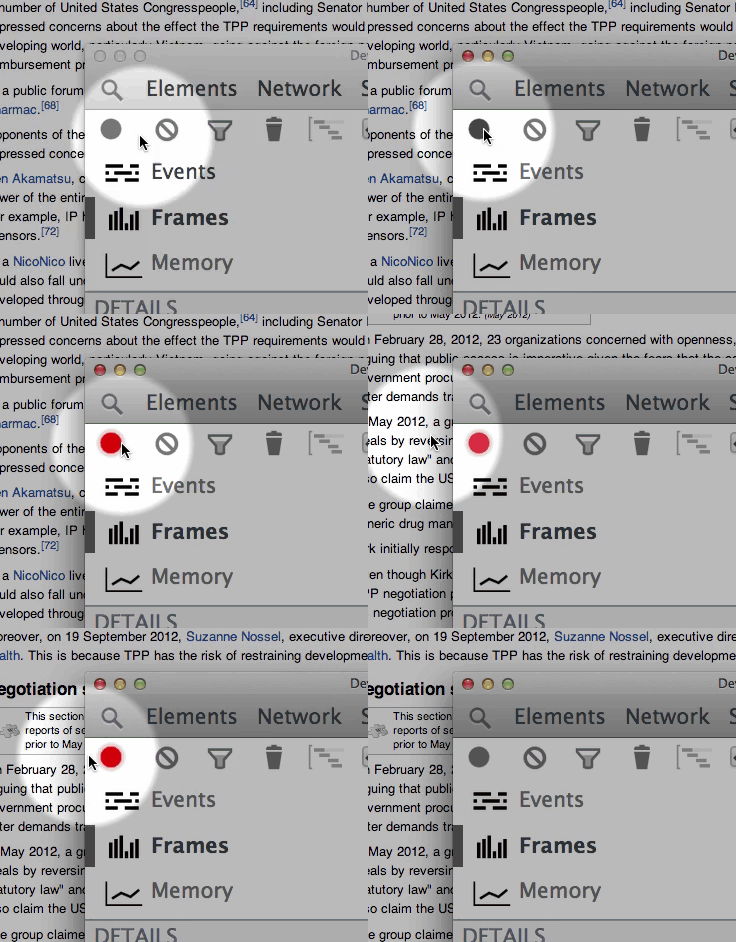

7. Search DOM tree elements using CSS selectors
To quickly find the DOM node you are interested in in the Elements panel, use the search by CSS selectors. The search is invoked by the "Cmd + F" key combination.
View screencast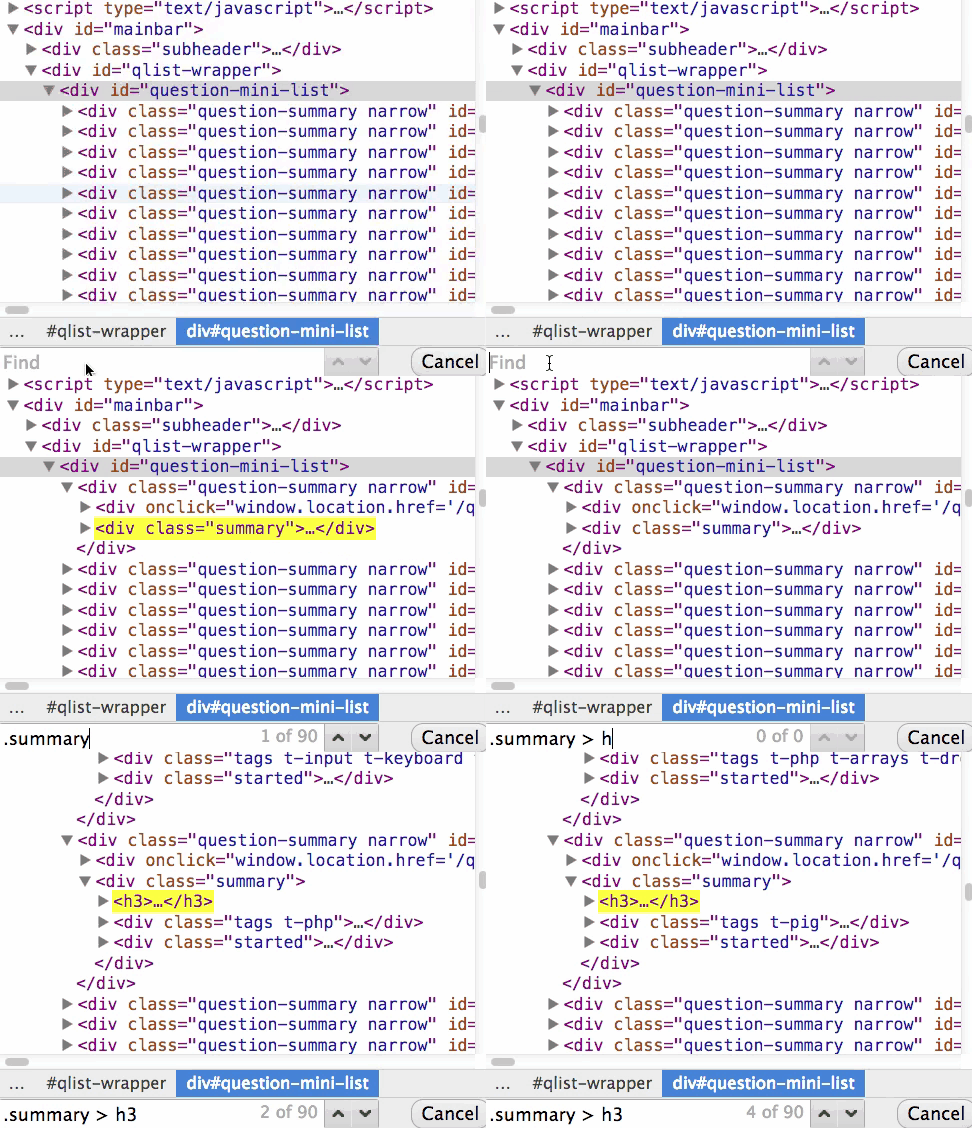

8. Copying the image in the Data URI format
To copy a link to an image in the Data URI format (encoded in base64), find the desired image in the Resources panel and select Copy Image as Data URL from its context menu (in the right pane).
Note trans. : this can be useful if you, for example, do not want to send a request for a picture to the server, but use its base64 copy from CSS.
View screencast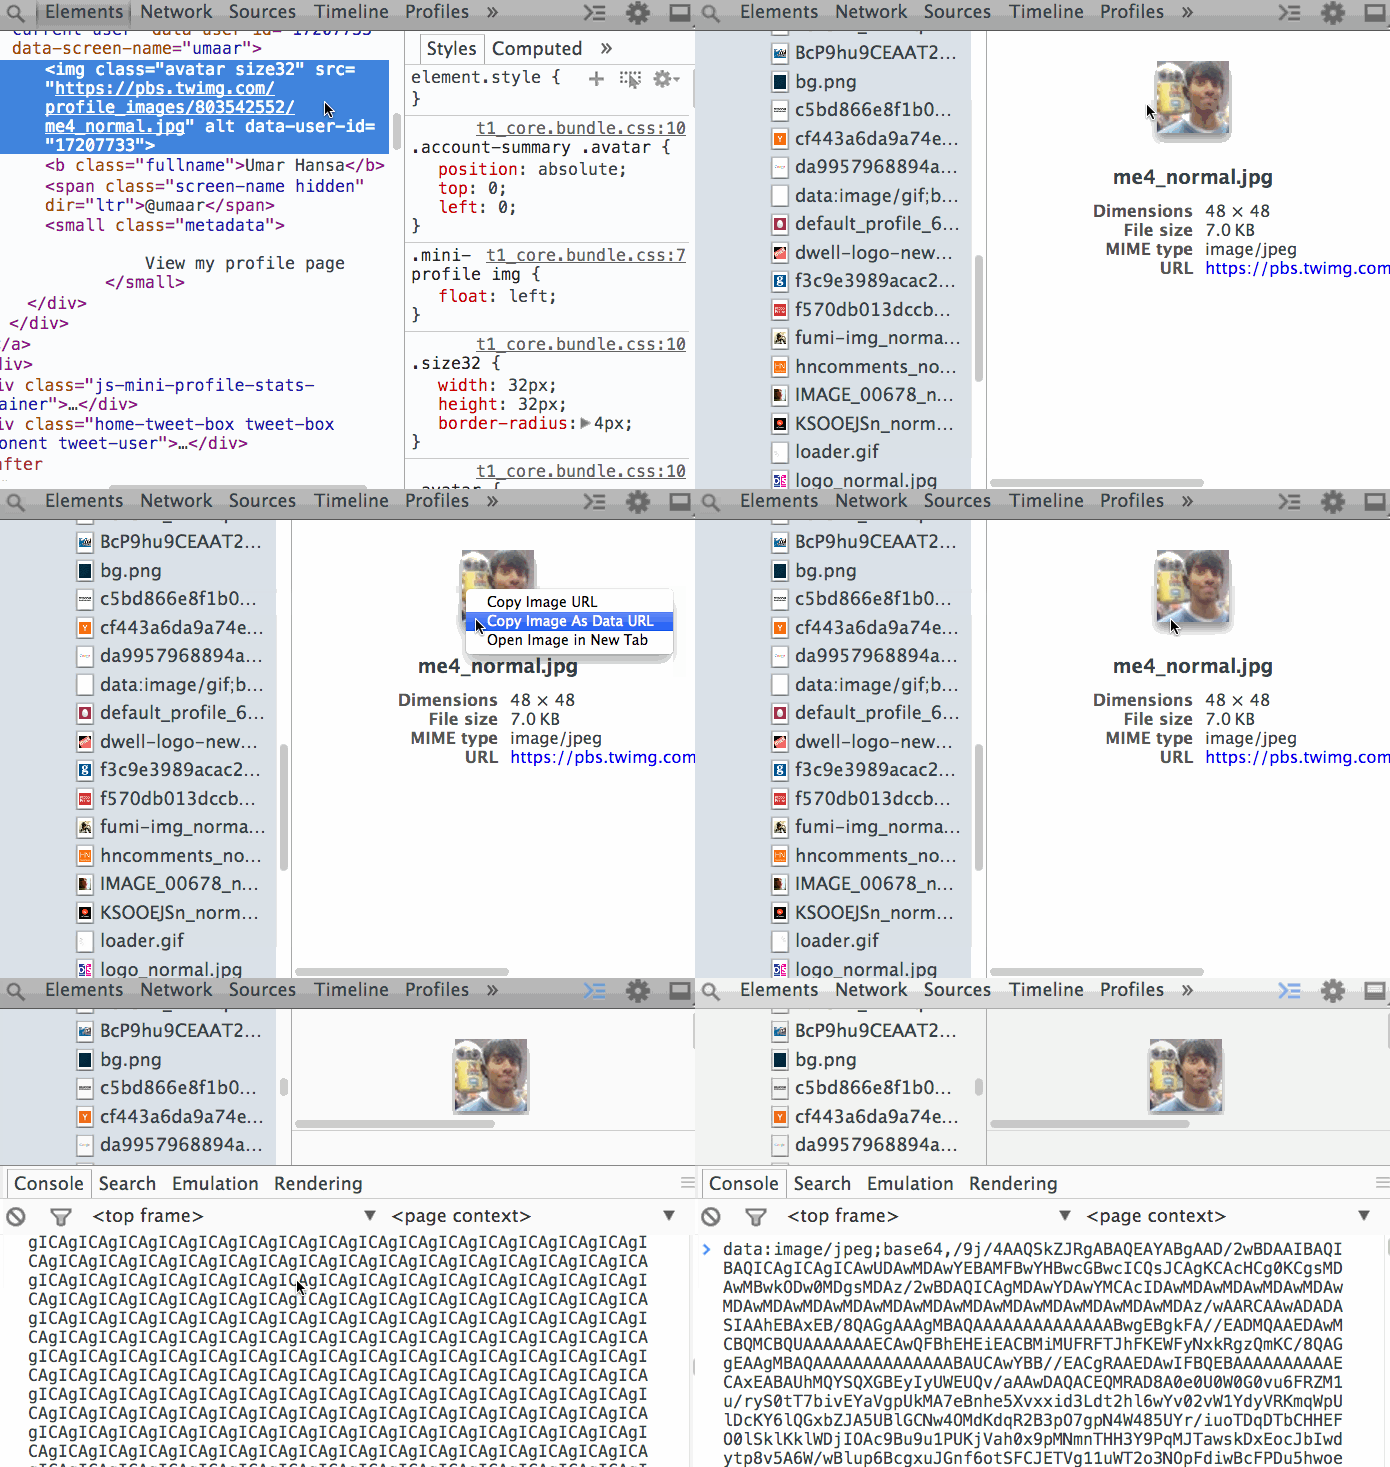

9. Go to the desired line when opening a file
Go directly to the desired place in the file opened via the “Cmd + O” command in the “Sources” panel, indicating the desired position in the format
:_:_ . Try:- Click “Cmd + O” in the open file in the “Sources” panel;
- enter ": 5: 9"
- You will be transferred to the symbol 9 of line 5.
View screencast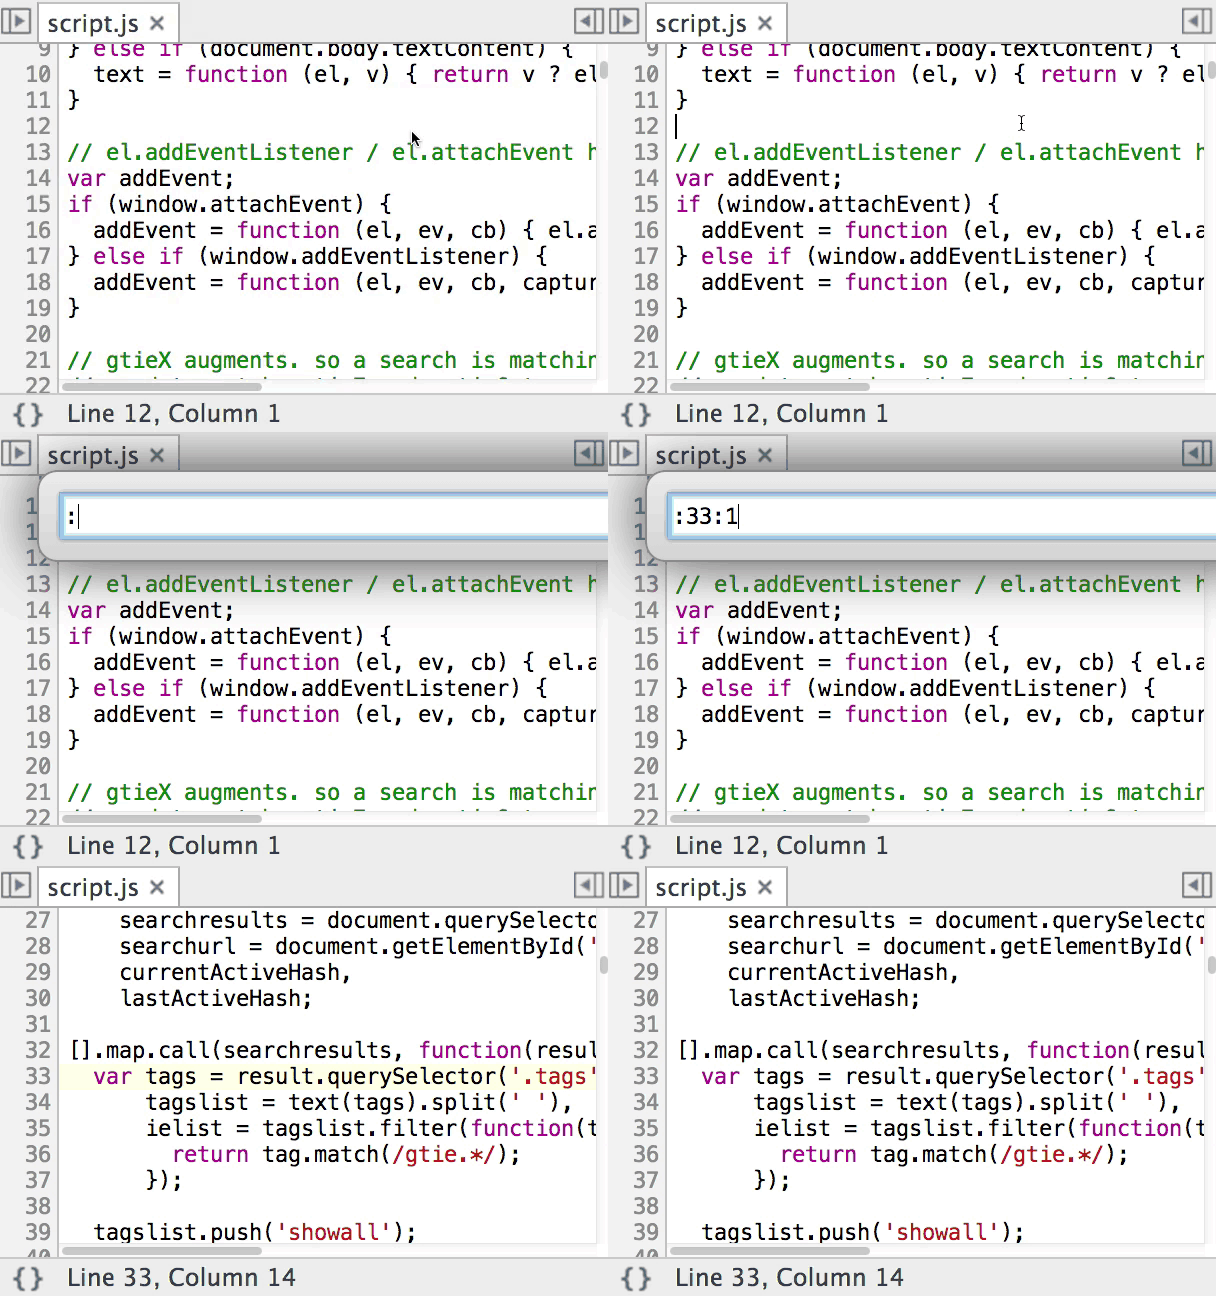

10. Simplified navigation between edits.
The “Sources” panel remembers the places of all script changes and allows you to cycle between them using “Alt -” (back) and “Alt +” (forward).
View screencast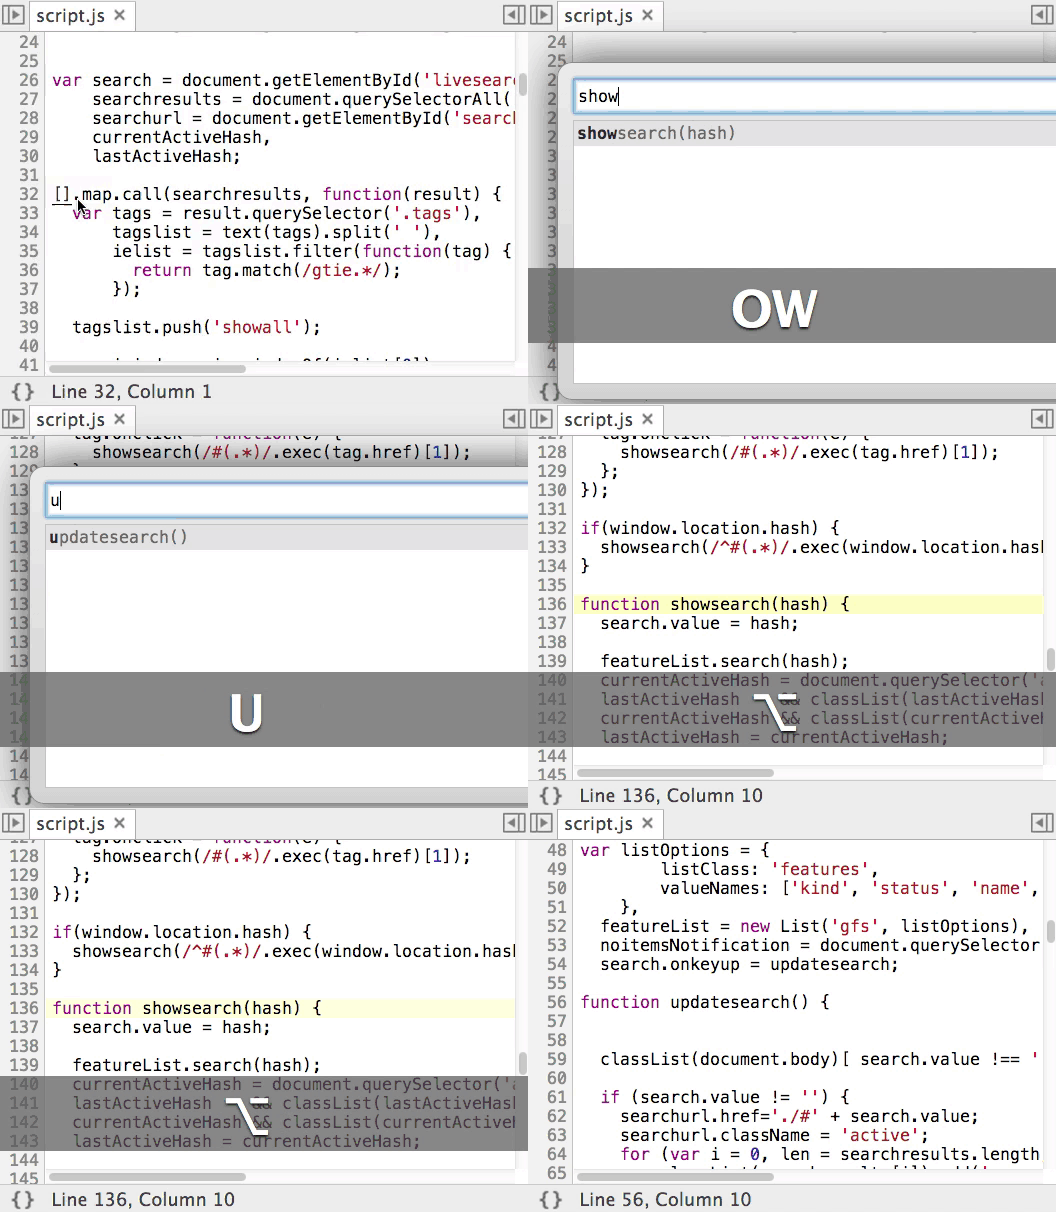

11. Copying the response to the network request
In addition to copying the request headers for the network resource or the response headers for it, you can copy the entire answer.
View screencast

12. Working with multiple cursors when editing scripts
You can use several cursors at the same time for parallel editing different sections of code in the “Sources” panel. To do this, holding "Cmd", click on the places where you want to put the cursors. You can cancel the selection with the help of "Cmd + U".
View screencast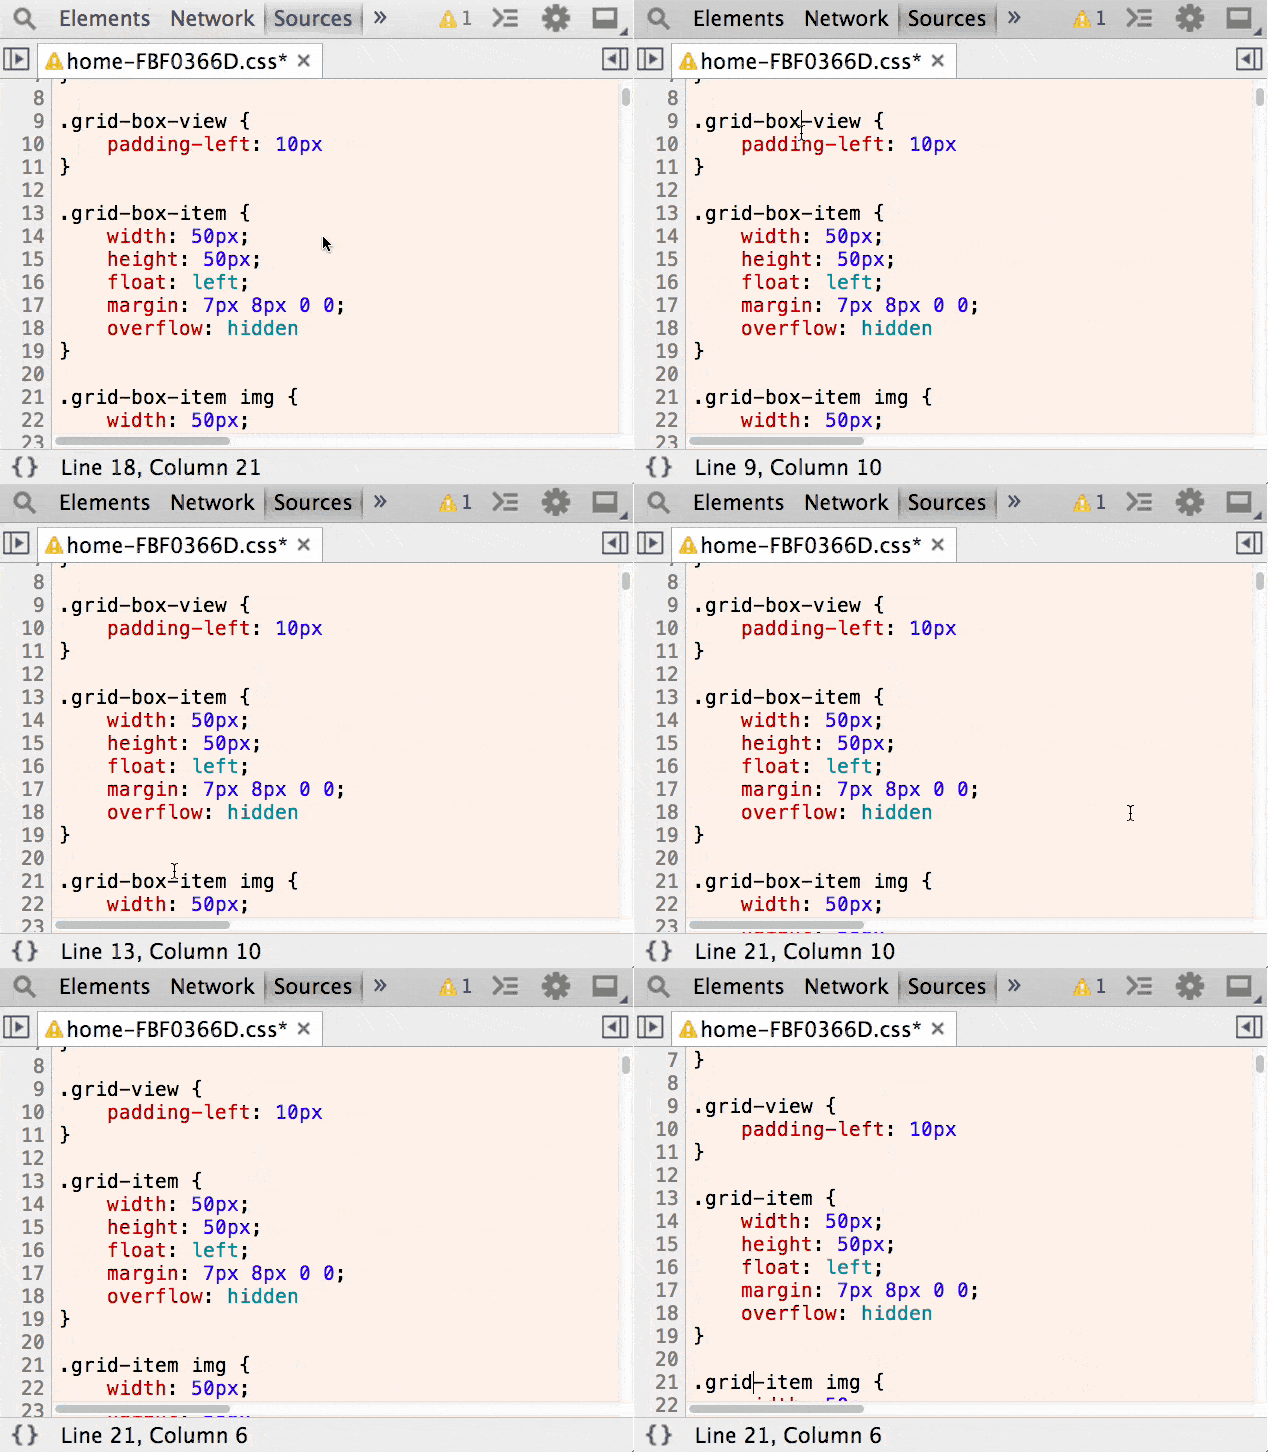

13. Block selection
You can use block selection in the “Sources” panel by holding “Alt” while moving the mouse.
View screencast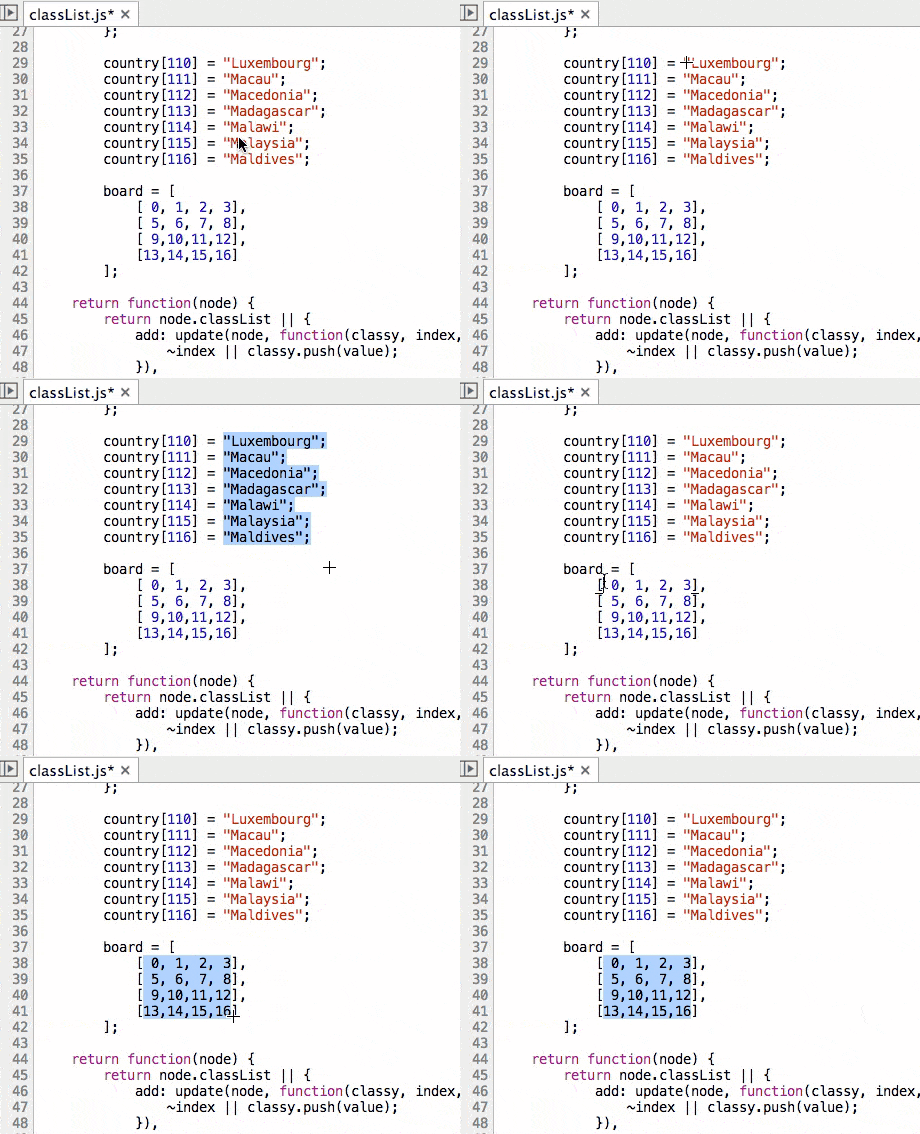

14. Fast event monitoring in the console
You can log all object events using the
monitorEvents(object [, events]) method from the Command Line API . When an event occurs, its objects will be displayed in the console. This is convenient when you cannot remember the properties of a specific event.View screencast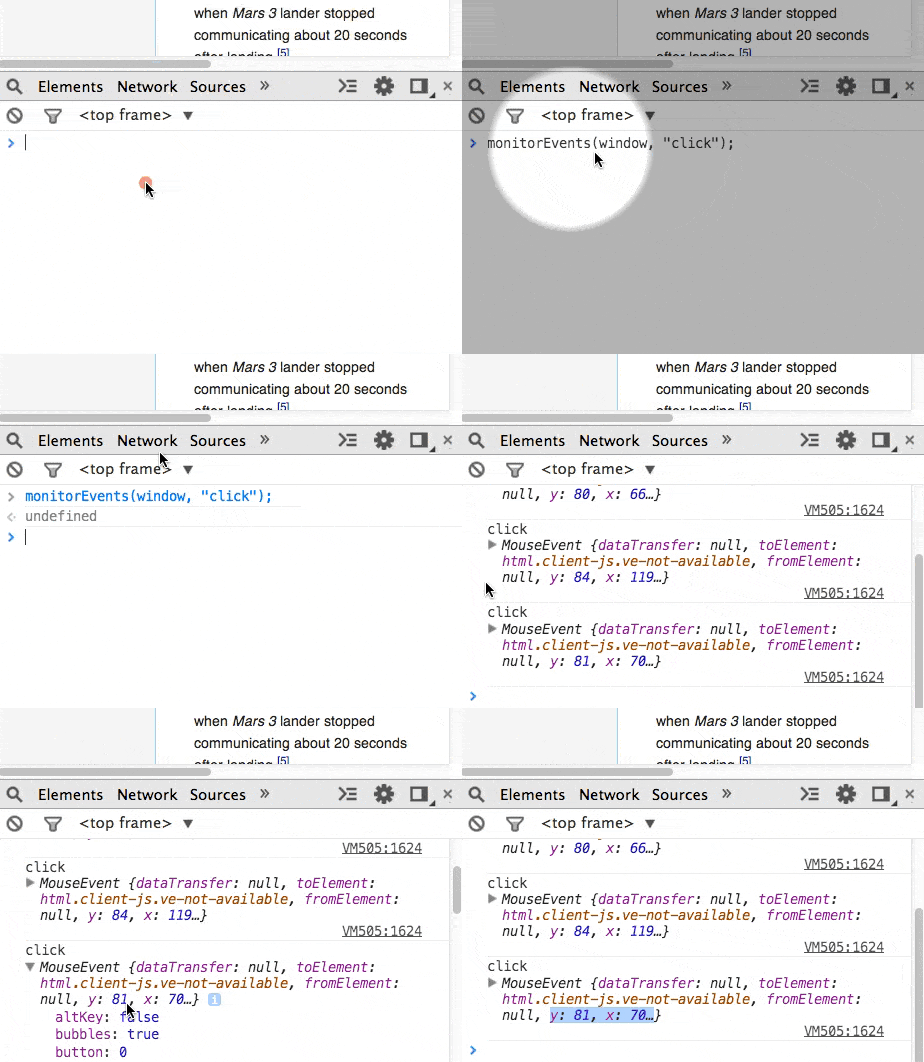

15. Access to the selected DOM node in the console
To use the DOM node selected in the Element panel in the DevTools console, simply type
$0 . You can also use the $_ construct, which will return the value of the latest expression calculated in the console.Note trans. : The Sources panel remembers the last 5 selected items, which are accessed via
$0 , $1 , $2 , $3 , $4 . These constructions are full-fledged Javascript expressions, therefore they support any operations, for example, calling the $0.appendChild(...) method . View screencast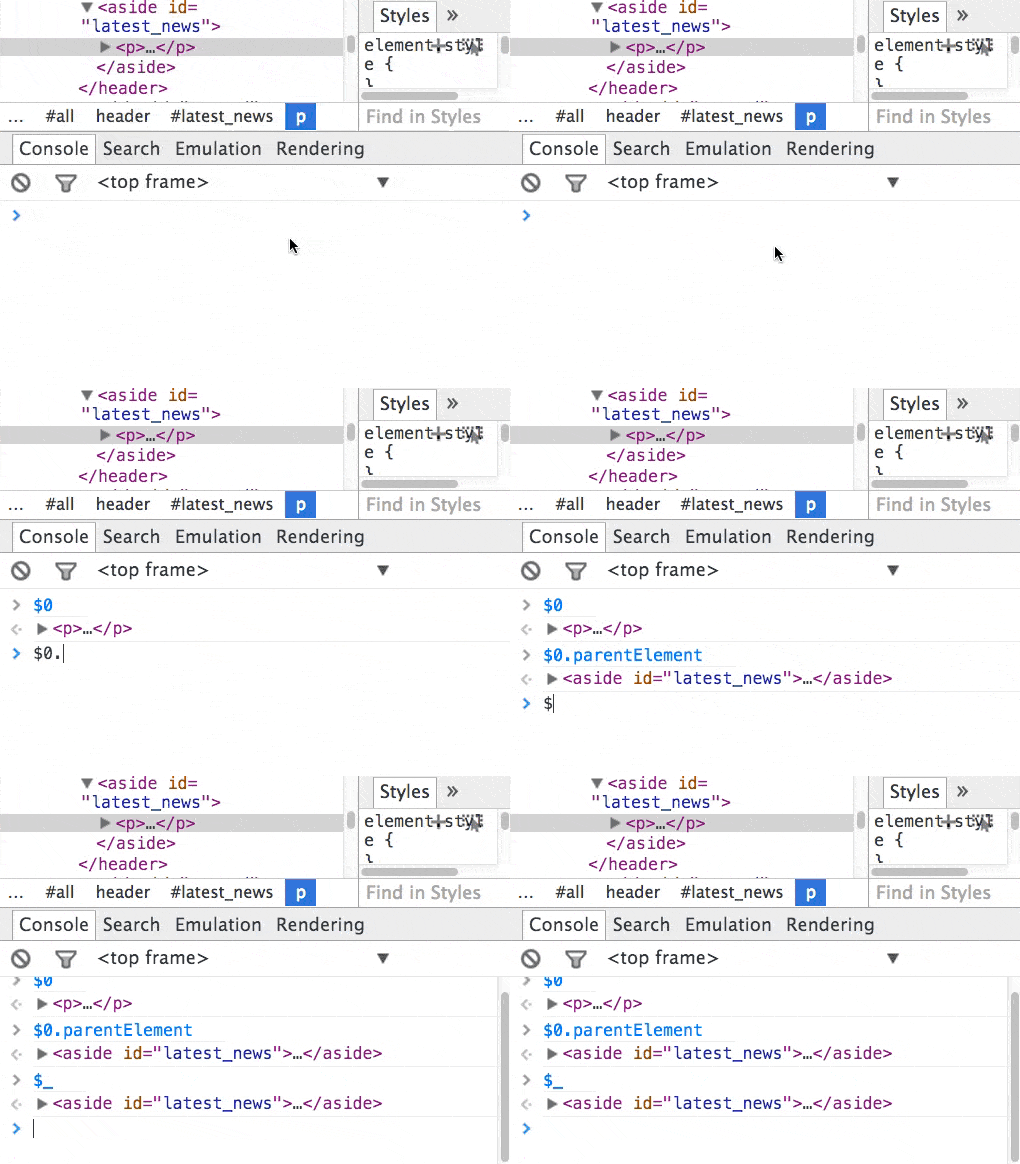

16. Monitoring pending network requests using the is: running filter
A search in the Network panel allows you to filter active (still not received a response) requests using the
is:running expression. You can also use filters such as status-code , method , domain and others. Note trans. : Today Chrome Canary 48 supports the following filters:
domain , has-response-header , is:running , larger-than , method , mime-type , mixed-content , scheme , set-cookie-domain , set-cookie-name , set-cookie-value , status-code . View screencast

Wait for the following parts!
Source: https://habr.com/ru/post/268519/
All Articles