We are looking for stability in retail, XYZ analysis of the range
XYZ analysis is one of the forms for analyzing the product range of a store, network or a separate product group in retail.

XYZ analysis determines the stability of sales of goods for a certain period. Useful for managing the assortment and supply of goods, the organization of work with suppliers. The results allow you to divide products into categories and allocate for them a place in stock, inventory levels and the organization of delivery.
')
As a separate analysis method in retail, XYZ is not used very often, it can often be found as combined with ABC analysis .
But, in any case, as a method for making decisions on managing the assortment of a commodity group or store can bring undoubted benefits.
We begin by considering its features and applicability.
The goal is to analyze the behavior of each product for a certain period to manage the product range.
The criterion for analysis may be the quantity of goods sold for a certain period, the demand for the goods, the number of purchases.
When choosing indicators of coefficients, you should use common sense and knowledge of your product group or the range of the network as a whole.
To conduct an XYZ analysis, be sure to remember about the seasonality of sales for certain products. An elementary example is ice cream, which is characterized by high sales stability in the hot part of the year, and absolutely unstable in the cold.
Accounting for so many factors requires automation of analysis. At this point there is already a fairly large number of systems that greatly simplify the work of the analyst or category manager.
For an example of XYZ analysis, we offer our research using the BI Datawiz.io service.
for a supermarket chain of 11 stores in the Milk and Dairy Products trade group. The aim was to highlight the categories of goods for the management of the range and to develop general recommendations on the formation of an order for each category.
Most of the products that belong to the group “Milk and dairy products” are sold all the time, often purchased for the future in supermarkets for the weekend. Therefore, the selected time interval - a week.
We will conduct an analysis of the group over the past six months.
We know that in general the “Milk and Dairy Products” product group is one of the most frequently sold in any supermarket. This gives us the opportunity to select fairly uniform categories with the coefficient of variation:
Category X - from 0 to 0.2;
Category Y - from 0.2 to 0.6;
Category Z - more than 0.6.
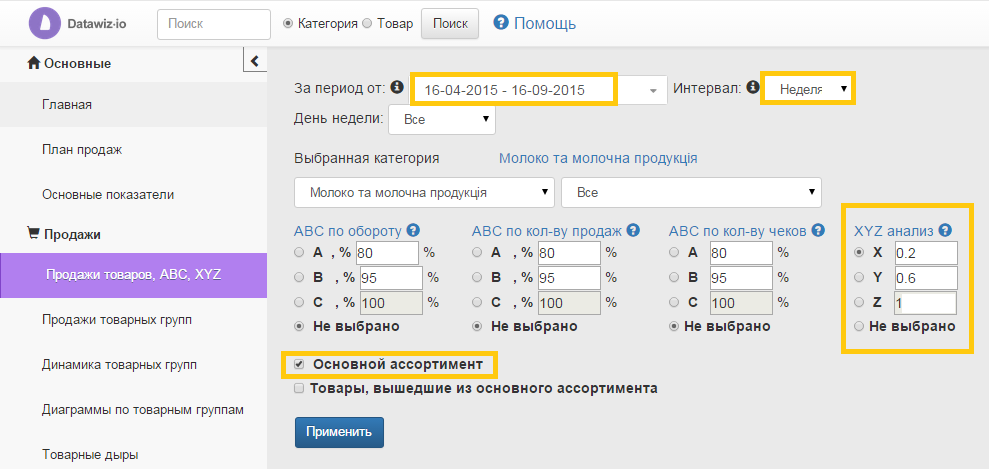
In the context of the commodity group “Milk and Dairy Products”, the analysis carried out highlighted category X out of 123 products.
In the table below, two products are specifically highlighted, which, with a large difference in the number of sales, have the same coefficient of variation, i.e. identical sales stability. This should be taken into account; goods with 18 sales in six months and with several thousand sales can be equally stable.

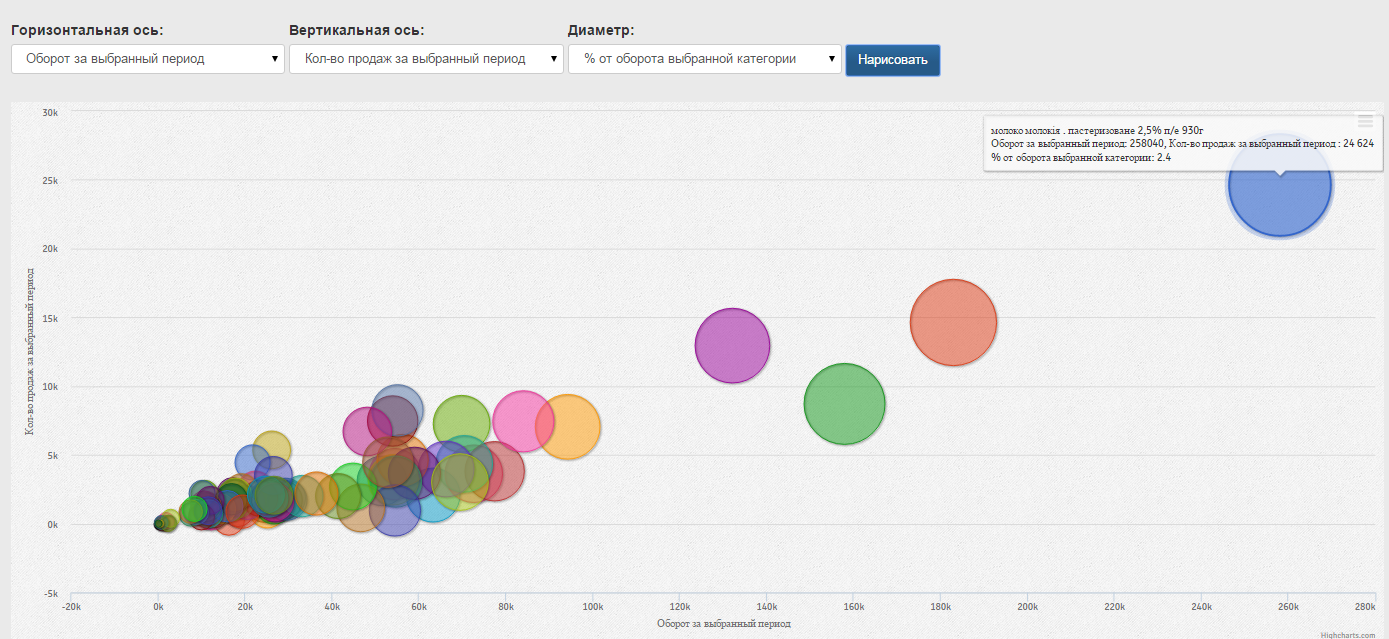
Building a visualization, as in the screenshot below, gives us the opportunity to analyze products from category X and highlight the sales leaders - this is pasteurized milk of several brands. It is worthwhile to focus on such goods first of all when organizing supplies, their loss on the shelves can lead to significant losses in sales, while buyers may not notice the lack of unpopular goods.
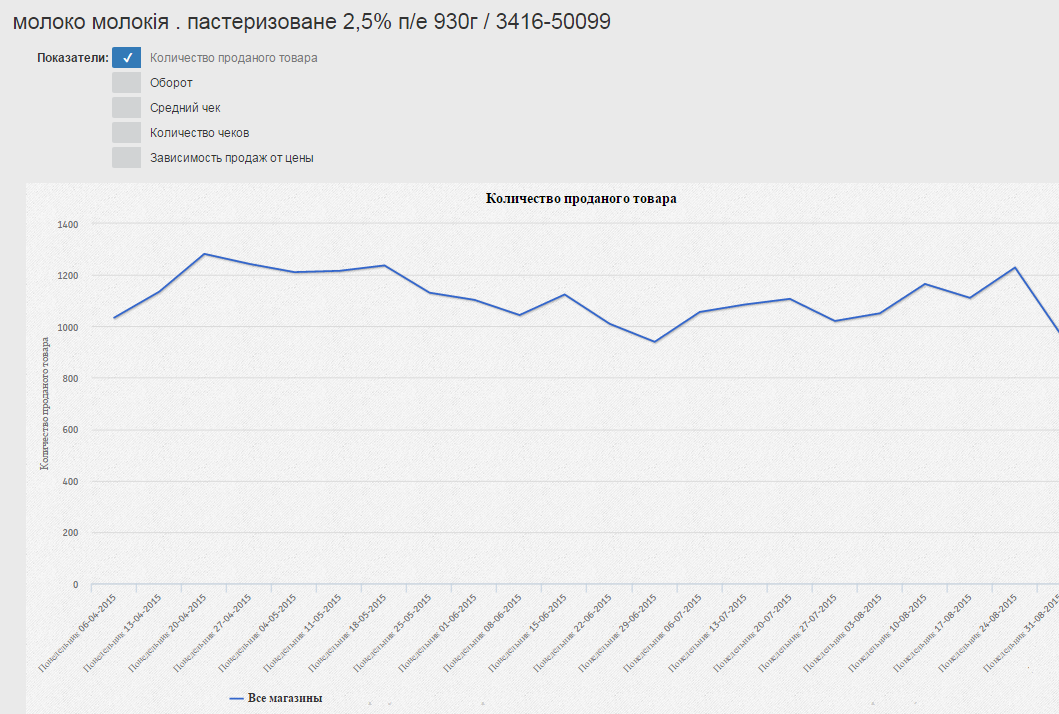
In order to more clearly demonstrate the stability of sales, here are charts of sales of individual products from each category X, Y and Z.
This is how the sales schedule for the X group looks like. Apparently, sales fluctuations are small.
Category Y. The most numerous category - this includes 572 products.

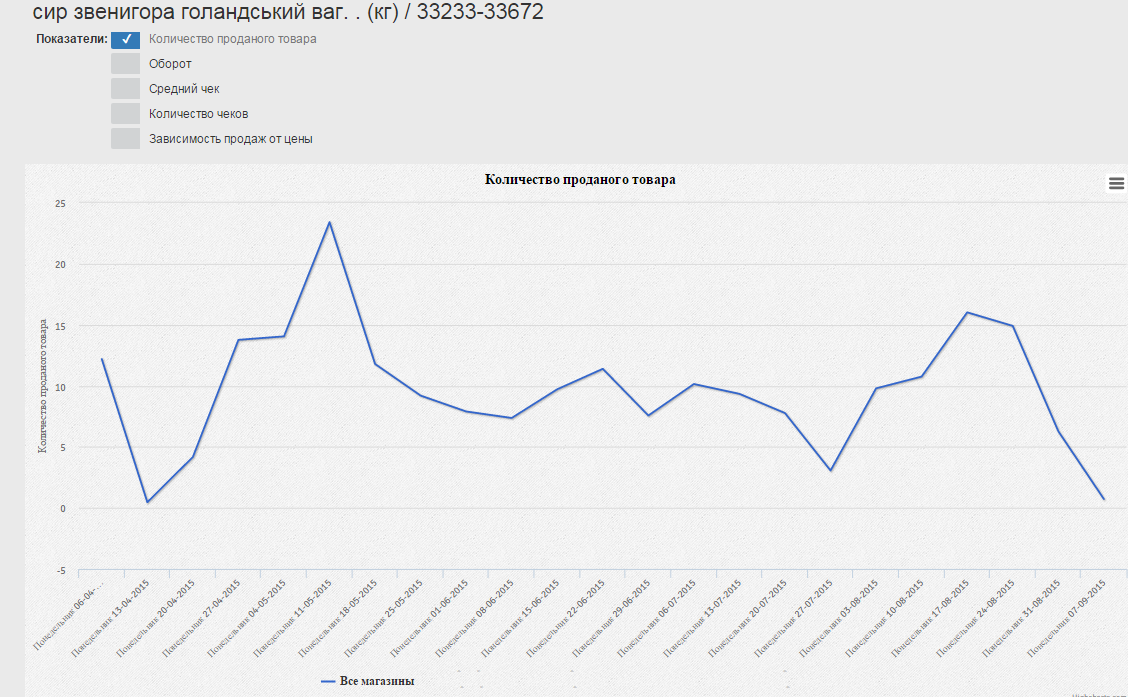
This is how the sales schedule for the category Y looks.
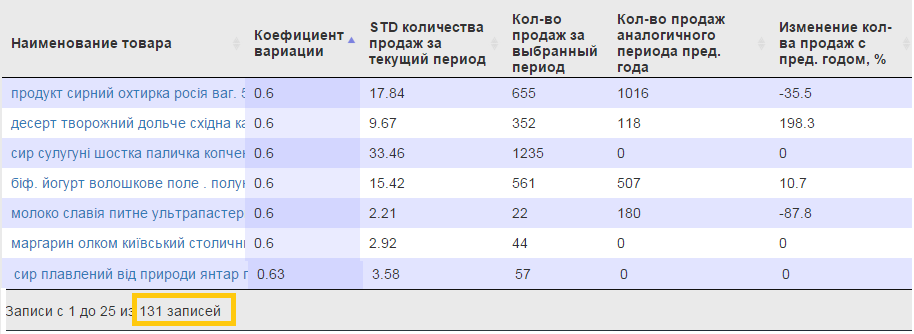
We will look at category Z , here 131 goods with absolutely unstable sales enter.
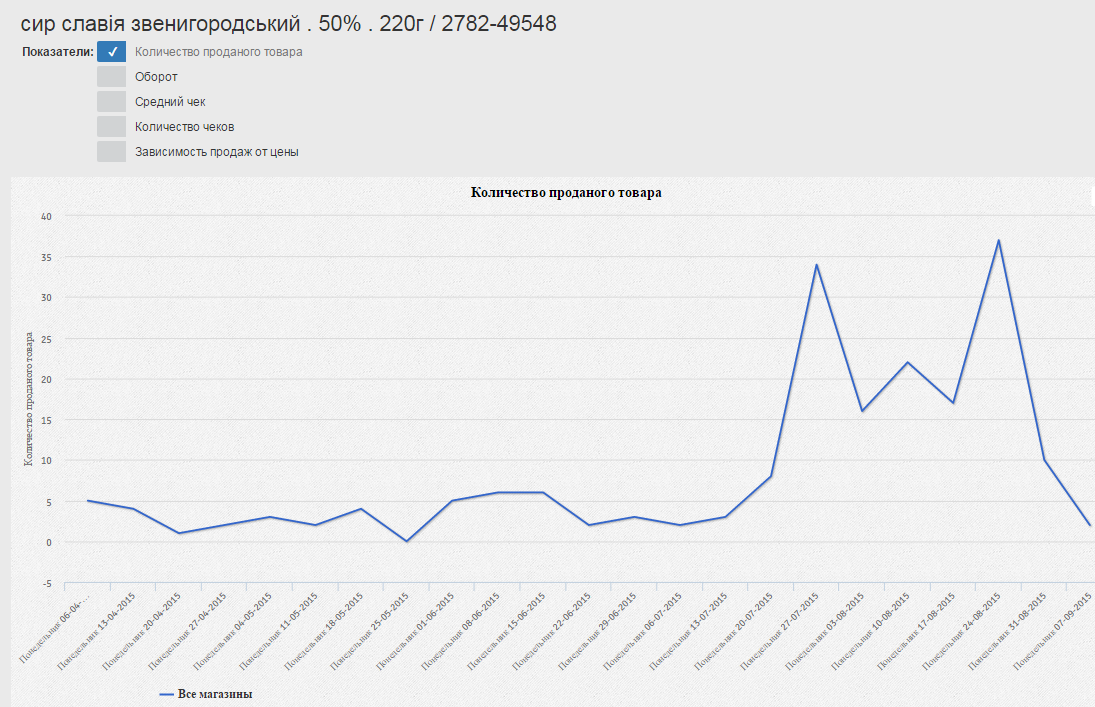
This is the sales schedule for this product category. As you can see, in the last 2 months there were 2 unexpected growth in sales of goods and again a sharp drop.
The stability of sales of goods is an important indicator of the efficiency of the trading network and of each store.
We apply XYZ analysis to identify problem stores in the network. We use the data of the same product group “Milk and Dairy Products” for six months, it always has high rates and stable sales.
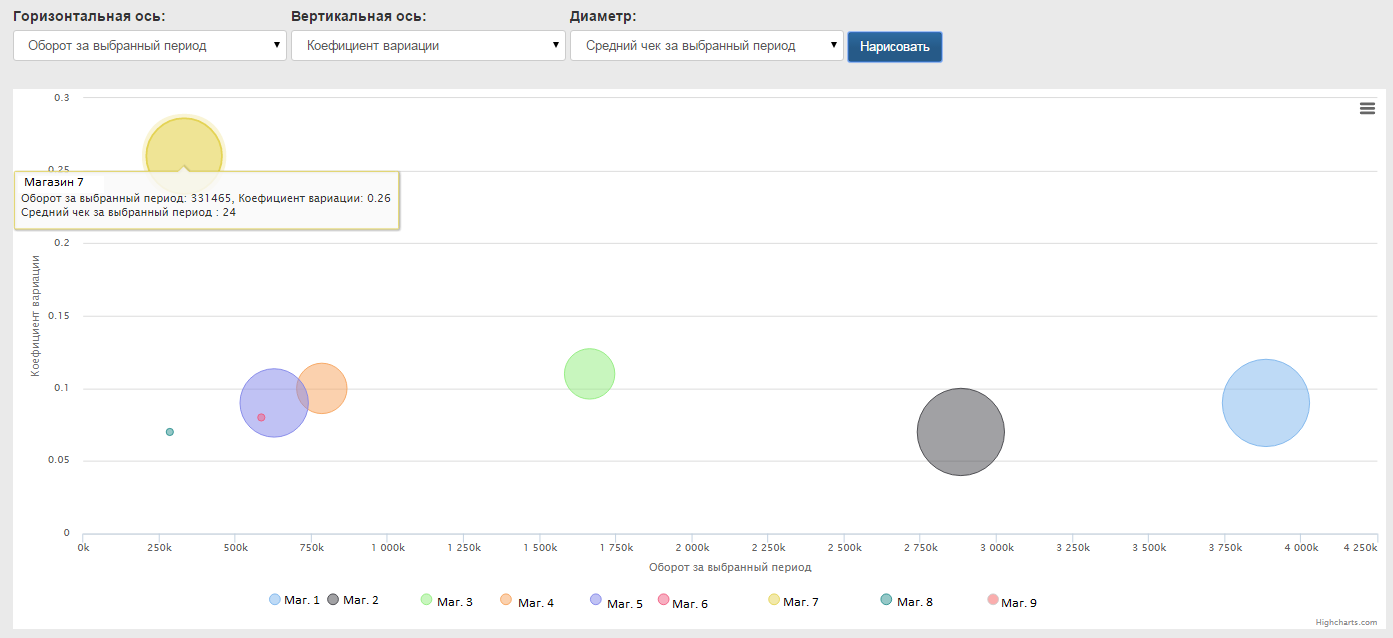
Let's build the visualization of data for each store of the trading network with such indicators:
horizontal - the turnover of each store for the selected period;
vertical - coefficient of variation;
point diameter - the average check.
As you can see, the coefficient of variation of sales of the “Milk and Dairy Products” product group for most of the chain’s stores, except one, is no higher than 0.15. The best turnover and average check is shown by shops No. 1 and No. 2.
But the store number 7 has a low turnover and a high coefficient of variation. Sales are not stable, more than 2 times comparing with other stores of the trading network. It is important to determine the causes of such a gap and take measures for the efficient operation of this store.
There are two approaches to the management of product range, the so-called "American" and "Japanese" systems of inventory management of goods.
The “American” or traditional management system involves limiting risks using the maximization of stocks of the product range, formalizing and setting up all the processes of analysis of the range and stock “once and for all”.
Accurate implementation of all procedures allows for effective management. Managers of the trading network are trying to protect themselves as much as possible from interruptions and supply problems, irregular demand for goods forming an adequate supply.
Such a management system requires significant material investments and constant analysis of inventory, but reduces the risks to the store or network assortment.
The “Japanese” inventory management system is minimization, optimization and automation. The system is more flexible and not so standardized in comparison with the “American” one.
It assumes an accurate forecast of consumer behavior, a forecast of sales of goods, and the organization of an Auto-order system, clarity in managing the entire order and delivery system, reliable suppliers, and just-in-time delivery.
The trading network builds its relations with suppliers on trust and delegation of part of its responsibilities. Inventory is considered in the Japanese system as an indicator of distrust of the supplier.
These two management models are dualistic, but in our realities their combination and the development of universal solutions work optimally.
On the basis of these management systems, we will analyze the desired approaches to working with each category:
Category X. Products with the highest stability of demand and sales.
This simplifies deliveries - we always know how much this product will sell and how much more it needs to be ordered.
In the case of category X - minimize our option! Stock should be in stock to make up the difference between selling and ordering. Not minimization of stocks, but minimization of management efforts, setting up accurate deliveries “on time”.
Category Y. Seasonal fluctuations, steady growth or decline - typical characteristics of the demand for these positions, then you need a stock. The main thing for this category is the issue of optimizing the level of the stock, to ensure the necessary level of customer service with a minimum of costs to create and maintain stock.
Category Z. These include products that have no trends or consistency in sales. Forecasting sales for them is impossible and inexpedient, which means an optimization approach to inventory management is not an option. The choice remains between the minimization (until the goods are removed from the range) or the maximization (if financial possibilities permit) of the Z category reserves.
When analyzing the range using XYZ categories, it is important to remember that this is one of a whole complex of methods that can be used both individually and in combination. Read about the combined types of analysis in the following publications from Datawiz.io .
XYZ analysis, in turn, is undoubtedly useful in determining categories by network, individual store or product group in terms of the stability of sales of individual products, optimization of the supply chain, in determining problem stores with non-permanent sales.

XYZ analysis determines the stability of sales of goods for a certain period. Useful for managing the assortment and supply of goods, the organization of work with suppliers. The results allow you to divide products into categories and allocate for them a place in stock, inventory levels and the organization of delivery.
')
As a separate analysis method in retail, XYZ is not used very often, it can often be found as combined with ABC analysis .
But, in any case, as a method for making decisions on managing the assortment of a commodity group or store can bring undoubted benefits.
We begin by considering its features and applicability.
The goal is to analyze the behavior of each product for a certain period to manage the product range.
The criterion for analysis may be the quantity of goods sold for a certain period, the demand for the goods, the number of purchases.
Stages of the XYZ analysis
- Choose a range of products for analysis.
Depending on the purpose, the analysis can be carried out on the entire assortment of a store, distribution network or product group. But, we propose to analyze only the main range.
The main assortment includes goods that are sold at least 2 times a week for the period selected for analysis.
Products that for some reason have become sold less than 2 times a week fall out of the main range. This may be elite, new, seasonal or missing items in stock. They are analyzed separately, because they require increased attention. - We determine the time interval for analysis, for which we will calculate the stability of the behavior of each product. The interval can be one day, week, month.
The interval for analysis should exceed the frequency of sales of most of the goods that will be analyzed.
For grocery retail, a logical choice would be a week due to the cyclical nature of consumer behavior. - The time period over which we will conduct the analysis.
The longer the selected period and the more time intervals it contains, the clearer the data obtained will be. - We calculate the arithmetic average of the number of sales of each product for the selected interval.

For example, we calculate the arithmetic average for sales of Milk product for September with an interval of 1 day.
- Standard deviation - the dispersion in sales of goods for the selected interval relative to the arithmetic average for sales of this product. The smaller the standard deviation, the closer to the average are sales data.
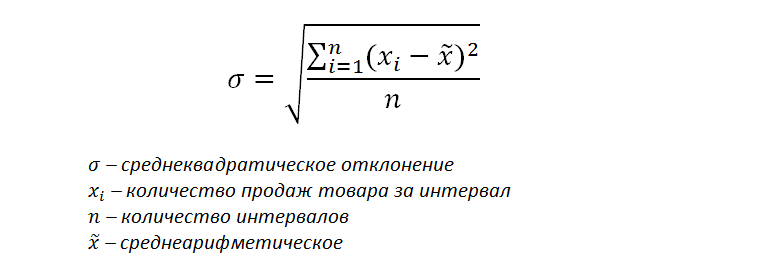
The standard deviation of our Milk example is calculated as follows:
- Next, determine the coefficient of variation for each product, it will be a relative indicator.

Determine the coefficient of variation for Milk: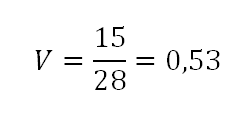
Why not use only the standard deviation without using the coefficient of variation?
Standard deviation depends on the quantity of goods sold, but there is no stability of sales. If the frequency of sales will be the same, the coefficient of variation will be similar for both products with 10 and 100, 1000 sales.
In some cases, the coefficient of variation may be greater than 1 if sales of the product are too unstable. For example, the goods were not sold for several months, and then 100 units were sold in one day.
For illustration on the screen below, the sale of goods with a coefficient of 1.3. Cheese, it was not sold at all, more than 60 kg of product were sold in a week.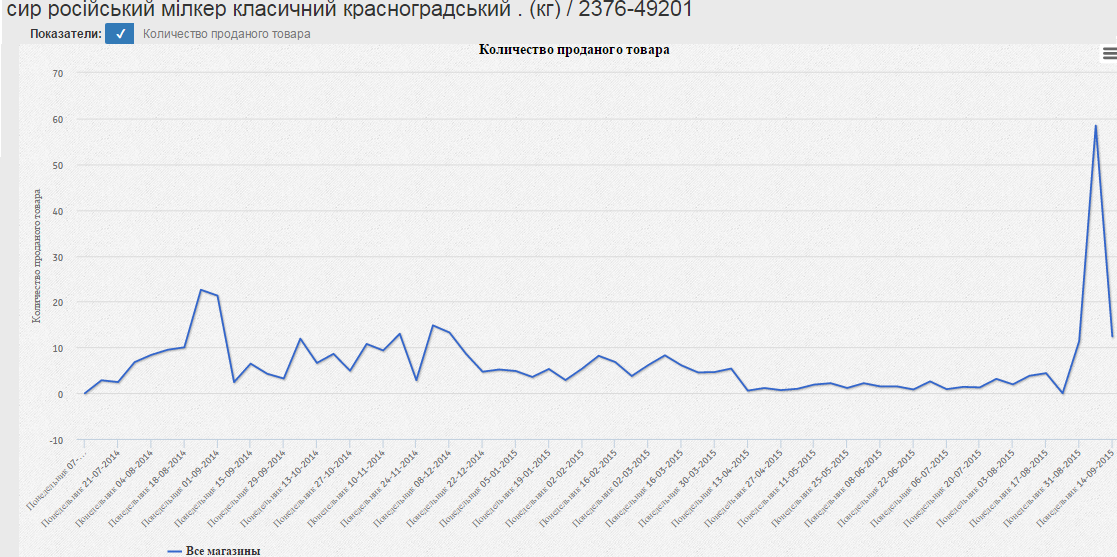
- Sort the obtained values of the coefficient of variation from the smallest to the largest.
- We define categories X, Y, Z.
When choosing indicators of coefficients, you should use common sense and knowledge of your product group or the range of the network as a whole.
- Category X, into which products fall with minimal fluctuation in sales, characterized by a stable amount of consumption and a high degree of forecasting to 0.1-0.2.
- Category Y, into which products with an average fluctuation of sales fall from 0.2 to 0.6, with seasonal fluctuations and average forecasting capabilities.
- Category Z, in which goods fall with sharp sales fluctuations from 0.6 and above, with irregular consumption and unpredictable fluctuations, therefore, it is impossible to predict their demand.
To conduct an XYZ analysis, be sure to remember about the seasonality of sales for certain products. An elementary example is ice cream, which is characterized by high sales stability in the hot part of the year, and absolutely unstable in the cold.
Accounting for so many factors requires automation of analysis. At this point there is already a fairly large number of systems that greatly simplify the work of the analyst or category manager.
For an example of XYZ analysis, we offer our research using the BI Datawiz.io service.
for a supermarket chain of 11 stores in the Milk and Dairy Products trade group. The aim was to highlight the categories of goods for the management of the range and to develop general recommendations on the formation of an order for each category.
Most of the products that belong to the group “Milk and dairy products” are sold all the time, often purchased for the future in supermarkets for the weekend. Therefore, the selected time interval - a week.
We will conduct an analysis of the group over the past six months.
We know that in general the “Milk and Dairy Products” product group is one of the most frequently sold in any supermarket. This gives us the opportunity to select fairly uniform categories with the coefficient of variation:
Category X - from 0 to 0.2;
Category Y - from 0.2 to 0.6;
Category Z - more than 0.6.

In the context of the commodity group “Milk and Dairy Products”, the analysis carried out highlighted category X out of 123 products.
In the table below, two products are specifically highlighted, which, with a large difference in the number of sales, have the same coefficient of variation, i.e. identical sales stability. This should be taken into account; goods with 18 sales in six months and with several thousand sales can be equally stable.

Building a visualization, as in the screenshot below, gives us the opportunity to analyze products from category X and highlight the sales leaders - this is pasteurized milk of several brands. It is worthwhile to focus on such goods first of all when organizing supplies, their loss on the shelves can lead to significant losses in sales, while buyers may not notice the lack of unpopular goods.

In order to more clearly demonstrate the stability of sales, here are charts of sales of individual products from each category X, Y and Z.
This is how the sales schedule for the X group looks like. Apparently, sales fluctuations are small.

Category Y. The most numerous category - this includes 572 products.

This is how the sales schedule for the category Y looks.

We will look at category Z , here 131 goods with absolutely unstable sales enter.

This is the sales schedule for this product category. As you can see, in the last 2 months there were 2 unexpected growth in sales of goods and again a sharp drop.

How else can XYZ analysis be used?
The stability of sales of goods is an important indicator of the efficiency of the trading network and of each store.
We apply XYZ analysis to identify problem stores in the network. We use the data of the same product group “Milk and Dairy Products” for six months, it always has high rates and stable sales.
Let's build the visualization of data for each store of the trading network with such indicators:
horizontal - the turnover of each store for the selected period;
vertical - coefficient of variation;
point diameter - the average check.
As you can see, the coefficient of variation of sales of the “Milk and Dairy Products” product group for most of the chain’s stores, except one, is no higher than 0.15. The best turnover and average check is shown by shops No. 1 and No. 2.
But the store number 7 has a low turnover and a high coefficient of variation. Sales are not stable, more than 2 times comparing with other stores of the trading network. It is important to determine the causes of such a gap and take measures for the efficient operation of this store.
How to apply the results of the analysis?
There are two approaches to the management of product range, the so-called "American" and "Japanese" systems of inventory management of goods.
The “American” or traditional management system involves limiting risks using the maximization of stocks of the product range, formalizing and setting up all the processes of analysis of the range and stock “once and for all”.
Accurate implementation of all procedures allows for effective management. Managers of the trading network are trying to protect themselves as much as possible from interruptions and supply problems, irregular demand for goods forming an adequate supply.
Such a management system requires significant material investments and constant analysis of inventory, but reduces the risks to the store or network assortment.
The “Japanese” inventory management system is minimization, optimization and automation. The system is more flexible and not so standardized in comparison with the “American” one.
It assumes an accurate forecast of consumer behavior, a forecast of sales of goods, and the organization of an Auto-order system, clarity in managing the entire order and delivery system, reliable suppliers, and just-in-time delivery.
The trading network builds its relations with suppliers on trust and delegation of part of its responsibilities. Inventory is considered in the Japanese system as an indicator of distrust of the supplier.
These two management models are dualistic, but in our realities their combination and the development of universal solutions work optimally.
On the basis of these management systems, we will analyze the desired approaches to working with each category:
Category X. Products with the highest stability of demand and sales.
This simplifies deliveries - we always know how much this product will sell and how much more it needs to be ordered.
In the case of category X - minimize our option! Stock should be in stock to make up the difference between selling and ordering. Not minimization of stocks, but minimization of management efforts, setting up accurate deliveries “on time”.
Category Y. Seasonal fluctuations, steady growth or decline - typical characteristics of the demand for these positions, then you need a stock. The main thing for this category is the issue of optimizing the level of the stock, to ensure the necessary level of customer service with a minimum of costs to create and maintain stock.
Category Z. These include products that have no trends or consistency in sales. Forecasting sales for them is impossible and inexpedient, which means an optimization approach to inventory management is not an option. The choice remains between the minimization (until the goods are removed from the range) or the maximization (if financial possibilities permit) of the Z category reserves.
When analyzing the range using XYZ categories, it is important to remember that this is one of a whole complex of methods that can be used both individually and in combination. Read about the combined types of analysis in the following publications from Datawiz.io .
XYZ analysis, in turn, is undoubtedly useful in determining categories by network, individual store or product group in terms of the stability of sales of individual products, optimization of the supply chain, in determining problem stores with non-permanent sales.
Source: https://habr.com/ru/post/268341/
All Articles
