Predicting Titanic Passenger Survival with Azure Machine Learning
Thank you very much for preparing the article for Kirill Malev from Merku. For more than 3 years, Kirill has been engaged in the practical application of machine learning for different amounts of data. The company solves problems in the field of predicting customer churn and natural language processing, paying great attention to the commercialization of the results. Graduated from the Bologna University and NSTU
Today we will tell you about how to use in practice the Azure cloud platform to solve machine learning tasks to solve machine learning problems using the popular prediction problem for surviving passengers of Titanic.
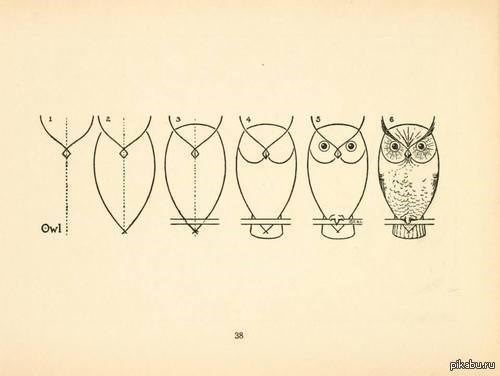
We all remember the famous picture about the owl, so in this article all the steps are commented on in detail. If you do not understand any step, you can ask questions in the comments.
Big Data and machine learning are already approaching a plateau of productivity, according to a fresh Gartner report . This means that the market has a sufficient understanding of how to apply big data processing technologies and people are more used to this topic than to 3D organ printing or the idea of colonizing Mars.
')
Habrahabr has already published articles that talk about using the Azure cloud platform for machine learning. They talk about how everything works, how you can use this platform and its advantages and disadvantages. We will complement this collection with two practical examples.
In both examples, we will use the Kaggle Data Scientist competition platform. Kaggle is the place where companies post data, identify problems that they would like to solve, after which engineers from all over the world compete to solve problems exactly. As a rule, for the best results, the winners at the publication of their decision receive cash prizes.
At the same time, in addition to commercial competitions, Kaggle also has disassembled tasks with provided data that are used for training. For them, the “knowledge” is directly indicated as a prize and these competitions are not completed.
We will begin our introduction to Azure ML by participating in the most famous of them: Titanic: Machine Learning from Disaster. We upload the data, analyze it using the R language models and the built-in Azure ML functions, get the results and upload them to Kaggle.
We will move from simple to complex: first we will get the result of analyzing the data using the code on R, then we will use the analysis tools built into the platform itself. The solution on R is given at the end of the article under the cut and it is specifically based on the official Kaggle training materials, so that beginners can, if they wish, become familiar with how they can get exactly the same results from scratch.
The main goal of this article is to use the functionality of the cloud solution to solve the classification problem. If you don’t understand the syntax or content of the R code, you can read a small introduction to solving data analysis problems using the example of the Titanic problem in R language in Trevor Stevens blog or take an interactive hour course on datacamp . Any questions about the models themselves are welcome in the comments.
Getting started with the cloud
To work with Azure, you need a Microsoft account. Registration takes 5 minutes, in addition, if you have not yet registered with Azure, you should pay close attention to Microsoft BizSpark , a startup support program that provides extended bonuses during registration. If you do not fall under the terms of this program, then at registration you will be allocated a trial $ 200, which can be spent on any Azure cloud resources. To test Azure ML and repeat the article is more than enough.
If you have an account, you can enter the Azure ML section .
Selecting “Machine Learning” from the list of Azure services on the left will prompt you to create a workspace (which will contain models and project files called “experiments”). You must immediately connect to the data storage account or create a new one. It is needed in order to store intermediate results of data processing or upload results.

After creating a workspace, you can create a project in it. To do this, you will need to click the "create" button:
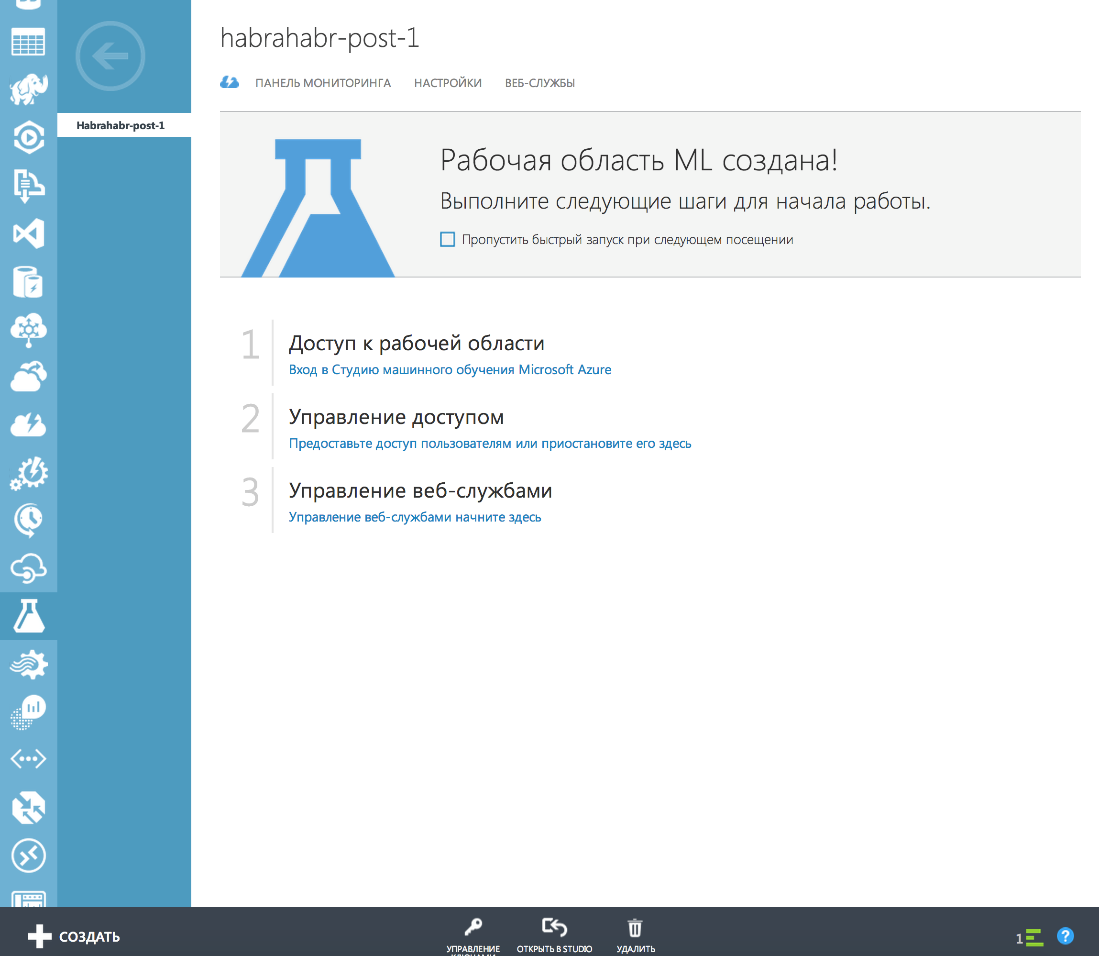
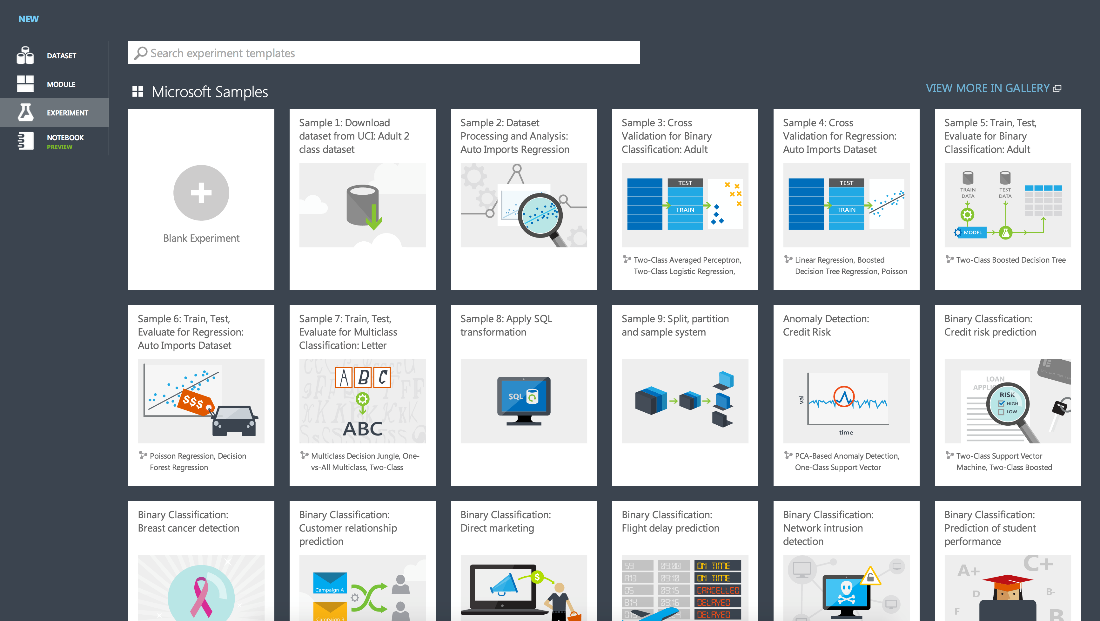
And then those who are accustomed to learn a new platform or framework with examples are waiting for a great gift - ready examples of projects with which you can quickly understand how the service works. In case of problems, the answers to most questions can be found in user - friendly online documentation . On the practice of working with Azure, all the necessary information can really be found there.
In the library of ready-made experiments there is an example of launching a model on R, which looks like this:
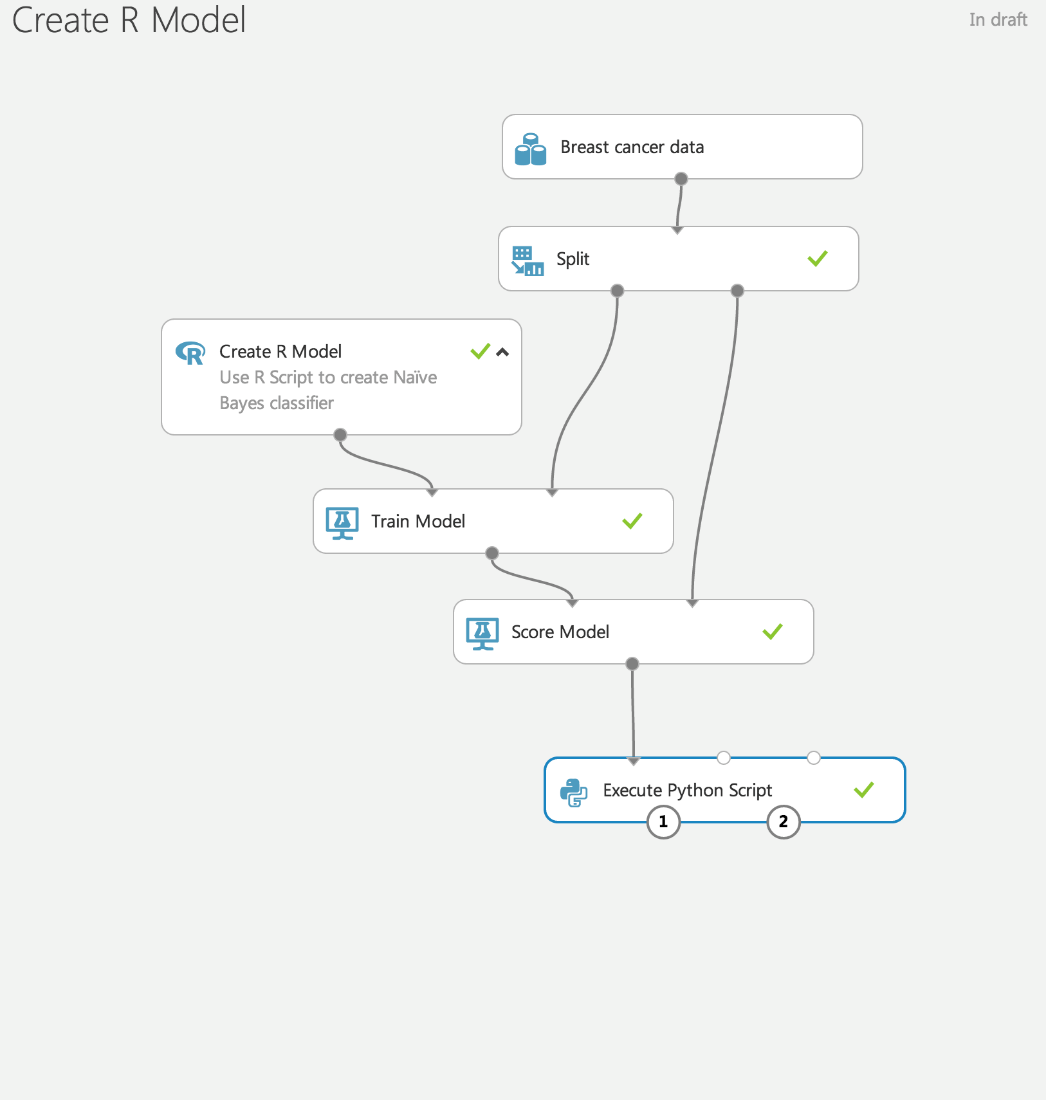
These blocks, connected by arrows, are the process of analyzing the data in this project (or experiment, if you use the terminology of Azure ML). Using this visualization greatly facilitates the understanding of data analysis and the CRISP-DM methodology.
The essence of this methodology is as follows:
- Data is loaded on Wednesday
- Useful features are selected / created from the data.
- The model is trained on the selected features.
- Using a separate data set, model quality is assessed.
- If the quality is unsatisfactory, then steps 2-4 are repeated; if satisfactory, then the model is used for its intended purpose.
For our article in the experiment creation dialog, we will select the very first version of the “Blank Experiment”, and then transferred 2 blocks to the workspace: “Execute R Script” from the “R language models” section on the left and “Writer” from Data Input And Output.
The model with which we begin will look much more modest than the one given in the initial example:

In the block “Execute R Script” we put the code that downloads the data, highlights the new properties of the objects, trains the model and makes the prediction. The only alternative to running the script on the local machine was that we replaced the line
write.csv(my_solution,file="my_solution.csv" , row.names=FALSE) on
maml.mapOutputPort("my_solution") to be able to save the solution in the cloud and then download it (this is explained below).
At the end of the R code, we had a line that shows the importance of various parameters. The output of scripts is available in the second “exit” (number “2” in the screenshot) from the block by clicking on the “Vizualize” menu item:

So, the code works, we saw which variables were the most important for the survival of the Titanic passengers, but how to get the result and upload it to Kaggle?
The first exit from the block, in which we put our predictions with the help of the line, is responsible for this.
maml.mapOutputPort("my_solution") It allows you to redirect the output from the R code to the Writer object, which writes our data set to the data warehouse. As settings, we specified the name of the repository that our experiment uses (habrahabrdata1) and the path to the container in which we wanted to record our result: saved-datasets / kaggle-R-titanic-dataset.csv
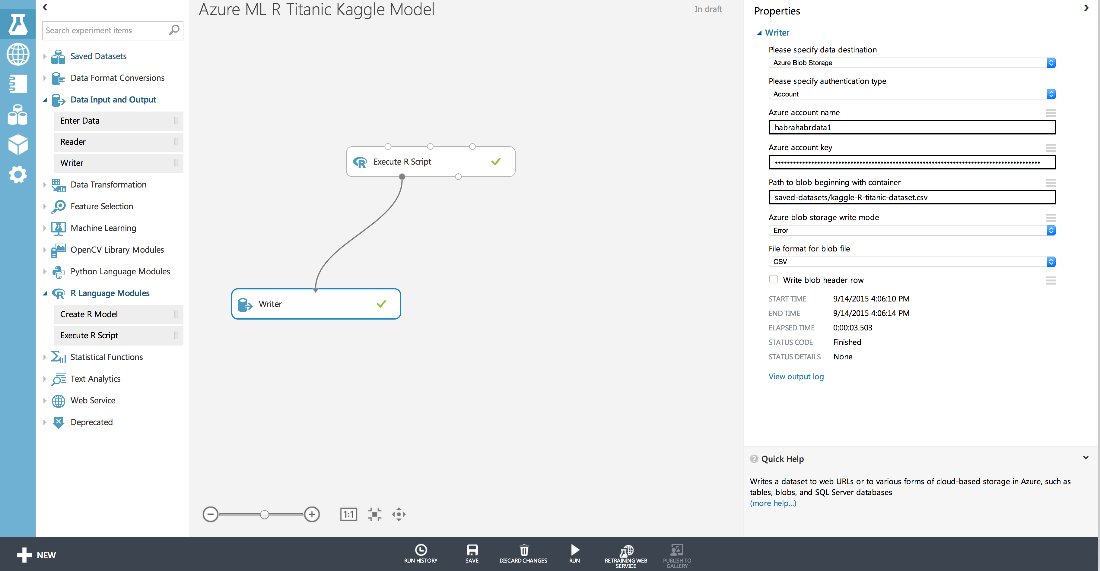
For convenience, we have previously created this separate storage in order not to lose data among the Azure ML service data (they can be viewed in the experimentouput repository). By the way, please note that when creating a repository you cannot use underscore “_” or capital letters.

Predictions of our model are downloaded immediately in csv-format from the cloud storage service. When sending this model we got the result: 0.78469
Use Azure Machine Learning Tools
Now that we’ve learned a little about the interface and how Azure ML works and made sure that everything works, we can use more of the functions built into the cloud to work with the data:
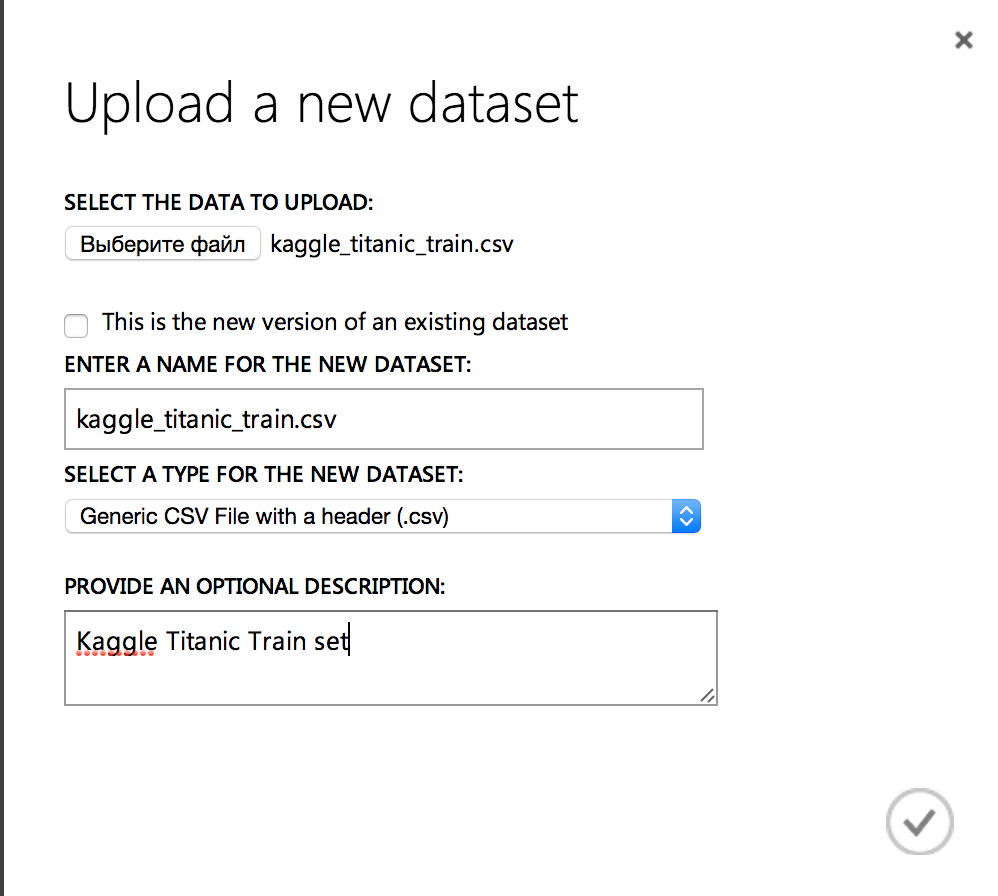
To begin with, we upload data to the cloud for training and evaluation of results. To do this, go to the "Datasets" section and load the previously downloaded .csv files:
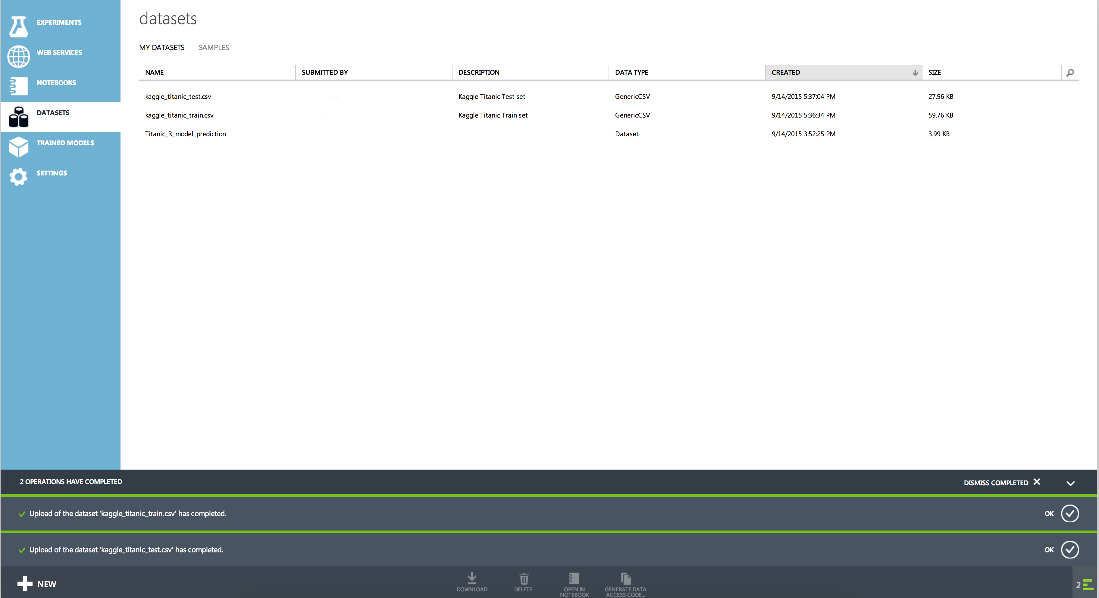
As a result, our data sets will look like this:
Accordingly, we can rewrite our script, which previously did all the work: downloaded the data, carried out their initial processing, divided it into test and training sets, trained the model and evaluated the test set.
Moving from simple to complex: now the code in R will be responsible only for data processing. We will upload data and divide it into a set for training and quality assessment using the cloud.
To do this, we append two lines to the top of the script:
train <- maml.mapInputPort(1) # class: data.frame test <- maml.mapInputPort(2) # class: data.frame and after the code that processes the signs we make the output:
maml.mapOutputPort("all_data") Now the basic scheme of the experiment will look like this:
And the condition of splitting into a set for training and a test set will look like this:
At the same time, at output 1 we will have a test set (because the splitting condition is fulfilled for it) and at output 2, for training.
Now we are ready to evaluate using the AUC criterion the efficiency of the binary classification algorithms built into the cloud. For the basis of this experiment, we took the example of Compare Binary Classifiers .
Checking one algorithm is as follows:
Each algorithm receives as input a sample of the kaggle_titanic_train for selecting the best parameters of the algorithms. These parameters are recruited using the Sweep Parameters block (for more information about it, see the article about iterating over parameters), which allows you to iterate over all the parameters in a given range, across the grid of all parameters or use a random pass. In the settings of the Sweep Parameters, you can set the evaluation criteria. We set AUC as a more suitable criterion for us.
After selecting the parameters, the best model obtained is estimated using a separate part of the sample. Results for models with the best parameters are displayed at the end of the whole experiment:
Clicking on the first exit from the last block “Execute R script” we get the result:
The best result showed Two-Class SVM. We can look at the best parameters by clicking on the output from the Sweep Parameters block:
As a result, to determine whether passengers will survive or not on the test data, we can run the model with the optimal parameters:
After creating an experiment with determining the best model, the new model will look quite simple:
It uses the same blocks as all our experiments before. The Train Model model receives the entire kaggle_titanic_train dataset, and for evaluation (prediction), the Score Model block is used, to which the kaggle_titanic_test dataset is sent with all the necessary attributes (which we calculated using R). Then, from the entire set, only columns with passenger ID and prediction will be left to survive or not, and the result is stored in Blob storage.
When you send the results of this model to Kaggle, you get the value of 0.69856 , which is less than the value we obtained using the method of decision trees, doing all the work in R.
However, if you train a similar algorithm from Azure ML (Two Class Decision Forest) with similar parameters (number of trees: 100), then when you send the result to Kaggle it will improve by 0.00957 and will be equal to 0.79426 .
Thus, the “magic” search of parameters does not cancel a more thorough manual search and the work of an expert who can get better results.
Conclusion
We considered the possibility of using the Azure ML cloud environment to participate in Kaggle data analysis competitions: both as an environment for executing code on R and partially using embedded cloud tools (leaving R primary processing and generation of new features).
This environment can be used to apply machine learning, especially when the analysis results need to be left in the Hadoop cluster (Microsoft provides its implementation) or published as a web service.
In the case of a positive response, we will also publish in this blog an equally detailed example of the publication of a machine learning model as a web service.
Complete solution of the problem on R
# All data, both training and test set # Assign the training set train <- read.csv(url("http://s3.amazonaws.com/assets.datacamp.com/course/Kaggle/train.csv")) # Assign the testing set test <- read.csv(url("http://s3.amazonaws.com/assets.datacamp.com/course/Kaggle/test.csv")) test$Survived <- NA all_data = rbind (train,test) # Passenger on row 62 and 830 do not have a value for embarkment. # Since many passengers embarked at Southampton, we give them the value S. # We code all embarkment codes as factors. all_data$Embarked[c(62,830)] = "S" all_data$Embarked <- factor(all_data$Embarked) # Passenger on row 1044 has an NA Fare value. Let's replace it with the median fare value. all_data$Fare[1044] <- median(all_data$Fare, na.rm=TRUE) #Getting Passenger Title all_data$Name <- as.character(all_data$Name) all_data$Title <- sapply(all_data$Name, FUN=function(x) {strsplit(x, split='[,.]')[[1]][2]}) all_data$Title <- sub(' ', '', all_data$Title) all_data$Title[all_data$Title %in% c('Mme', 'Mlle')] <- 'Mlle' all_data$Title[all_data$Title %in% c('Capt', 'Don', 'Major', 'Sir')] <- 'Sir' all_data$Title[all_data$Title %in% c('Dona', 'Lady', 'the Countess', 'Jonkheer')] <- 'Lady' all_data$Title <- factor(all_data$Title) all_data$FamilySize <- all_data$SibSp + all_data$Parch + 1 library(rpart) # How to fill in missing Age values? # We make a prediction of a passengers Age using the other variables and a decision tree model. # This time you give method="anova" since you are predicting a continuous variable. predicted_age <- rpart(Age ~ Pclass + Sex + SibSp + Parch + Fare + Embarked + Title + FamilySize, data=all_data[!is.na(all_data$Age),], method="anova") all_data$Age[is.na(all_data$Age)] <- predict(predicted_age, all_data[is.na(all_data$Age),]) # Split the data back into a train set and a test set train <- all_data[1:891,] test <- all_data[892:1309,] library(randomForest) # Train set and test set str(train) str(test) # Set seed for reproducibility set.seed(111) # Apply the Random Forest Algorithm my_forest <- randomForest(as.factor(Survived) ~ Pclass + Sex + Age + SibSp + Parch + Fare + Embarked + FamilySize + Title, data=train, importance = TRUE, ntree=1000) # Make your prediction using the test set my_prediction <- predict(my_forest, test, "class") # Create a data frame with two columns: PassengerId & Survived. Survived contains your predictions my_solution <- data.frame(PassengerId = test$PassengerId, Survived = my_prediction) # Write your solution away to a csv file with the name my_solution.csv write.csv(my_solution,file="my_solution.csv" , row.names=FALSE) varImpPlot(my_forest) Bibliography
- Introduction to machine learning and a quick start with Azure ML
- Azure Machine Learning for Data Scientist
Source: https://habr.com/ru/post/268039/
All Articles