Bad "Spring" or as the reasons for the delays were looking for
We are used to seeing the history of projects with millions of clients and a whole fleet of servers, but various interesting and funny situations can also be found on relatively small projects. One of them happened recently. Once the server was working normally, it suddenly began to slow down in a random way ...

I'll start with a little background. Often, there are projects that have been replaced by many developers who do not always know what they were doing or not thinking about what they were doing before them. It is not always possible, or even more justified, to comb it all right now, and you have to quickly fix the problems, regardless of the general desire to throw it all into the pipe.
On one such project a strange thing happened. Approximately at the same time, as minor corrections were made on the functionality, it was not known from where strange slowdowns began to occur on page generation, almost a minute. (the one who spoiled everything was to blame, but the one who was the last to touch :))
Realizing that these corrections can not make this, they began to dig. The first thought is “this is some strange timeout, probably knocking somewhere remotely”. We had to cling to this idea and not let it go, but more on that later. The site was on bitrix, quite complex and there were a lot of different agents. Almost all of them worked on the crown. But you never know what. It was painfully floating that there were slowdowns, with different users and once in several consecutive visits (another alarm bell, which no one paid attention to).
')
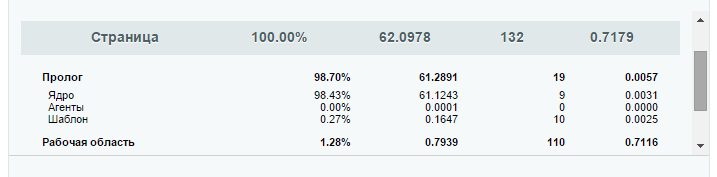
The bitrix profiler showed that it was in the PHP code of the prolog core. (just there agents can sometimes be run). Sometimes it was true that the problem moved to the template code. But since in most cases the prologue was decided to start with it. (another mistake that could save some valuable time)
Started digging consistently.
It would be necessary to measure the various parts of the core. (Here we would have to grasp the sensible idea that why these manual measurements of the code, we should put it on the XHProf combat server and see, but it was decided that there would be anyway). The core piece is obfuscated. A little manual dexterity, and the main places become clear, the code is broken into pieces, and you can take measurements of its individual parts.
The search is narrowed down and here we find our suspect. How so session_start () ???

We look, sessions in files, files on SSD, sessions the cat wept. Must work out instantly. And here we turned off the right path. Going in a roundabout way. Thoughts are logical. If the session starts for a long time, then there may be problems with IO, delays in the templates worked on the same idea. Long connected files. htop / iotop and other brethren show that there are no problems with the input output. File folders fly back and forth without any delays. There are no errors in the raid logs, the ssd firmware is recent. SSD manufactured by Intel. That is the case with the Samsung mentioned in Habré here no side.
We try to transfer the session to the ram disk, to no avail. The problem repeats more often. Restarting processes does not help. We plan on rebooting the physical server for the night in order to eliminate possible problems that could have accumulated over the uptime year, at the same time all kernel updates will arise.
Restarting did not help. In the nginx logs there are strange inscriptions like:
They coincide in time with the known slowdowns. It seems that the problem is much more common than it seemed. Having thought it, we come to the idea that everything is logical, if the Apache for some reason is waiting for the session and does not hang at the same time, then he should somehow say to nginx that everything is fine, and we must wait, it means that he is probably sending empty packets which nginx puts in the buffer. We set this aside and move on.
We update services. apache / php / nginx updated. The problem is still there. Free memory on the server under 25%, the swap settings are spinning to avoid any hypothetical problems with transferring the Apache processes to disk. Quite expectedly no results.
We transfer sessions to memcached. We try to find a solution to the problem on stackoverflow. (We are moving further away from the root of the problem, parallelly turning up the settings of the software and the system). We transfer the cache partially in memcache partially to the ram disk.
As you can guess no sense.
We get heavy artillery. Once again we are trying to catch the process with the command - ps -e -o pid, comm, wchan = WIDE-WCHAN-COLUMN | grep httpd . It looks like this is poll_schedule_timeout . Cling with strace.

Long wait -
After which the process comes to life. Like the page in the browser.
We see work with sockets.
I remember the original thoughts about timeouts.
Looks like they found the culprit. We find on the strace where we knocked
And close vesna.yandex.ru. (What is such a vesna.yandex.ru where did it come from then? I understand some kind of doorway or something like that, but is this?)
Problems suddenly disappear. Disable memcache and ram disk, everything is fine. So it is in this.
Go back to strace logs and look for the reason
Defa.Tools ? And what have the defa.tools. profiling clearly showed session_start ().

We climb into the code. We see the receipt of an archive with vesna.yandex.ru for the autogeneration of some texts. (a functional that no one used, and in fact, like the module itself. It was put by some of the previous developers).
An understanding of what is likely due to frequent reversal or even for whatever reasons, yandex starts to delay this file from time to time or does not return at all, and therefore we began to stumble upon this problem. (why it is impossible to put the file received from Yandex into the cache on the server, and update it from time to time, rather than store it in a class instance and constantly request it - this is a question for the defa.tools developers).
But why is it called to us, and the main question is where session_start () is. We continue to dig. And we find a hung handler (recall, a rather complicated project that a bunch of people wrote, transferring from developer to developer, many handlers in different files, sometimes without some kind of system) to save the property.
We find not correctly registered filter. The problem of brakes is finally found.
Now back to the main mystic, and here session_start. On all pages for authorized users (in view of the subject and ideas of the site, most users are authorized) there is a call to the update check script by ajax. (websocket'y? No, I have not heard). The browser separates the wheat from the chaff, so it allows you to open a new tab at the time of the ajax request. Since the session was started there, but not yet completed, the session_start obediently waits for it to be allowed to begin. And it has nothing to do with io and other shamanism.
What conclusions can be drawn as a result:
I'll start with a little background. Often, there are projects that have been replaced by many developers who do not always know what they were doing or not thinking about what they were doing before them. It is not always possible, or even more justified, to comb it all right now, and you have to quickly fix the problems, regardless of the general desire to throw it all into the pipe.
On one such project a strange thing happened. Approximately at the same time, as minor corrections were made on the functionality, it was not known from where strange slowdowns began to occur on page generation, almost a minute. (the one who spoiled everything was to blame, but the one who was the last to touch :))
Investigation began
Realizing that these corrections can not make this, they began to dig. The first thought is “this is some strange timeout, probably knocking somewhere remotely”. We had to cling to this idea and not let it go, but more on that later. The site was on bitrix, quite complex and there were a lot of different agents. Almost all of them worked on the crown. But you never know what. It was painfully floating that there were slowdowns, with different users and once in several consecutive visits (another alarm bell, which no one paid attention to).
')
The bitrix profiler showed that it was in the PHP code of the prolog core. (just there agents can sometimes be run). Sometimes it was true that the problem moved to the template code. But since in most cases the prologue was decided to start with it. (another mistake that could save some valuable time)
Started digging consistently.
- Step one. At first, the changes made were rolled back, the problem did not disappear. Breathed quietly, yet we did not.
- Step two. Added logging time to agent call mechanism. No correlation with slowdowns, all figures at the level of milliseconds.
It would be necessary to measure the various parts of the core. (Here we would have to grasp the sensible idea that why these manual measurements of the code, we should put it on the XHProf combat server and see, but it was decided that there would be anyway). The core piece is obfuscated. A little manual dexterity, and the main places become clear, the code is broken into pieces, and you can take measurements of its individual parts.
The search is narrowed down and here we find our suspect. How so session_start () ???
The clouds are gathering
We look, sessions in files, files on SSD, sessions the cat wept. Must work out instantly. And here we turned off the right path. Going in a roundabout way. Thoughts are logical. If the session starts for a long time, then there may be problems with IO, delays in the templates worked on the same idea. Long connected files. htop / iotop and other brethren show that there are no problems with the input output. File folders fly back and forth without any delays. There are no errors in the raid logs, the ssd firmware is recent. SSD manufactured by Intel. That is the case with the Samsung mentioned in Habré here no side.
We try to transfer the session to the ram disk, to no avail. The problem repeats more often. Restarting processes does not help. We plan on rebooting the physical server for the night in order to eliminate possible problems that could have accumulated over the uptime year, at the same time all kernel updates will arise.
Restarting did not help. In the nginx logs there are strange inscriptions like:
*38600646 an upstream response is buffered to a temporary file /var/cache/nginx/proxy_temp/7/29/0000006297 while reading upstream They coincide in time with the known slowdowns. It seems that the problem is much more common than it seemed. Having thought it, we come to the idea that everything is logical, if the Apache for some reason is waiting for the session and does not hang at the same time, then he should somehow say to nginx that everything is fine, and we must wait, it means that he is probably sending empty packets which nginx puts in the buffer. We set this aside and move on.
We update services. apache / php / nginx updated. The problem is still there. Free memory on the server under 25%, the swap settings are spinning to avoid any hypothetical problems with transferring the Apache processes to disk. Quite expectedly no results.
We transfer sessions to memcached. We try to find a solution to the problem on stackoverflow. (We are moving further away from the root of the problem, parallelly turning up the settings of the software and the system). We transfer the cache partially in memcache partially to the ram disk.
As you can guess no sense.
I have to go deeper
We get heavy artillery. Once again we are trying to catch the process with the command - ps -e -o pid, comm, wchan = WIDE-WCHAN-COLUMN | grep httpd . It looks like this is poll_schedule_timeout . Cling with strace.
Long wait -
restart_syscall(<... resuming interrupted call ...>) After which the process comes to life. Like the page in the browser.
We see work with sockets.
getsockopt(32, SOL_SOCKET, SO_ERROR, [110], [4]) = 0 fcntl(32, F_SETFL, O_RDWR) = 0 close(32) = 0 socket(PF_INET, SOCK_STREAM, IPPROTO_IP) = 32 fcntl(32, F_GETFL) = 0x2 (flags O_RDWR) fcntl(32, F_SETFL, O_RDWR|O_NONBLOCK) = 0 connect(32, {sa_family=AF_INET, sin_port=htons(80), sin_addr=inet_addr("87.250.250.85")}, 16) = -1 EINPROGRESS (Operation now in progress) I remember the original thoughts about timeouts.
Looks like they found the culprit. We find on the strace where we knocked
sendto(32, "\0\264\1\0\0\1\0\0\0\0\0\0\5vesna\6yandex\2ru\0\0\1\0"..., 33, MSG_NOSIGNAL, NULL, 0) = 33 And close vesna.yandex.ru. (What is such a vesna.yandex.ru where did it come from then? I understand some kind of doorway or something like that, but is this?)
Problems suddenly disappear. Disable memcache and ram disk, everything is fine. So it is in this.
Go back to strace logs and look for the reason
lstat("/home/bitrix/ext_www/XXX/bitrix/modules/defa.tools/include.php", {st_mode=S_IFREG|0775, st_size=11 43, ...}) = 0 lstat("/home/bitrix/ext_www/XXX/bitrix/modules/defa.tools", {st_mode=S_IFDIR|0775, st_size=4096, ...}) = 0 lstat("/home/bitrix/ext_www/XXX/bitrix/modules/defa.tools/classes/general/ibprop_elemcompleter.php", {st_ mode=S_IFREG|0775, st_size=15267, ...}) = 0 Defa.Tools ? And what have the defa.tools. profiling clearly showed session_start ().
The light in the darkness
We climb into the code. We see the receipt of an archive with vesna.yandex.ru for the autogeneration of some texts. (a functional that no one used, and in fact, like the module itself. It was put by some of the previous developers).
An understanding of what is likely due to frequent reversal or even for whatever reasons, yandex starts to delay this file from time to time or does not return at all, and therefore we began to stumble upon this problem. (why it is impossible to put the file received from Yandex into the cache on the server, and update it from time to time, rather than store it in a class instance and constantly request it - this is a question for the defa.tools developers).
But why is it called to us, and the main question is where session_start () is. We continue to dig. And we find a hung handler (recall, a rather complicated project that a bunch of people wrote, transferring from developer to developer, many handlers in different files, sometimes without some kind of system) to save the property.
We find not correctly registered filter. The problem of brakes is finally found.
Solution
Now back to the main mystic, and here session_start. On all pages for authorized users (in view of the subject and ideas of the site, most users are authorized) there is a call to the update check script by ajax. (websocket'y? No, I have not heard). The browser separates the wheat from the chaff, so it allows you to open a new tab at the time of the ajax request. Since the session was started there, but not yet completed, the session_start obediently waits for it to be allowed to begin. And it has nothing to do with io and other shamanism.
What conclusions can be drawn as a result:
- The legacy of the old code always sneaks up unnoticed, and it hits the head hard.
- Trust your intuition. (The idea of accessing an external resource turned out to be true. But shamanism with the installation and setup of XHProf would make it possible to notice that there are other long delays. And accordingly, to understand the essence of the problem more quickly.)
- Roll out heavy artillery early.
- Most likely the problem is much simpler than it seems.
Source: https://habr.com/ru/post/268035/
All Articles