Search and read legacy code
Vasya is a young programmer. Having received the task and rolled up the sleeves, he takes up writing the code. One day later, the solution of the problem is ready, Vasya launches it ... And he encounters an unexpected annoying mistake. Vasya diligently fixes it and reruns the solution. The result is again an unpleasant mistake. So Vasya takes a long time to rake, rewrites the program a couple of times, until, finally, after a week, the task is not completely solved.
Petya is an experienced programmer. After receiving the statement, he is looking for whether there is any source code that solved a similar problem. Petya spends a couple of days reading materials and sorting out other modules, and on the third he launches his solution based on the already existing code. It has a couple of minor bugs that can be quickly fixed. Hooray! Everything works as it should, on the third day.
How to find the piece of source code you need? How to understand it? And most importantly - why do all this? In the search for answers to these questions, welcome under cat.
D. Thomas and D. Spinellis in the book "Analysis of the program code on the example of Open Source projects" formulate several important theses.
')
Reading the code is a programmer's daily routine.
From the outside it seems that the main work of the programmer is to write the source code, but it is not. Most often, the code has to read, not write. Yesterday your friend wrote a module, and today you are faced with the task of improving it or correcting an error, which is impossible without a preliminary study of the work of your friend.
90% of errors can be eliminated when reading the code.
With the figure of 90%, it seems to me, it is possible to argue, but the basic idea is clear: when reading (in this case, reviewing) a program, you can (and should) identify and eliminate errors.
We are often taught to write code, but rarely - to read it.
And in vain, because without reading the existing source you have to constantly reinvent the wheel. Even if you can write something from scratch, it is much more effective to look around and use someone else's source code directly or as an analogy. Someone else's code has been tested, debugged and, most likely, already contains some “features” that will be useful in solving your problem.
So read the code to not write bicycles. Read the code to make changes faster. Read the code so that there are fewer errors in the programs.
The main goal of the article is to systematize the existing approaches to searching and reading code. Knowledge of specific approaches makes it possible to apply those that are most appropriate in a particular case. In addition, the article provides an overview of the tools that will effectively apply the approaches described in the article. It is worth noting that you can search and understand the source code without special tools, but their use makes the process more visual and less routine.
I will talk about the most universal concepts: in other words, these concepts are applicable to all or almost all programming languages. Some tools that make it easier to find and read the source are also universal, but most are only relevant for Visual Studio and .NET. Nevertheless, the fact that most of the tools are used exclusively in VS does not mean that there are no similar tools for other IDEs: I am sure that they exist, since the approaches presented in the article are universal. I also make a reservation that all the tools described are free, the exception is only ReSharper.
The code examples in the article are taken from the ShareX and Greenshot applications (both distributed under the GNU GPL license ) from the ShareX repository as of June 30, 2015. I thank the authors of these applications for the opportunity to use their code base. I also thank my colleagues, especially Denis Gavrilov and Vladislav Iof, for their comments during the work on this article.
Code search is a process that results in parts of the source code related to the subject of the problem being solved.
You can start looking for source codes outside the codebase. Pre-communication with the team, reading the documentation and bug tracker can greatly simplify the direct search code. You can learn more about working with artifacts from D. Gavrilov 's seminar “Teamwork Practices: The Use of Written Artifacts” . In addition to reading the documentation and communicating with the team, it is useful to remember that you already know what is to be found. For example, if you have to find a screen form, then it is worth remembering that the name of screen forms in your project usually ends with a Form, and all forms are in the collection “UI”.
You can run the application for execution and search the screen form. When iterating, the programmer opens in a random (or not so) order of the form until he finds a window, button, menu item, or any other interface element that appears to use the desired functionality. Brute force is used when the search task is blurred or the programmer is not familiar with the system. For example, you have never worked with an application, and you are required to add a function that would export all open pictures to the clipboard. It seems logical to start exploring the application: see if it can export images to the clipboard one by one, are there any settings related to the buffer or export, etc.
A keyword is a word or phrase from the text of a document or query that carries a significant semantic meaning from the point of view of information retrieval. The selection of keywords required for the search is formed through communication with users, screening through screen forms and other methods described above as an “out of code” search. Keywords can be taken from the task description, screen forms and user actions, the text of the error or message, the SQL query, that is, from any artifacts associated with the problem being solved.
To make keyword searches as effective as possible, you need to select rare keywords. For example, if you are working on a project in which there are many different documents (Document), then a search for the word Document will give a lot of unnecessary results. However, there are situations when it is not possible to select rare keywords. In this case, you first need to find a lot of potentially useful information, and then narrow down the search. For example, find all existing references to the Document, and then exclude tests from the results, search for additional keywords in the files found, etc. In general, you should strive to find at least something (a little more or a little less), and not exactly what do you need.
In most cases, keyword search is sufficiently built into the IDE search (usually caused by the keyboard shortcut Ctrl + F). Sometimes a file manager can be useful - for searching in folders that are not part of the software solution - or search engines: for example, OpenGrok and DocFetcher (they will be discussed below). So, ReSharper contains a useful Search by Pattern function, with which you can find, for example, all class properties declared as null-valid enumerations (public TEnum? Enum {get; set;}). Of course, we should not forget about the powerful mechanism of regular expressions; Yes, it is rarely required, but sometimes it helps a lot.
Let's talk a little more about the search engines that work with the source code. The main advantage of search engines is that they allow flexible search. For example, you need to find all the classes in which there are references to Clipboard and Image. The usual tools built into the IDE will give you the opportunity to find either files from the Clipboard or files with Image. Here behind the brackets we leave the notorious regular expression mechanism: it can help, but the search construct will be cumbersome. A more complex example with which the built-in search tools will not cope: the need to find class properties marked with attribute A, but not marked with attribute B. In addition to flexibility, search engines increase search speed. If your IDE needs a couple of times, and sometimes more than one dozen seconds, to run through all the project files, the search engine has an index that allows you to do the same in a split second.
There are various search engines for the source code, you can read their discussion on StackOverflow or read the selection on beyondgrep.com . I use OpenGrok in my work: it is free and knows how to work with various languages, such as C #, C, PHP, SQL and a dozen others. The engine consists of 2 modules: a source indexing module and a web application for searching and navigating through the code. The first module indexes project folders in the file system. The web application runs under Apache, allows you to enter different search queries and view the results. OpenGrok is written in Java, available for download on the official website of the project , and in the relevant articles you can read about how to install the Windows engine and for Linux .
OpenGrok supports various types of search: in the text of the entire document or only in definitions, that is, the names of classes, functions. In addition, it allows you to set filtering of folders and the name of the file you are looking for, choose the language in which the code should be written, etc. This engine shows the results in a descriptive form, grouped by file, and also allows you to go to the desired line in one click file and is able to show the code with highlighting or in the "raw" form.
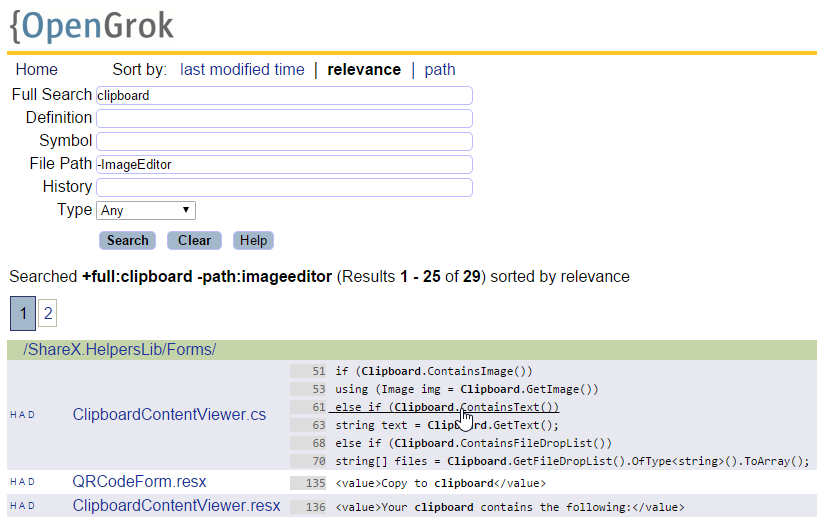
Search query and OpenGrok search results by ShareX
OpenGrok has several limitations: firstly, there is no integration with Visual Studio, secondly, it does not know how to work with Cyrillic (at least, I could not achieve this with the help of settings). If you often have to look for Russian text, then you can use DocFetcher : this tool is not sharpened directly under the search in the source code, but it can index any text files and does an excellent job with the Russian language.
The table below presents a comparison of the capabilities of the OpenGrok and DocFetcher search engines.
Classifier is a systematic list of named objects. The classifier most in demand by programmers, in my opinion, is a list of all classes of software solutions. Examples of other classifiers can be a list of class members ordered by class, a list of files ordered by folders, etc.
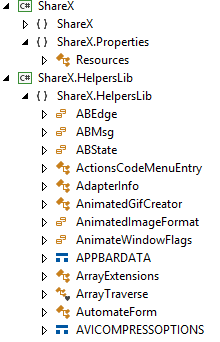
ShareX Application Classes
On the one hand, the classifier can be used as a tool for working with a tree view. You "expand" the base namespace of the software solution, then "expand" the namespace of the desired module, and so on, until you finally reach the desired class. On the other hand, an end-to-end search can be performed inside the classifier. For example, you type * Document *, and the classifier shows all the classes with Document in their names.
If you work with ReSharper, then you probably know about the Go to Everything function, which allows you to switch to any class, method, property or file in the entire software solution. Visual Studio has the following classifiers out of the box: Solution Explorer (classifies assemblies, folders, files, classes and their members), Class View (classifies namespaces, classes and their members), and Object Browser (classifies assemblies, namespaces, classes and their members). Solution Explorer and Class View provide a list of classes within your solution, and the Object Browser, both in your solution and in the third-party assemblies used. OpenGrok allows you to search by definitions (Definition), including using wildcard characters (* Document *). Another classifier is a regular file manager, which displays artifacts arranged in folders.
When should classifiers be used? In order to successfully use a classifier, the programmer must have a good knowledge of the software product. It is particularly important, in particular, to know the naming conventions (for example, * Form is a screen form, and DocumentNameListForm is a list form of documents like DocumentName), as well as the principles by which classes are ordered in folders and namespaces (in Dictionaries, directories, and in Documents - documents). Another possibility of applying the search by classifier is the situation when the exact name of the class or its member is known.
Periodically there is a problem to find a line of code in which some error occurs. Alternatively, the desired line can be found by the known error number. In this case, the error number is the keyword by which the search is carried out (the search by keyword was described above). In another situation, the error stack trace may be known. ReSharper has a handy tool called Stack Traces, which allows you to view the stack and navigate through the methods that were invoked before the error occurred. To use Stack Traces, you need to copy the error stack to the clipboard, and then in Visual Studio press Shift + Ctrl + E.

View ShareX stack and navigate it in Stack Traces
If you do not have information about the error number or the stack trace, you can start the project and turn on the interrupts by mistake. Visual Studio has created a handy add-on Exception Breaker , which allows you to enable or disable an interrupt by mistake with one mouse click.
Sometimes you want to know which method is called when you press a button or another user action. In this case, you can first find the class in which the called method is located (for example, by searching by keywords or by classifier), and then place breakpoints in all members of this class and start the application. In web applications, in some cases Fiddler is useful, in particular, you can see the name of the WCF function called and the values of the parameters passed to it in it.
Before you start searching for the code, it is worth spending a little time to communicate with the team, read the documentation and bust the screen forms. This is necessary in order to collect keywords, find out the names of classes and methods, without which further search will be difficult. It is worth starting with the simplest, while you can find a little more or a little less than is required. You can also search for sources using keywords or classifiers. To search for errors and functions caused by user action, there are special techniques.
Search code is inextricably linked with its understanding. Understanding is necessary in order to select the source blocks from all the found ones that are really useful for solving the problem, in order to understand how to modify and how to use the results obtained in the search.
Outside the code base begins not only the search for code, but also the process of understanding it. Running an application, reading the documentation, bug tracker, application log or version control system, communicating with the team and (or) users give a good idea of what is happening inside the application. Just like when searching for sources, before reading the code directly, it is important to remember what is already known about the area being parsed.
Reading the code as a “black box” implies that, according to some external features, we are trying to establish what is happening inside a function or class. The purpose of the object can be guessed by looking at its name, the parameters taken and the return value. For example,
apparently, it puts the image in the clipboard, and puts information about the errors in the returned ResultOrError.
To read the “black box” it is important to know the naming conventions, that is, the prefixes, postfixes, and other parts of the names adopted in the project. The “black box” includes reading descriptions or comments inside functions.
To make sure that the function’s assumptions are correct, you can study its use. You can also find which user actions lead to a function call (for example, the user clicked the “Copy to clipboard” button) and, based on this knowledge, understand what the user expects to receive as a result of the function (in our case, obviously, copy an object into clipboard).
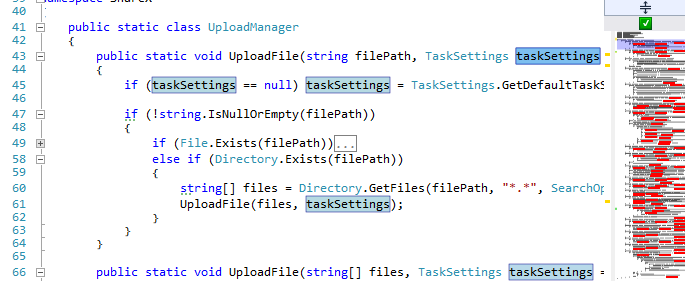
ReSharper offers powerful Inspect This and Find Usages tools that allow you to find the places from which a function is called. Inspect This is more convenient because it allows you to easily and visually perform a further search for code fragments, from which the places where the function is called, are called, and so on. In Visual Studio itself, the Call Hierarchy tool is available out of the box, which has features similar to Inspect This.
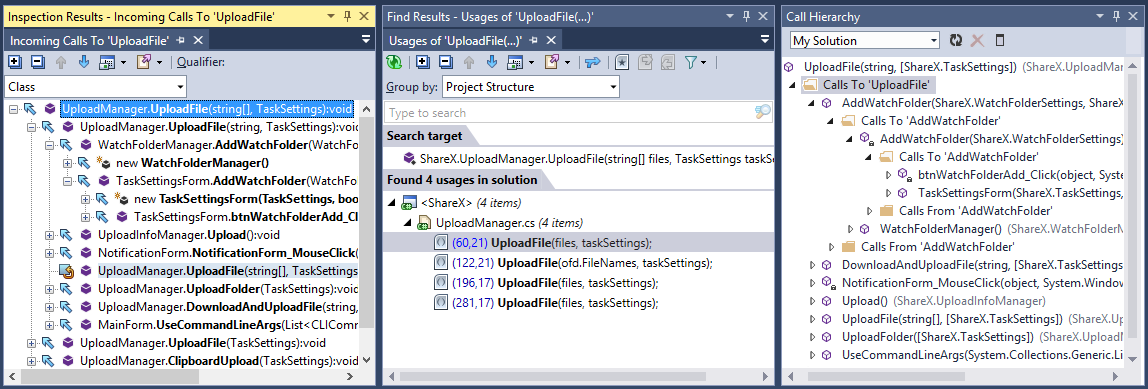
Places that use the function (ShareX.UploadManager.UploadFile: 66-80)
If in the “black box” the code of the method was “closed” for us (we study the sources on the border and around the function), then in the “white box” the code inside the method under study is supposed to be studied.
With the "white box" is important the order of reading the source. On the one hand, in order to understand the code, it is not necessary to read it in its entirety; therefore, it is worth starting with the most important parts of it, skipping less significant lines. On the other hand, the speed of understanding depends on the sequence of reading. Reading from left to right and from top to bottom is not the best way to dive into the sources.
One of the methods of reading the "white box" is reading "in depth": first, read the code of the first level, then go to the second and so on through the levels.
Reading "in depth" (ShareX.UploadManager.UploadFile: 43-64)
For Visual Studio, there is an add-on C # outline that allows you to collapse and expand text within if, for, and other control structures (out of the box. Visual Studio can collapse and expand namespaces, classes, regions, and methods, but not if, for, and similar constructions).
Another way to read the code as a “white box” is to read “from key points”. As a rule, these are places where the function returns or calculates the result, in some way uses the input parameters, makes output to a file, to the screen or another device. Key locations in different functions may vary. It is important to be able to find and read them first.
For Visual Studio, there is the RockMargin add- on , which highlights in the editor and on the scroll bar all the places where there are occurrences of the selected keyword. For example, you double-click on taskSettings, and RockMargin highlights all the places where taskSettings is found in the file:
Highlight RockMargin for ShareX \ UploadManager.cs
In your application, most likely, there are many of the same type, patterned pieces. These can be both commonly used templates (for example, Singleton), and templates specific to your project (for example, some features in the UI construction). You can understand what a template does by two or three keywords, so you should learn to read the templates “entirely”, without “parsing letters”. For example, in the picture below - class-Singleton, which can be guessed by two lines of code that are highlighted in red.
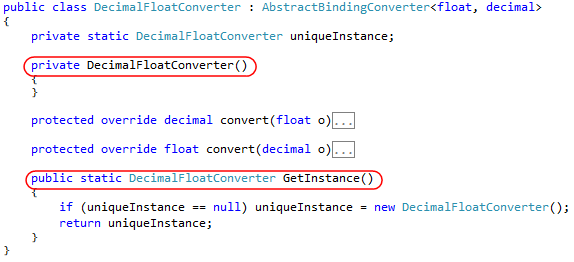
Class-Singleton (Greenshot.Drawing.Fields.Binding.DecimalFloatConverter: 29-52)
Another sequence that should be followed when reading the source, is to read from simple to complex. First, deal with what is clear and true, and then go on to more complex structures.
To conclude the white box section, I would like to say a few words about reading when reviewing code. Before direct reading (especially if there is a lengthy revision to be reviewed), you should review the names of all the changed files, and then understand which files have the key changes. Reading must begin with files with key changes, from which you grasp the general essence and better understand all the other improvements.
To understand the source code, you can not only read it, but also improve it. The easiest way to improve code perception is to indent correctly. Another way to improve readability is refactoring. The simplest renaming and separation of long functions into several short ones make it possible to quickly make the text of the program more understandable.
To understand complex logical constructions, you can use the laws of de Morgan:
As a tool for improving the code can be recommended ReSharper, which copes with improvements of varying degrees of complexity.
Debug mode allows you to check assumptions made while reading the source. Reading in debug mode involves the use of tools such as breakpoints (including breakpoints “by condition”, for example, they work only with a certain value of variables), viewing the stack trace, step-by-step program execution, viewing and modifying the values of variables.
When reading, it is important to maintain a general understanding of what is happening in the module being disassembled, and to be able to move quickly around different places of the puzzle.
To keep the big picture in your head, you can use diagrams, both existing in the project and new ones. Some charts can be built automatically, this is especially true for SQL queries. In PL / SQL Developer, for example, there is a Query Builder that shows which tables participate in a query and how they are related to each other. Automatically, you can build class diagrams, for example, in Visual Studio, the View Class Diagram tool is used for this. However, most often even a hand-drawn scheme is enough.
It is convenient to read called methods using ReSharper, Inspect This or the Call Hierarchy tool built into Visual Studio View. In the section about the “black box” these tools have already been considered, but there they explored the places from which the function is called. Here we are talking about viewing the methods that are called inside the function. Inspect This and View Call Hierarchy provide a complete picture - you see the entire call tree - and allow you to quickly navigate through it.
For quick transitions to arbitrary code blocks, you can pin tabs (to distinguish those 5–10 classes that you work closely with, from the other 20–100 that you had to open during the work), bookmark the editor or write by hand, for example, write out the names of classes and their members.
For quick transitions inside the file, the following will be useful: in ReSharper - File Structure (displays members of the current class), in Visual Studio - Member (similar to File Structure) or RockMargin (displays reduced source code on a wide scroll bar, tints bookmarks and breakpoints).
Before directly reading the source, it is important to refer to various sources outside the code base: communicate with the team, read the documentation, run the application for execution. This will provide some basic understanding of the application that will help in directly reading the code. You can read the source code as a “black box”, analyzing the names of the methods, the parameters taken by them, etc., as a “white box”, making an analysis of what is inside the method. To facilitate the perception of the code, it can be improved, for example, indents. Running the application allows you to check the assumptions made in debug mode. Finally, when reading it is important to keep the big picture in your head and be able to move quickly in different parts of the module under study.
Search and understanding of the code is an important step in the work on the software product. Search and understanding begin outside the repository: from communication with the team, reading documentation, bug tracker, launching the application for execution. Search and understanding are necessary both when finalizing existing modules (to finalize an existing module, you need to understand how it works) and when developing a new functional: yes, a new module can sometimes be developed without reading a single line of code, but in the project, most likely , there are separate blocks that implement similar functionality, which can be taken as a template for implementing functions and classes.
In my opinion, reading the code in the broad sense of the word (that is, both the search for sources and their understanding) should be highlighted by the developer at a separate stage in the work on the task. The result of this stage is a set of bookmarks in methods and files that will be useful when working on a task, as well as a general idea of the work of a certain block of code. Already within the framework of direct programming, the search for source code must continue. For example, like this: met a new class, found the places where it is used, updated the list of useful bookmarks. Perhaps the selection of bookmarks can be distinguished by a separate function in the team: a technical leader or a responsible developer compiles a list of useful bookmarks, after which the programmer takes the task into operation.
Both for searching and for understanding the source code, it is important to know the naming conventions and how classes are organized (by folder, namespace). According to the author’s experience, such an understanding is acquired in the course of work in a project, but agreements can be formalized and communicated to new developers in the same way as agreements on the design of a code (Code Style Guide).
The development of automated tools that reveal the actual naming conventions and methods for organizing classes is promising. As it seems, tools that identify the most common folder names, suffixes, postfixes, etc. will be helpful.
When reading the code, as with reading a regular book, it is important to realize and keep in mind the purpose of reading. To read the code, you can use some techniques from articles on how to read plain text (see, for example: "How to improve your ability to understand the read text?" ).
As far as can be assessed, the search and understanding of the code is a topic that is poorly touched upon in domestic and foreign literature. I hope that the article presented was useful in mastering techniques for working effectively with the code base.
Petya is an experienced programmer. After receiving the statement, he is looking for whether there is any source code that solved a similar problem. Petya spends a couple of days reading materials and sorting out other modules, and on the third he launches his solution based on the already existing code. It has a couple of minor bugs that can be quickly fixed. Hooray! Everything works as it should, on the third day.
How to find the piece of source code you need? How to understand it? And most importantly - why do all this? In the search for answers to these questions, welcome under cat.
Why is it important to be able to search and read the code?
D. Thomas and D. Spinellis in the book "Analysis of the program code on the example of Open Source projects" formulate several important theses.
')
Reading the code is a programmer's daily routine.
From the outside it seems that the main work of the programmer is to write the source code, but it is not. Most often, the code has to read, not write. Yesterday your friend wrote a module, and today you are faced with the task of improving it or correcting an error, which is impossible without a preliminary study of the work of your friend.
90% of errors can be eliminated when reading the code.
With the figure of 90%, it seems to me, it is possible to argue, but the basic idea is clear: when reading (in this case, reviewing) a program, you can (and should) identify and eliminate errors.
We are often taught to write code, but rarely - to read it.
And in vain, because without reading the existing source you have to constantly reinvent the wheel. Even if you can write something from scratch, it is much more effective to look around and use someone else's source code directly or as an analogy. Someone else's code has been tested, debugged and, most likely, already contains some “features” that will be useful in solving your problem.
So read the code to not write bicycles. Read the code to make changes faster. Read the code so that there are fewer errors in the programs.
What is this article about?
The main goal of the article is to systematize the existing approaches to searching and reading code. Knowledge of specific approaches makes it possible to apply those that are most appropriate in a particular case. In addition, the article provides an overview of the tools that will effectively apply the approaches described in the article. It is worth noting that you can search and understand the source code without special tools, but their use makes the process more visual and less routine.
I will talk about the most universal concepts: in other words, these concepts are applicable to all or almost all programming languages. Some tools that make it easier to find and read the source are also universal, but most are only relevant for Visual Studio and .NET. Nevertheless, the fact that most of the tools are used exclusively in VS does not mean that there are no similar tools for other IDEs: I am sure that they exist, since the approaches presented in the article are universal. I also make a reservation that all the tools described are free, the exception is only ReSharper.
The code examples in the article are taken from the ShareX and Greenshot applications (both distributed under the GNU GPL license ) from the ShareX repository as of June 30, 2015. I thank the authors of these applications for the opportunity to use their code base. I also thank my colleagues, especially Denis Gavrilov and Vladislav Iof, for their comments during the work on this article.
Code search
Code search is a process that results in parts of the source code related to the subject of the problem being solved.
Search outside code
You can start looking for source codes outside the codebase. Pre-communication with the team, reading the documentation and bug tracker can greatly simplify the direct search code. You can learn more about working with artifacts from D. Gavrilov 's seminar “Teamwork Practices: The Use of Written Artifacts” . In addition to reading the documentation and communicating with the team, it is useful to remember that you already know what is to be found. For example, if you have to find a screen form, then it is worth remembering that the name of screen forms in your project usually ends with a Form, and all forms are in the collection “UI”.
You can run the application for execution and search the screen form. When iterating, the programmer opens in a random (or not so) order of the form until he finds a window, button, menu item, or any other interface element that appears to use the desired functionality. Brute force is used when the search task is blurred or the programmer is not familiar with the system. For example, you have never worked with an application, and you are required to add a function that would export all open pictures to the clipboard. It seems logical to start exploring the application: see if it can export images to the clipboard one by one, are there any settings related to the buffer or export, etc.
Keyword Search
A keyword is a word or phrase from the text of a document or query that carries a significant semantic meaning from the point of view of information retrieval. The selection of keywords required for the search is formed through communication with users, screening through screen forms and other methods described above as an “out of code” search. Keywords can be taken from the task description, screen forms and user actions, the text of the error or message, the SQL query, that is, from any artifacts associated with the problem being solved.
To make keyword searches as effective as possible, you need to select rare keywords. For example, if you are working on a project in which there are many different documents (Document), then a search for the word Document will give a lot of unnecessary results. However, there are situations when it is not possible to select rare keywords. In this case, you first need to find a lot of potentially useful information, and then narrow down the search. For example, find all existing references to the Document, and then exclude tests from the results, search for additional keywords in the files found, etc. In general, you should strive to find at least something (a little more or a little less), and not exactly what do you need.
In most cases, keyword search is sufficiently built into the IDE search (usually caused by the keyboard shortcut Ctrl + F). Sometimes a file manager can be useful - for searching in folders that are not part of the software solution - or search engines: for example, OpenGrok and DocFetcher (they will be discussed below). So, ReSharper contains a useful Search by Pattern function, with which you can find, for example, all class properties declared as null-valid enumerations (public TEnum? Enum {get; set;}). Of course, we should not forget about the powerful mechanism of regular expressions; Yes, it is rarely required, but sometimes it helps a lot.
Let's talk a little more about the search engines that work with the source code. The main advantage of search engines is that they allow flexible search. For example, you need to find all the classes in which there are references to Clipboard and Image. The usual tools built into the IDE will give you the opportunity to find either files from the Clipboard or files with Image. Here behind the brackets we leave the notorious regular expression mechanism: it can help, but the search construct will be cumbersome. A more complex example with which the built-in search tools will not cope: the need to find class properties marked with attribute A, but not marked with attribute B. In addition to flexibility, search engines increase search speed. If your IDE needs a couple of times, and sometimes more than one dozen seconds, to run through all the project files, the search engine has an index that allows you to do the same in a split second.
There are various search engines for the source code, you can read their discussion on StackOverflow or read the selection on beyondgrep.com . I use OpenGrok in my work: it is free and knows how to work with various languages, such as C #, C, PHP, SQL and a dozen others. The engine consists of 2 modules: a source indexing module and a web application for searching and navigating through the code. The first module indexes project folders in the file system. The web application runs under Apache, allows you to enter different search queries and view the results. OpenGrok is written in Java, available for download on the official website of the project , and in the relevant articles you can read about how to install the Windows engine and for Linux .
OpenGrok supports various types of search: in the text of the entire document or only in definitions, that is, the names of classes, functions. In addition, it allows you to set filtering of folders and the name of the file you are looking for, choose the language in which the code should be written, etc. This engine shows the results in a descriptive form, grouped by file, and also allows you to go to the desired line in one click file and is able to show the code with highlighting or in the "raw" form.
Search query and OpenGrok search results by ShareX
OpenGrok has several limitations: firstly, there is no integration with Visual Studio, secondly, it does not know how to work with Cyrillic (at least, I could not achieve this with the help of settings). If you often have to look for Russian text, then you can use DocFetcher : this tool is not sharpened directly under the search in the source code, but it can index any text files and does an excellent job with the Russian language.
The table below presents a comparison of the capabilities of the OpenGrok and DocFetcher search engines.
Comparison of search engines
Using this table, you can select for yourself the necessary search parameters and select the most appropriate tool.
| Parameter | Opengrok | Docfetcher |
|---|---|---|
| Search flexibility (through search language support) | Yes | Yes |
| Search speed (through indexing) | Yes | Yes |
| Special Code Finder Tools | Yes | Not |
| Work with Cyrillic | Not | Yes |
| Integration with Visual Studio | Not | Not |
| Multiplatform | Yes | Yes |
| License | CDDL | Eclipse Public License |
Search by classifiers
Classifier is a systematic list of named objects. The classifier most in demand by programmers, in my opinion, is a list of all classes of software solutions. Examples of other classifiers can be a list of class members ordered by class, a list of files ordered by folders, etc.
ShareX Application Classes
On the one hand, the classifier can be used as a tool for working with a tree view. You "expand" the base namespace of the software solution, then "expand" the namespace of the desired module, and so on, until you finally reach the desired class. On the other hand, an end-to-end search can be performed inside the classifier. For example, you type * Document *, and the classifier shows all the classes with Document in their names.
If you work with ReSharper, then you probably know about the Go to Everything function, which allows you to switch to any class, method, property or file in the entire software solution. Visual Studio has the following classifiers out of the box: Solution Explorer (classifies assemblies, folders, files, classes and their members), Class View (classifies namespaces, classes and their members), and Object Browser (classifies assemblies, namespaces, classes and their members). Solution Explorer and Class View provide a list of classes within your solution, and the Object Browser, both in your solution and in the third-party assemblies used. OpenGrok allows you to search by definitions (Definition), including using wildcard characters (* Document *). Another classifier is a regular file manager, which displays artifacts arranged in folders.
When should classifiers be used? In order to successfully use a classifier, the programmer must have a good knowledge of the software product. It is particularly important, in particular, to know the naming conventions (for example, * Form is a screen form, and DocumentNameListForm is a list form of documents like DocumentName), as well as the principles by which classes are ordered in folders and namespaces (in Dictionaries, directories, and in Documents - documents). Another possibility of applying the search by classifier is the situation when the exact name of the class or its member is known.
Error search
Periodically there is a problem to find a line of code in which some error occurs. Alternatively, the desired line can be found by the known error number. In this case, the error number is the keyword by which the search is carried out (the search by keyword was described above). In another situation, the error stack trace may be known. ReSharper has a handy tool called Stack Traces, which allows you to view the stack and navigate through the methods that were invoked before the error occurred. To use Stack Traces, you need to copy the error stack to the clipboard, and then in Visual Studio press Shift + Ctrl + E.
View ShareX stack and navigate it in Stack Traces
If you do not have information about the error number or the stack trace, you can start the project and turn on the interrupts by mistake. Visual Studio has created a handy add-on Exception Breaker , which allows you to enable or disable an interrupt by mistake with one mouse click.
By user action
Sometimes you want to know which method is called when you press a button or another user action. In this case, you can first find the class in which the called method is located (for example, by searching by keywords or by classifier), and then place breakpoints in all members of this class and start the application. In web applications, in some cases Fiddler is useful, in particular, you can see the name of the WCF function called and the values of the parameters passed to it in it.
Results
Before you start searching for the code, it is worth spending a little time to communicate with the team, read the documentation and bust the screen forms. This is necessary in order to collect keywords, find out the names of classes and methods, without which further search will be difficult. It is worth starting with the simplest, while you can find a little more or a little less than is required. You can also search for sources using keywords or classifiers. To search for errors and functions caused by user action, there are special techniques.
The following table shows the code search methods discussed above.
| Method | Description | Instruments |
|---|---|---|
| Search outside code | Preliminary preparation to direct code search, especially when the search task is blurred or bad programmer with system |
|
| Keyword Search | Search for code in which they are found specified keywords |
|
| Search by classifiers | Search for classes or other objects sorted by category (for example, by namespace), especially when the programmer is good familiar with the application or known the exact name of the class or its member |
|
| Error search | Search for a line of code in which an error occurs |
|
| Search by user action | Finding the method that is being called by user action |
|
Code understanding
Search code is inextricably linked with its understanding. Understanding is necessary in order to select the source blocks from all the found ones that are really useful for solving the problem, in order to understand how to modify and how to use the results obtained in the search.
Understanding without reading the code
Outside the code base begins not only the search for code, but also the process of understanding it. Running an application, reading the documentation, bug tracker, application log or version control system, communicating with the team and (or) users give a good idea of what is happening inside the application. Just like when searching for sources, before reading the code directly, it is important to remember what is already known about the area being parsed.
Reading the "black box"
Reading the code as a “black box” implies that, according to some external features, we are trying to establish what is happening inside a function or class. The purpose of the object can be guessed by looking at its name, the parameters taken and the return value. For example,
public ResultOrError SetToClipboard(Image image) apparently, it puts the image in the clipboard, and puts information about the errors in the returned ResultOrError.
To read the “black box” it is important to know the naming conventions, that is, the prefixes, postfixes, and other parts of the names adopted in the project. The “black box” includes reading descriptions or comments inside functions.
To make sure that the function’s assumptions are correct, you can study its use. You can also find which user actions lead to a function call (for example, the user clicked the “Copy to clipboard” button) and, based on this knowledge, understand what the user expects to receive as a result of the function (in our case, obviously, copy an object into clipboard).
ReSharper offers powerful Inspect This and Find Usages tools that allow you to find the places from which a function is called. Inspect This is more convenient because it allows you to easily and visually perform a further search for code fragments, from which the places where the function is called, are called, and so on. In Visual Studio itself, the Call Hierarchy tool is available out of the box, which has features similar to Inspect This.
Places that use the function (ShareX.UploadManager.UploadFile: 66-80)
- Inspect This (left);
- Find Usages (in the center);
- Call Hierarchy (right).
Reading the "white box"
If in the “black box” the code of the method was “closed” for us (we study the sources on the border and around the function), then in the “white box” the code inside the method under study is supposed to be studied.
With the "white box" is important the order of reading the source. On the one hand, in order to understand the code, it is not necessary to read it in its entirety; therefore, it is worth starting with the most important parts of it, skipping less significant lines. On the other hand, the speed of understanding depends on the sequence of reading. Reading from left to right and from top to bottom is not the best way to dive into the sources.
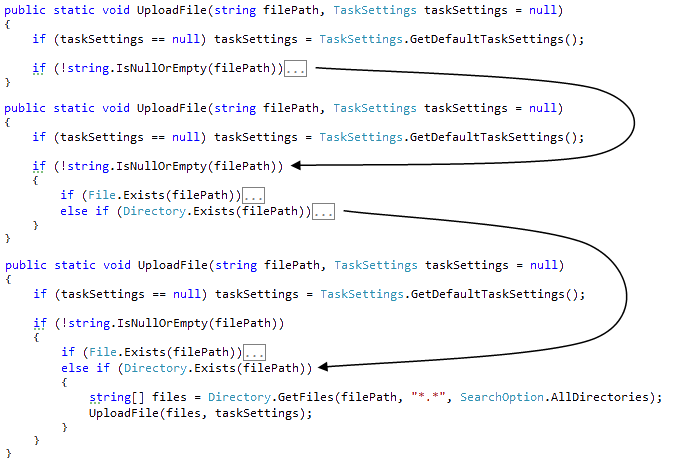
One of the methods of reading the "white box" is reading "in depth": first, read the code of the first level, then go to the second and so on through the levels.
Reading "in depth" (ShareX.UploadManager.UploadFile: 43-64)
For Visual Studio, there is an add-on C # outline that allows you to collapse and expand text within if, for, and other control structures (out of the box. Visual Studio can collapse and expand namespaces, classes, regions, and methods, but not if, for, and similar constructions).
Another way to read the code as a “white box” is to read “from key points”. As a rule, these are places where the function returns or calculates the result, in some way uses the input parameters, makes output to a file, to the screen or another device. Key locations in different functions may vary. It is important to be able to find and read them first.
For Visual Studio, there is the RockMargin add- on , which highlights in the editor and on the scroll bar all the places where there are occurrences of the selected keyword. For example, you double-click on taskSettings, and RockMargin highlights all the places where taskSettings is found in the file:
Highlight RockMargin for ShareX \ UploadManager.cs
In your application, most likely, there are many of the same type, patterned pieces. These can be both commonly used templates (for example, Singleton), and templates specific to your project (for example, some features in the UI construction). You can understand what a template does by two or three keywords, so you should learn to read the templates “entirely”, without “parsing letters”. For example, in the picture below - class-Singleton, which can be guessed by two lines of code that are highlighted in red.
Class-Singleton (Greenshot.Drawing.Fields.Binding.DecimalFloatConverter: 29-52)
Another sequence that should be followed when reading the source, is to read from simple to complex. First, deal with what is clear and true, and then go on to more complex structures.
To conclude the white box section, I would like to say a few words about reading when reviewing code. Before direct reading (especially if there is a lengthy revision to be reviewed), you should review the names of all the changed files, and then understand which files have the key changes. Reading must begin with files with key changes, from which you grasp the general essence and better understand all the other improvements.
Code enhancement
To understand the source code, you can not only read it, but also improve it. The easiest way to improve code perception is to indent correctly. Another way to improve readability is refactoring. The simplest renaming and separation of long functions into several short ones make it possible to quickly make the text of the program more understandable.
To understand complex logical constructions, you can use the laws of de Morgan:
!(a && b) = (!a) || (!b) !(a || b) = (!a) && (!b) As a tool for improving the code can be recommended ReSharper, which copes with improvements of varying degrees of complexity.
Debug mode
Debug mode allows you to check assumptions made while reading the source. Reading in debug mode involves the use of tools such as breakpoints (including breakpoints “by condition”, for example, they work only with a certain value of variables), viewing the stack trace, step-by-step program execution, viewing and modifying the values of variables.
Overall picture
When reading, it is important to maintain a general understanding of what is happening in the module being disassembled, and to be able to move quickly around different places of the puzzle.
To keep the big picture in your head, you can use diagrams, both existing in the project and new ones. Some charts can be built automatically, this is especially true for SQL queries. In PL / SQL Developer, for example, there is a Query Builder that shows which tables participate in a query and how they are related to each other. Automatically, you can build class diagrams, for example, in Visual Studio, the View Class Diagram tool is used for this. However, most often even a hand-drawn scheme is enough.
It is convenient to read called methods using ReSharper, Inspect This or the Call Hierarchy tool built into Visual Studio View. In the section about the “black box” these tools have already been considered, but there they explored the places from which the function is called. Here we are talking about viewing the methods that are called inside the function. Inspect This and View Call Hierarchy provide a complete picture - you see the entire call tree - and allow you to quickly navigate through it.
For quick transitions to arbitrary code blocks, you can pin tabs (to distinguish those 5–10 classes that you work closely with, from the other 20–100 that you had to open during the work), bookmark the editor or write by hand, for example, write out the names of classes and their members.
For quick transitions inside the file, the following will be useful: in ReSharper - File Structure (displays members of the current class), in Visual Studio - Member (similar to File Structure) or RockMargin (displays reduced source code on a wide scroll bar, tints bookmarks and breakpoints).
Results
Before directly reading the source, it is important to refer to various sources outside the code base: communicate with the team, read the documentation, run the application for execution. This will provide some basic understanding of the application that will help in directly reading the code. You can read the source code as a “black box”, analyzing the names of the methods, the parameters taken by them, etc., as a “white box”, making an analysis of what is inside the method. To facilitate the perception of the code, it can be improved, for example, indents. Running the application allows you to check the assumptions made in debug mode. Finally, when reading it is important to keep the big picture in your head and be able to move quickly in different parts of the module under study.
The following table shows the code understanding methods discussed above.
| Method | Description | Instruments |
|---|---|---|
| Understanding without reading the code | Getting a general idea about the module without viewing the source |
|
| Reading the "black box" | Understanding what's inside function or class for some external signs (name taken parameters return value etc.) |
|
| Reading the "white box" | Examine the code inside the test method | |
| Code enhancement | Improved code readability |
|
| Debug mode | Run application in debug mode |
|
| Overall picture | Hold overall performance about what happens in the parsed module; fast moving different places code |
|
Conclusion
Search and understanding of the code is an important step in the work on the software product. Search and understanding begin outside the repository: from communication with the team, reading documentation, bug tracker, launching the application for execution. Search and understanding are necessary both when finalizing existing modules (to finalize an existing module, you need to understand how it works) and when developing a new functional: yes, a new module can sometimes be developed without reading a single line of code, but in the project, most likely , there are separate blocks that implement similar functionality, which can be taken as a template for implementing functions and classes.
In my opinion, reading the code in the broad sense of the word (that is, both the search for sources and their understanding) should be highlighted by the developer at a separate stage in the work on the task. The result of this stage is a set of bookmarks in methods and files that will be useful when working on a task, as well as a general idea of the work of a certain block of code. Already within the framework of direct programming, the search for source code must continue. For example, like this: met a new class, found the places where it is used, updated the list of useful bookmarks. Perhaps the selection of bookmarks can be distinguished by a separate function in the team: a technical leader or a responsible developer compiles a list of useful bookmarks, after which the programmer takes the task into operation.
Both for searching and for understanding the source code, it is important to know the naming conventions and how classes are organized (by folder, namespace). According to the author’s experience, such an understanding is acquired in the course of work in a project, but agreements can be formalized and communicated to new developers in the same way as agreements on the design of a code (Code Style Guide).
The development of automated tools that reveal the actual naming conventions and methods for organizing classes is promising. As it seems, tools that identify the most common folder names, suffixes, postfixes, etc. will be helpful.
When reading the code, as with reading a regular book, it is important to realize and keep in mind the purpose of reading. To read the code, you can use some techniques from articles on how to read plain text (see, for example: "How to improve your ability to understand the read text?" ).
As far as can be assessed, the search and understanding of the code is a topic that is poorly touched upon in domestic and foreign literature. I hope that the article presented was useful in mastering techniques for working effectively with the code base.
Links
Instruments
To search for code
- Opengrok
- Docfetcher
- Feeddler
- ReSharper
- Go to Everything
- Stack traces
- Search by Pattern
- Visual studio
- Built-in search (Ctrl + F)
- Solution Explorer
- Class view
- Object Browser
- Breakpoints
- Add-ons for Visual Studio
- File manager
- Brute force screen forms
To understand the code
- ReSharper
- Inspect this
- Find Usages
- File structure
- Refactoring tools
- Visual studio
- Call hierarchy
- View Class Diagram
- Member
- Debugging Tools
- Add-ons for Visual Studio
- Application launch
General methods
- Communication with the team or users
- Reading documentation and bug tracker
Source: https://habr.com/ru/post/267923/
All Articles