Disk performance of HP ProLiant DL360 servers from Gen5 to Gen8. Everything you didn't know and were afraid to ask
We are constantly confronted with a typical task of deploying an office server for various companies. Most often, the client wants to buy a server on which office mail will work, for example, postfix + * SQL, ejabberd with the same * SQL, samba, and also * SQL under 1C. In this case, there is a need to study the performance of disk arrays in relation to the servers of the “working group” of the same model, but of different generations. Since our company is more specialized in Hewlett-Packard products, 1U HP ProLiant 360 servers of the 5th, 6th, 7th and 8th generations were analyzed :
In all controller configurations we use a 256Mb cache. It is worth noting the difference in the bandwidth of the PCI Express bus, through which the controllers are connected: P400i and P410i - 2GBps (gigabytes per second), P420 - 8 GBps (gigabytes per second).
')
The first question that logically arises in this case is: in which parrots to measure performance? After studying the article of the respected amarao , we found that such measurements should be carried out at least by two parameters: IOPS - the number of disk Input / Output operations per second: the more, the better, and Latency - the processing time of the operation: the less, the better.
It was decided to make a comparison of the performance of different configurations in relation to different typical tasks , since these tasks imply different variants of the load on the disk subsystem. The nature of the load is determined by the following parameters: block size, read-write ratio, random / sequential access.
Sequential data access is typical for recording various logs, when broadcasting and recording audio / video and the like. The bottom line is that access is characterized by a localized area of the disk, without having to jump all over the surface.
Random access is most typical for databases, web and file servers: a large number of requests to sectors scattered across the disk.
Combined combines both of the above scenarios, for example, the functioning of the database with the recording of logs on the same array.
We test directly the raw-device (direct access, without regard to the file system), in order to avoid the influence of the features of the implementation of file systems and everything connected with it on different platforms.
For this task, rules for fio and IOMetter were written.
IOmetter configuration file
Obviously, for testing under Windows, installation of this OS is necessary, and this is at least one more busy port and time devoted to installation on each server. That is why we chose Linux for work. The point here is not even in individual preferences, but in the presence of developed process automation tools out of the box, which allow, for example, to start testing immediately after loading the OS, and at the end of the tests, send the results via ssh, ftp or email.
It was decided to build a small Live-USB image based on Debian with all the necessary utilities. Those who want to rebuild it for their needs can download the archive . The build will require Debian (most likely, Ubuntu will do as well), multistrap, isolinux, squashfs-tools, and xorriso. After making changes and installing the necessary packages from chroot, execute the build.sh script.
The only user in the system is root, the password is not set. When loading, a hostname is generated based on uuid, and when logged in, a brief summary of the system is issued. To start testing, you need to run the run.sh script in the fio directory, passing as an argument the full name of the device file you want to test, for example, ./run.sh / dev / cciss / c0d0.
ATTENTION! This should be done solely on an empty array, otherwise you will lose data!
However, in one of the cases we conducted testing under Windows using IOMetter to compare the obtained results with fio.

Thus, we managed to study the performance of various arrays on our servers by 12 typical load profiles, expressed in 3 groups, formed according to the type of access.
As you know, the cache is an intermediate buffer of fast access to information that is most likely to be requested. As a result, access to data is faster, bypassing the selection of data from a remote source.
Consider the impact of having a hardware cache card on the example of a raid10 configuration built on four 6Gbps disks.


As you can see, when the cache card is installed, the performance increases to approximately 40% on both sequential and random access operations. Also on the histograms clearly shows that when you turn on the cache, the reaction time (latency) is enormously (up to several orders of magnitude) reduced.
It should be noted that the use of the cache controller (P400i) of the fifth generation server, to put it mildly, is irrational.
The server controller of the eighth generation, on the contrary, forcibly uses the cache, ignoring the shutdown command.
Recall that the parameter “Gbps” (gigabyte bits per second) is the maximum data transfer rate between the disk and the controller, that is, 3000Mbps and 6000Mbps. If necessary, we divide into bytes by 10: 300MBps and 600MBps, respectively. Theoretically, with more than six 3G and more than three 6G disks, the speed of the tire would be a bottleneck. Actually, let's try to estimate the width of this very neck. It should be remembered that the hard disk is a mechanical system and the specified data transfer rate is the limit, that is, in fact, fully unattainable. Recall also that the P420i controller of the eighth generation server is connected via PCIe 3.0 (8GBps).
We carry out comparison on raid10 with the included cache.


When using 3Gbps and 6Gbps disks with 10K revolutions on this configuration, there is no fundamental difference in IOPS or Latency. But the increase in performance when using 6Gbps 15K is very significant and is best seen in random access operations. Conclusion: the number of revolutions does matter.
On the issue of PCIe 2.0 and 3.0: on the example of the configuration of the Gen6, Gen7 and Gen8 servers with 6Gbps disks, the difference in IOPS is a maximum of 10%, according to Latency and not at all more than 2%. Conclusion: The PCIe 2.0 bottleneck is wide enough for a configuration of four 6Gbps (600MBps) disks.
It is curious that the seventh generation server on the 3G 10Krpm configuration gave worse performance than Gen 6 on the same disks. What is the reason for this, in this case, is difficult to say and, probably, will be revealed during complex testing of servers.
The use of the fifth generation 6Gbps 15K disks in the server gave a certain increase in speed, mainly due to a greater number of revolutions per second. The difference between 6G and 3G ten-thousand, as expected, is almost absent.
In principle, everything can be seen above, but still illustrate with the example of raid10, built on four 6Gbps disks.


As can be seen on the graphs, the difference is not significant, especially between the DL360Gen6, DL360Gen7 and DL360Gen8 servers. In the typical load (workstation profile) there is a slight difference with the DL360Gen5. The old P400i controller in the DL360G5 server was very disappointing only on sequential access operations, both in terms of IOPS number and response time (latency), which is not surprising.
Those who want to get acquainted with the detailed test results (raid5 and raid10 configurations on three, four and eight disks) can download the csv file
The difference between the G8 (P420i) and G6 / G7 (with the same P410i controller) is no more than 10% for all types of tasks. This leads to the conclusion that if one proceeds solely from the ratio “disk system performance / cost”, G6 or G7 would be a more profitable acquisition. We will conduct a comprehensive comparison of the performance of these servers in one of the following articles.
Gen5 lags behind somewhat: we recall that its P400i controller communicates with disks at 3Gbps speed. It can be seen that the lag is not so great in random access operations. With the increasing number of sequential access operations, the difference grows. In principle, it can be compensated by increasing the number of disks in the array. Thus, this server can be recommended as a budget solution for a small company of 10-15 people.
And now we will try to answer the question: how much will I need IOPS for such and such a task? The simple answer: the more the better. With latency, respectively, the opposite.
First of all, it is worth figuring out what kind of load is foreseen (what exactly will work on the server) and try to relate to the above results, simulating the "ceiling" for a particular configuration.
Best of all is to see what load your applications give. In Linux, this can be done using the iostat program, which is part of the sysstat package, which shows the current state of the disk subsystem.

r / s and w / s - IOPS read and write
r / await and w / await are latency respectively.
util - server load level. In our tests, the value ranges from 80% to 100%.
In the case of Windows, measurements can be made with the perfmon utility.
If the peaks of the load, the values that are close to our results will be many and the util parameter will fluctuate around 80-100% for a long time - this is a good reason to think about optimizing the disk system.
Returning to the question of choosing a configuration for the needs of a small company: a file server, * SQL and services tied to it, we would recommend to consider a server not lower than Gen 6 with a P410i controller with an array of level 10 (minimum 4 disks) for reasons of a combination of speed and reliability ( raid10 has a much shorter array rebuilding time in case of disk failure) on 6Gbps 15Krpm media. Note that saving on the cache card is highly discouraged.
In general, for us, the test results were unexpected. The difference in the performance of disk subsystems was expected to be much greater, especially in the case of Gen8 with its PCIe 3.0 controller, compared to the sixth and seventh generation servers. There is marketing, but there is almost no difference - it's funny.
Test servers
HP Proliant DL360 Gen5 with P400i Controller
HP Proliant DL360 Gen6 with P410i Controller
HP Proliant DL360 Gen7 with P410i Controller
HP Proliant DL360p Gen8 with P420i Controller
HP Proliant DL360 Gen6 with P410i Controller
HP Proliant DL360 Gen7 with P410i Controller
HP Proliant DL360p Gen8 with P420i Controller
In all controller configurations we use a 256Mb cache. It is worth noting the difference in the bandwidth of the PCI Express bus, through which the controllers are connected: P400i and P410i - 2GBps (gigabytes per second), P420 - 8 GBps (gigabytes per second).
')
For testing, we use the following hard drives:
The first question that logically arises in this case is: in which parrots to measure performance? After studying the article of the respected amarao , we found that such measurements should be carried out at least by two parameters: IOPS - the number of disk Input / Output operations per second: the more, the better, and Latency - the processing time of the operation: the less, the better.
It was decided to make a comparison of the performance of different configurations in relation to different typical tasks , since these tasks imply different variants of the load on the disk subsystem. The nature of the load is determined by the following parameters: block size, read-write ratio, random / sequential access.
Sequential data access is typical for recording various logs, when broadcasting and recording audio / video and the like. The bottom line is that access is characterized by a localized area of the disk, without having to jump all over the surface.
Random access is most typical for databases, web and file servers: a large number of requests to sectors scattered across the disk.
Combined combines both of the above scenarios, for example, the functioning of the database with the recording of logs on the same array.
We test directly the raw-device (direct access, without regard to the file system), in order to avoid the influence of the features of the implementation of file systems and everything connected with it on different platforms.
For this task, rules for fio and IOMetter were written.
IOmetter configuration file
fio / profiles.cfg
[web-file-server4k] blocksize=4k rwmixread=95 rwmixwrite=5 rw=randrw percentage_random=75 ioengine=libaio direct=1 buffered=0 time_based runtime=300 [web-file-server8k] blocksize=8k rwmixread=95 rwmixwrite=5 rw=randrw percentage_random=75 ioengine=libaio direct=1 buffered=0 time_based runtime=300 [web-file-server64k] blocksize=64k rwmixread=95 rwmixwrite=5 rw=randrw percentage_random=75 ioengine=libaio direct=1 buffered=0 time_based runtime=300 [decision-support-system-db] blocksize=1024k rwmixread=100 rwmixwrite=0 rw=randrw percentage_random=100 ioengine=libaio direct=1 buffered=0 time_based runtime=300 [media-streaming] blocksize=64k rwmixread=98 rwmixwrite=2 rw=randrw percentage_random=0 ioengine=libaio direct=1 buffered=0 time_based runtime=300 [sql-server-log] blocksize=64k rwmixread=0 rwmixwrite=100 rw=randrw percentage_random=0 ioengine=libaio direct=1 buffered=0 time_based runtime=300 [os-paging] blocksize=64k rwmixread=90 rwmixwrite=10 rw=randrw percentage_random=0 ioengine=libaio direct=1 buffered=0 time_based runtime=300 [web-server-log] blocksize=8k rwmixread=0 rwmixwrite=100 rw=randrw percentage_random=0 ioengine=libaio direct=1 buffered=0 time_based runtime=300 [oltp-db] blocksize=8k rwmixread=70 rwmixwrite=30 rw=randrw percentage_random=100 ioengine=libaio direct=1 buffered=0 time_based runtime=300 [exchange-server] blocksize=8k rwmixread=67 rwmixwrite=33 rw=randrw percentage_random=100 ioengine=libaio direct=1 buffered=0 time_based runtime=300 [workstation] blocksize=8k rwmixread=80 rwmixwrite=20 rw=randrw percentage_random=80 ioengine=libaio direct=1 buffered=0 time_based runtime=300 [video-on-demand] blocksize=512k rwmixread=80 rwmixwrite=20 rw=randrw percentage_random=100 ioengine=libaio direct=1 buffered=0 time_based runtime=300 Obviously, for testing under Windows, installation of this OS is necessary, and this is at least one more busy port and time devoted to installation on each server. That is why we chose Linux for work. The point here is not even in individual preferences, but in the presence of developed process automation tools out of the box, which allow, for example, to start testing immediately after loading the OS, and at the end of the tests, send the results via ssh, ftp or email.
It was decided to build a small Live-USB image based on Debian with all the necessary utilities. Those who want to rebuild it for their needs can download the archive . The build will require Debian (most likely, Ubuntu will do as well), multistrap, isolinux, squashfs-tools, and xorriso. After making changes and installing the necessary packages from chroot, execute the build.sh script.
The only user in the system is root, the password is not set. When loading, a hostname is generated based on uuid, and when logged in, a brief summary of the system is issued. To start testing, you need to run the run.sh script in the fio directory, passing as an argument the full name of the device file you want to test, for example, ./run.sh / dev / cciss / c0d0.
ATTENTION! This should be done solely on an empty array, otherwise you will lose data!
However, in one of the cases we conducted testing under Windows using IOMetter to compare the obtained results with fio.
Thus, we managed to study the performance of various arrays on our servers by 12 typical load profiles, expressed in 3 groups, formed according to the type of access.
Hardware cache effect
As you know, the cache is an intermediate buffer of fast access to information that is most likely to be requested. As a result, access to data is faster, bypassing the selection of data from a remote source.
Consider the impact of having a hardware cache card on the example of a raid10 configuration built on four 6Gbps disks.
Sequential access operations
Media Streaming: block size 64KB, 98% / 2% read / write, 100% sequential access
Random access operations
OLTP DB: block size 8KB, 70% / 30% read / write, 100% random access
Combined access operations
Workstation: block size 8KB, 80% / 20% read / write, 80% / 20% random access / sequential access
As you can see, when the cache card is installed, the performance increases to approximately 40% on both sequential and random access operations. Also on the histograms clearly shows that when you turn on the cache, the reaction time (latency) is enormously (up to several orders of magnitude) reduced.
It should be noted that the use of the cache controller (P400i) of the fifth generation server, to put it mildly, is irrational.
The server controller of the eighth generation, on the contrary, forcibly uses the cache, ignoring the shutdown command.
The difference between 3Gbps and 6Gbps drives
Recall that the parameter “Gbps” (gigabyte bits per second) is the maximum data transfer rate between the disk and the controller, that is, 3000Mbps and 6000Mbps. If necessary, we divide into bytes by 10: 300MBps and 600MBps, respectively. Theoretically, with more than six 3G and more than three 6G disks, the speed of the tire would be a bottleneck. Actually, let's try to estimate the width of this very neck. It should be remembered that the hard disk is a mechanical system and the specified data transfer rate is the limit, that is, in fact, fully unattainable. Recall also that the P420i controller of the eighth generation server is connected via PCIe 3.0 (8GBps).
We carry out comparison on raid10 with the included cache.
Sequential access operations
Media Streaming: block size 64KB, 98% / 2% read / write, 100% sequential access
Random access operations
OLTP DB: block size 8KB, 70% / 30% read / write, 100% random access
Combined access operations
Workstation: block size 8KB, 80% / 20% read / write, 80% / 20% random access / sequential access
When using 3Gbps and 6Gbps disks with 10K revolutions on this configuration, there is no fundamental difference in IOPS or Latency. But the increase in performance when using 6Gbps 15K is very significant and is best seen in random access operations. Conclusion: the number of revolutions does matter.
On the issue of PCIe 2.0 and 3.0: on the example of the configuration of the Gen6, Gen7 and Gen8 servers with 6Gbps disks, the difference in IOPS is a maximum of 10%, according to Latency and not at all more than 2%. Conclusion: The PCIe 2.0 bottleneck is wide enough for a configuration of four 6Gbps (600MBps) disks.
It is curious that the seventh generation server on the 3G 10Krpm configuration gave worse performance than Gen 6 on the same disks. What is the reason for this, in this case, is difficult to say and, probably, will be revealed during complex testing of servers.
The use of the fifth generation 6Gbps 15K disks in the server gave a certain increase in speed, mainly due to a greater number of revolutions per second. The difference between 6G and 3G ten-thousand, as expected, is almost absent.
The difference between generations of servers
In principle, everything can be seen above, but still illustrate with the example of raid10, built on four 6Gbps disks.
Sequential access operations
Media Streaming: block size 64KB, 98% / 2% read / write, 100% sequential access
Random access operations
OLTP DB: block size 8KB, 70% / 30% read / write, 100% random access
Combined access operations
Workstation: block size 8KB, 80% / 20% read / write, 80% / 20% random access / sequential access
As can be seen on the graphs, the difference is not significant, especially between the DL360Gen6, DL360Gen7 and DL360Gen8 servers. In the typical load (workstation profile) there is a slight difference with the DL360Gen5. The old P400i controller in the DL360G5 server was very disappointing only on sequential access operations, both in terms of IOPS number and response time (latency), which is not surprising.
Those who want to get acquainted with the detailed test results (raid5 and raid10 configurations on three, four and eight disks) can download the csv file
See also detailed histograms for all tested configurations.


Sequential access.
SQL Server Log: block size 64KB, 0% / 100% read / write, 100% sequential access
Web Server Log: block size 8KB, 0% / 100% read / write, 100% sequential access
Media Streaming: block size 64KB, 98% / 2% read / write, 100% sequential access
Random access. OLTP and Exchange databases.
OLTP DB: block size 8KB, 70% / 30% read / write, 100% random access
Decision Support System DB: 1MB block size, 100% Read, 100% random access
Exchange Server: 4KB block size, 67% / 33% read / write, 100% random access
Video On Demand: block size 512KB, 100% / 0% read / write, 100% random access
Combined access.
Workstation: block size 8KB, 80% / 20% read / write, 80% / 20% random access / sequential access
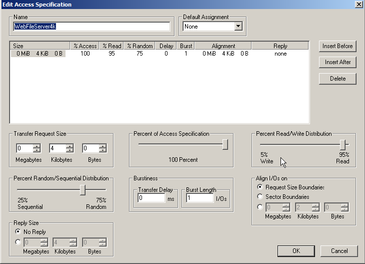
Web File Server64k: block size 64KB, 95% / 5% read / write, 75% / 25% random access / sequential access
Web File Server8k: block size 8KB, 95% / 5% read / write, 75% / 25% random access / sequential access
Web File Server4k: block size 4KB, 95% / 5% read / write, 75% / 25% random access / sequential access
Summarizing
The difference between the G8 (P420i) and G6 / G7 (with the same P410i controller) is no more than 10% for all types of tasks. This leads to the conclusion that if one proceeds solely from the ratio “disk system performance / cost”, G6 or G7 would be a more profitable acquisition. We will conduct a comprehensive comparison of the performance of these servers in one of the following articles.
Gen5 lags behind somewhat: we recall that its P400i controller communicates with disks at 3Gbps speed. It can be seen that the lag is not so great in random access operations. With the increasing number of sequential access operations, the difference grows. In principle, it can be compensated by increasing the number of disks in the array. Thus, this server can be recommended as a budget solution for a small company of 10-15 people.
And now we will try to answer the question: how much will I need IOPS for such and such a task? The simple answer: the more the better. With latency, respectively, the opposite.
First of all, it is worth figuring out what kind of load is foreseen (what exactly will work on the server) and try to relate to the above results, simulating the "ceiling" for a particular configuration.
Best of all is to see what load your applications give. In Linux, this can be done using the iostat program, which is part of the sysstat package, which shows the current state of the disk subsystem.
r / s and w / s - IOPS read and write
r / await and w / await are latency respectively.
util - server load level. In our tests, the value ranges from 80% to 100%.
In the case of Windows, measurements can be made with the perfmon utility.
If the peaks of the load, the values that are close to our results will be many and the util parameter will fluctuate around 80-100% for a long time - this is a good reason to think about optimizing the disk system.
Returning to the question of choosing a configuration for the needs of a small company: a file server, * SQL and services tied to it, we would recommend to consider a server not lower than Gen 6 with a P410i controller with an array of level 10 (minimum 4 disks) for reasons of a combination of speed and reliability ( raid10 has a much shorter array rebuilding time in case of disk failure) on 6Gbps 15Krpm media. Note that saving on the cache card is highly discouraged.
In general, for us, the test results were unexpected. The difference in the performance of disk subsystems was expected to be much greater, especially in the case of Gen8 with its PCIe 3.0 controller, compared to the sixth and seventh generation servers. There is marketing, but there is almost no difference - it's funny.
Source: https://habr.com/ru/post/267435/
All Articles