Big Data from A to Z. Part 1: Principles of working with big data, the MapReduce paradigm

Hi, Habr! With this article I open the cycle of materials devoted to working with big data. What for? I want to save the accumulated experience, my own team and, so to speak, in the encyclopedic format - for sure it will be useful to someone.
We will try to describe the big data problems from different angles: the basic principles of working with data, tools, examples of solving practical problems. Special attention will be given to the topic of machine learning.
We need to start from simple to complex, so the first article is about the principles of working with big data and the MapReduce paradigm.
Background and definition of the term
')
The term Big Data appeared relatively recently. Google Trends shows the beginning of active growth in the use of the phrase from 2011 ( link ):
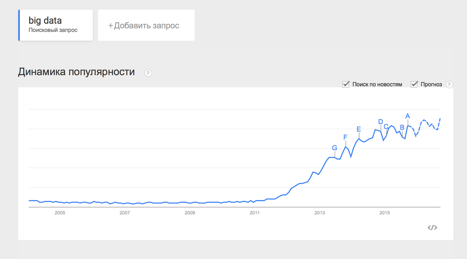
At the same time, the term already does not use only lazy. Especially often not in the case of the term used by marketers. So what is Big Data really? Since I decided to systematically state and consecrate the question, it is necessary to determine the concept.
In my practice, I met with different definitions:
· Big Data is when data is more than 100GB (500GB, 1TB, who likes it)
· Big Data is data that cannot be processed in Excel
· Big Data is data that cannot be processed on a single computer.
And even such:
· Vig Data is generally any data.
· Big Data does not exist, marketers have invented it.
In this series of articles, I’ll stick to the definition on wikipedia :
Big data ( eng. Big data ) - a series of approaches, tools and methods for processing structured and unstructured data of huge volumes and significant diversity for obtaining human-perceptible results that are effective in conditions of continuous growth, distribution over numerous nodes of a computer network formed in the late 2000s alternatives to traditional database management systems and business intelligence solutions.
Thus, under Big Data I will understand not a specific amount of data or even the data itself, but their processing methods, which allow distributed information to be processed. These methods can be applied both to huge data arrays (such as the content of all pages on the Internet) and to small ones (such as the content of this article).
Here are some examples of what could be a source of data for which big data methods are needed:
· Logs of user behavior on the Internet
· GPS signals from vehicles for the transport company
· Data taken from sensors in the Large Hadron Collider
· Digitized books in the Russian State Library
· Information about transactions of all bank customers
· Information on all purchases in a large retail network, etc.
The number of data sources is growing rapidly, which means their processing technologies are becoming more and more popular.
Principles of working with big data
Based on the definition of Big Data , we can formulate the basic principles of working with such data:
1. Horizontal scalability . Since there can be as much data as possible - any system that involves processing big data must be expandable. The data volume increased by 2 times - the amount of iron in the cluster increased by 2 times and everything continued to work.
2. Fault tolerance . The principle of horizontal scalability implies that there can be many machines in a cluster. For example, Yahoo's Hadoop Cluster has more than 42,000 machines (from this link you can see the cluster sizes in different organizations). This means that some of these machines will be guaranteed to fail. Methods of working with big data should take into account the possibility of such failures and survive them without any significant consequences.
3. Local data. In large distributed systems, data is distributed across a large number of machines. If the data is physically located on one server and processed on the other, the cost of data transfer may exceed the cost of processing itself. Therefore, one of the most important design principles for BigData solutions is the principle of data locality - if possible, we process data on the same machine on which we store them.
All modern means of working with big data somehow follow these three principles. In order to follow them - it is necessary to invent some methods, methods and paradigms of developing data development tools. One of the most classic methods I will analyze in today's article.
MapReduce
About MapReduce on Habré already written ( one , two , three ), but since the series of articles claims to be a systematic presentation of Big Data questions - MapReduce in the first article is indispensable J
MapReduce is a distributed data processing model proposed by Google for processing large amounts of data on computer clusters. MapReduce is nicely illustrated by the following image (taken from the link ):

MapReduce assumes that data is organized in the form of some records. Data processing occurs in 3 stages:
1. Stage Map . At this stage, the data is processed using the map () function that the user defines. The job of this stage is to pre-process and filter the data. The operation is very similar to the map operation in functional programming languages — a user-defined function is applied to each input record.
The map () function applied to a single input record and produces a set of key-value pairs . The set - i.e. can give only one record, can give nothing, and can give several key-value pairs. What will be in the key and in the meaning is up to the user, but the key is a very important thing, since the data with one key will fall into one instance of the reduce function in the future.
2. Stage Shuffle . It passes unnoticed by the user. At this stage, the output of the map function is “disassembled into baskets” - each basket corresponds to one output key of the map stage. In the future, these baskets will serve as an input for reduce.
3. Stage Reduce . Each “basket” with values, formed at the shuffle stage, goes to the input of the reduce () function.
The reduce function is set by the user and calculates the final result for a single “basket”. The set of all values returned by the reduce () function is the final result of the MapReduce task.
Some additional facts about MapReduce:
1) All launches of the map function work independently and can work in parallel, including on different cluster machines.
2) All launches of the reduce function work independently and can work in parallel, including on different cluster machines.
3) Shuffle inside represents parallel sorting, so it can also work on different cluster machines. Items 1-3 allow you to perform the principle of horizontal scalability.
4) The map function, as a rule, is used on the same machine on which data is stored - this allows reducing data transmission over the network (data locality principle).
5) MapReduce is always a full scan of the data, there are no indices. This means that MapReduce is poorly applicable when a response is required very quickly.
Examples of problems effectively solved with MapReduce
Word Count
Let's start with the classic task - Word Count. The task is formulated as follows: there is a large body of documents. The task is for each word that occurs at least once in the body, count the total number of times it has occurred in the body.
Solution :
Since we have a large body of documents, let one document be one input record for the MapRreduce – task. In MapReduce, we can only define custom functions, which we will do (we will use the python-like pseudocode):
| |
The map function turns the input document into a set of pairs (word, 1), shuffle transparently for us turns it into pairs (word, [1,1,1,1,1,1]), reduce summarizes these ones, returning the final answer for the word .
Processing the logs of the advertising system
The second example is taken from the real practice of the Data-Centric Alliance .
Task : there is a csv-log of the advertising system of the type:
<user_id>,<country>,<city>,<campaign_id>,<creative_id>,<payment></p> 11111,RU,Moscow,2,4,0.3 22222,RU,Voronezh,2,3,0.2 13413,UA,Kiev,4,11,0.7 … It is necessary to calculate the average cost of advertising for cities in Russia.
Decision:
|
|
The map function checks whether we need this record - and if necessary, leaves only the necessary information (city and amount of payment). The reduce function calculates the final answer in the city, having a list of all payments in that city.
Summary
In the article, we looked at a few introductory points about big data:
· What is Big Data and where does it come from;
· What are the main principles followed by all means and paradigms of working with big data;
· Considered the MapReduce paradigm and sorted out several tasks in which it can be applied.
The first article was more theoretical , in the second article we turn to the practice, consider Hadoop - one of the most famous technologies for working with big data and show how to run MapReduce- tasks on Hadoop.
In subsequent articles of the cycle, we will consider more complex problems solved using MapReduce , discuss the limitations of MapReduce and what tools and techniques you can bypass these restrictions.
Thank you for your attention, we are ready to answer your questions.
Youtube Channel about data analysis
Links to other parts of the cycle:
Part 2: Hadoop
Part 3: Techniques and strategies for developing MapReduce applications
Part 4: Hbase
Source: https://habr.com/ru/post/267361/
All Articles