How I participated in the Sberbank competition about predicting customer churn
In the framework of ICBDA 2015, Sberbank held a contest for predicting the outflow of its customers . I was not bothered about this, I did not win anything, and nevertheless I would like to describe the decision process.

Sberbank generously shipped data. We were given ~ 20,000 users, about which it was known they got into an outflow in November, December, January or not. And there were ~ 30,000 users for whom it was necessary to guess whether they would leave in February. In addition, a 35GB file was attached about this content:
The physical meaning of the fields was not specifically disclosed. Said "so interesting." It was known only where to look for user id. This alignment seemed to me extremely strange. However, Sberbank can also be understood. To start this hell of a data array, I decided to leave aside and study in more detail the users from the training and test sets.
It turned out incredible: if the user did not leave in November and December, then in January he probably will not leave. If the user is gone, he will most likely not return:
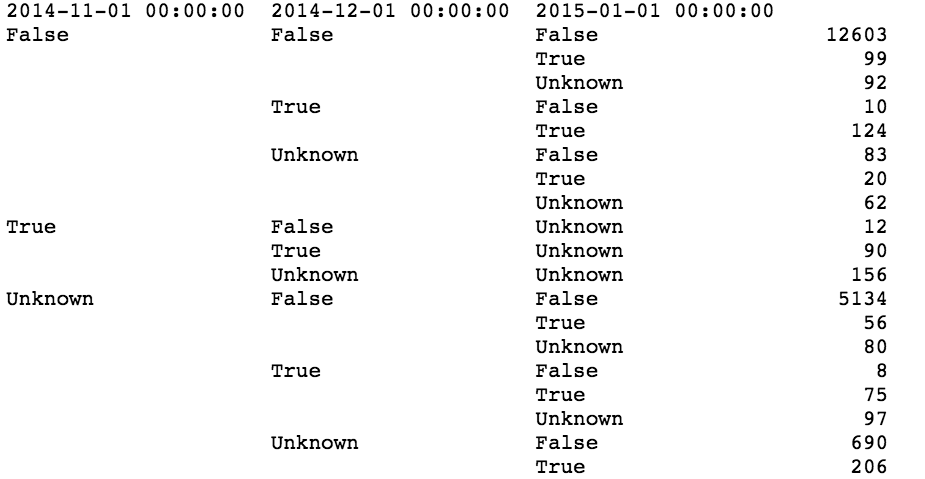
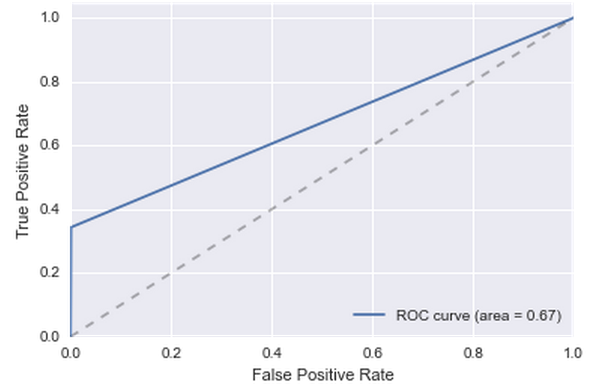
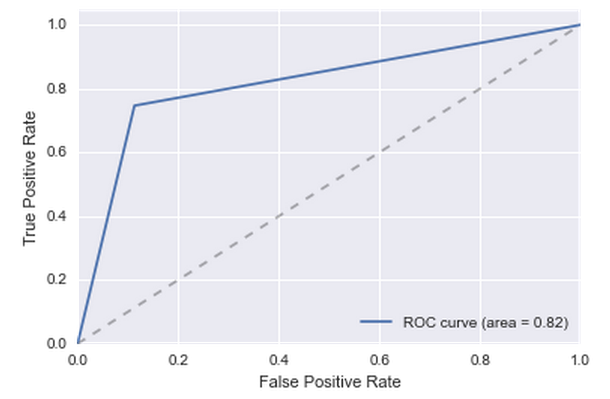
In addition, it turned out that 70% of users from the test sample is in the training. That is, the next ingenious classifier suggests itself: if a user leaves in January, he will be out of flow in February, if he does not leave in January, then he will not be in the outflow. To estimate the quality of such a decision, we take all users from January and make a prediction for them according to the data for December. It turns out not much, but better than nothing:
')
Yes, it is clear that January and February are completely different months. The end of December, the first half of January is especially special for Russians. But there is not much choice, you need to check the algorithm for something.
To somehow improve the solution, you still have to sort out the giant file without a description. First of all, I decided to throw out all the records in which the id does not belong to any user from the training or test sample. Oh horror, not a single record could not be thrown out. One user there corresponds not one, and, on average, 300 records. That is, these are some logs, and not aggregated data. In addition, 50 of the 60 columns are hashes. Logs with hashes instead of values. In my view, this is complete nonsense. I love the analysis of data for those moments when I manage to discover some new knowledge. In this case, the opening may look like this: “if the user in the seventh column often has 8UCcQrvgqGa2hc4s2vzPs3dYJ30 = then he will probably leave soon.” Not very interesting. Nevertheless, I decided to test several hypotheses, see what happens.
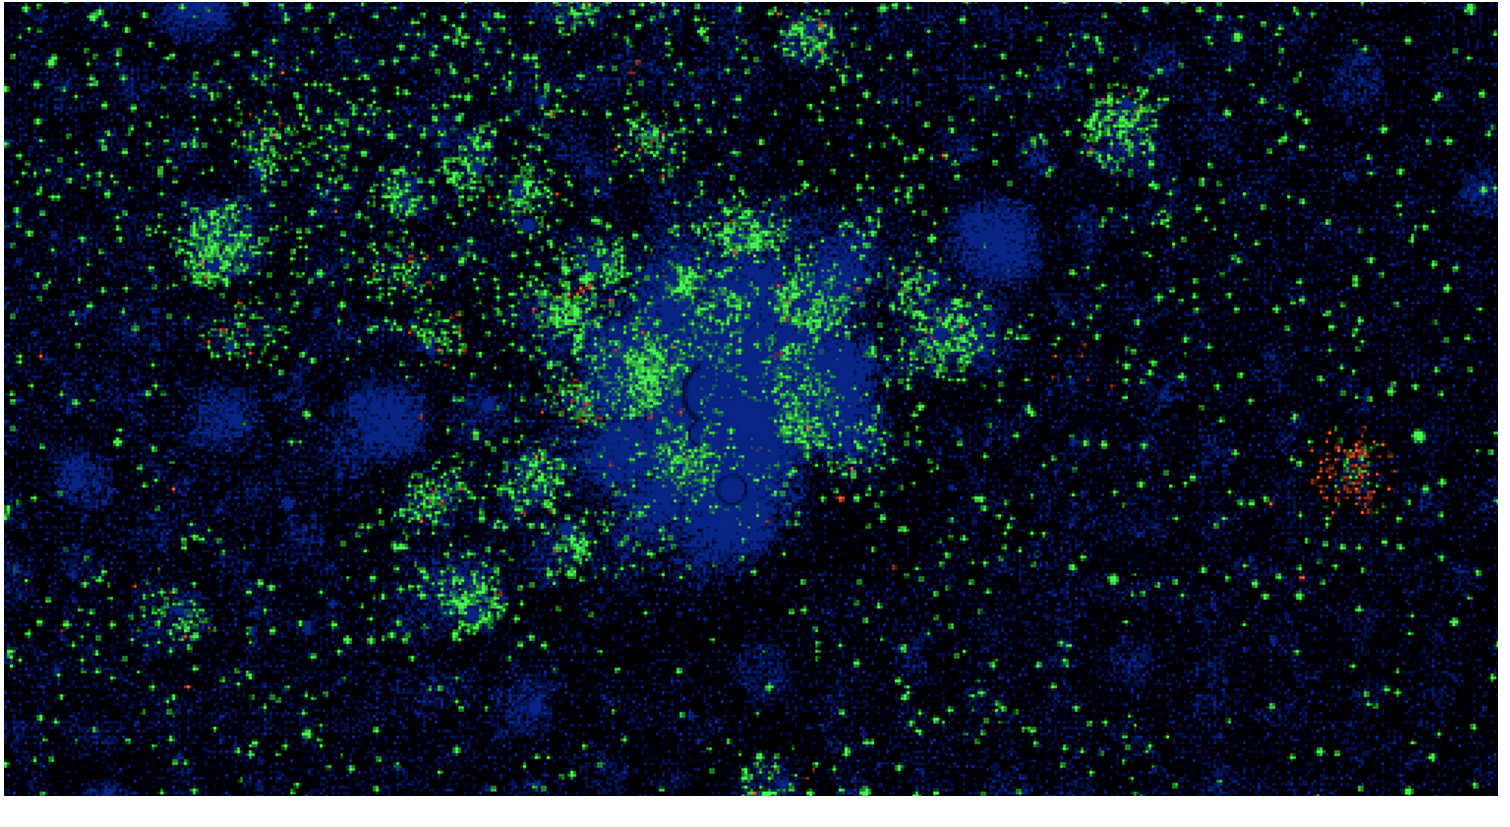
It is known that in every line of the log there are two id, and not one. Therefore, I assumed that we are working with some transactions. In order to check this somehow, a graph was constructed, where id were located at the vertices, and edges appeared if two id were encountered in one record. If there are transactions in the log, the graph should turn out very sparse and should be well grouped into clusters. It turned out not exactly what I expected, there were many connections between clusters by eye:
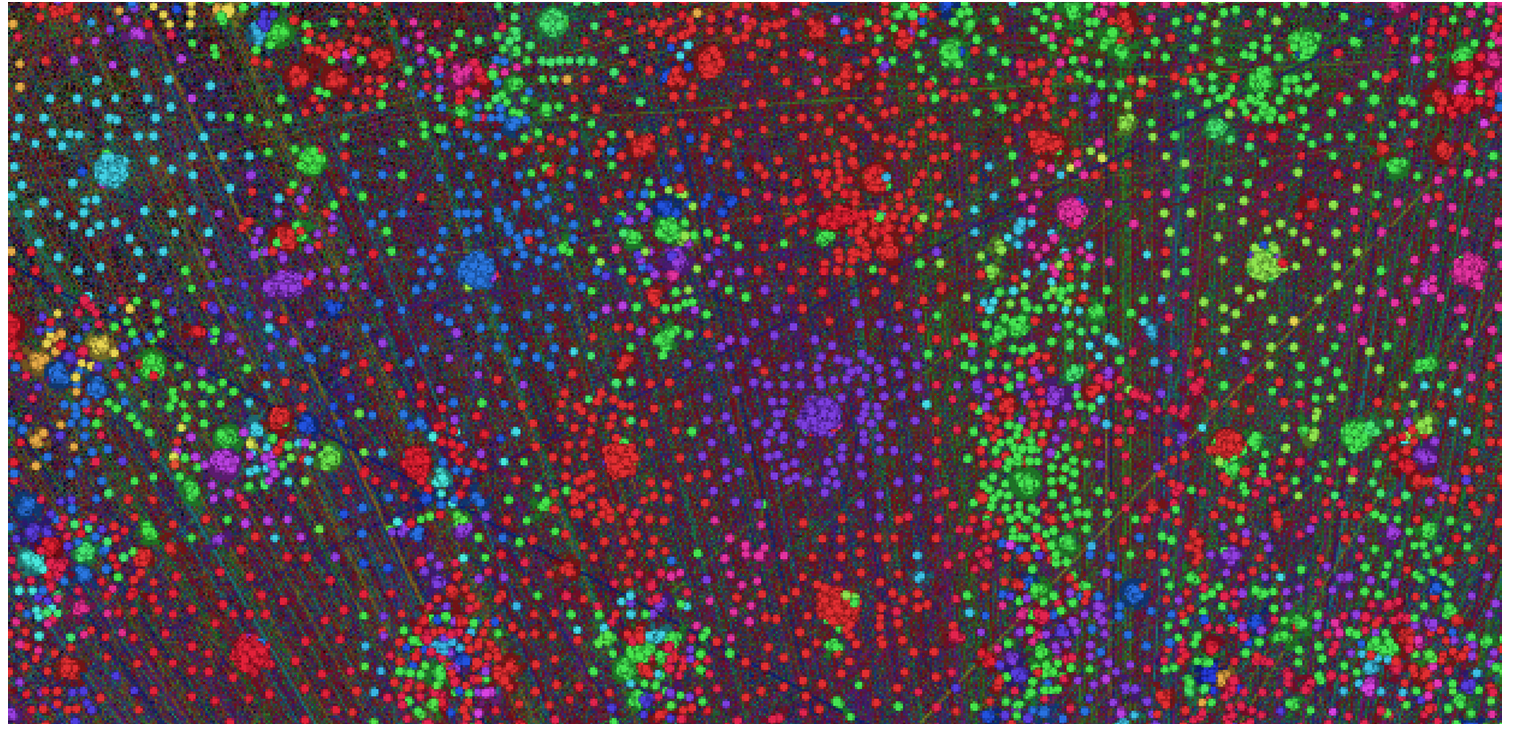
But, formally, the modularity was very high and the cluster, often formed around one vertex, so I decided that after all this is a transaction. Moreover, there were no better ideas.
Well, if we are dealing with transactions, a logical addition to the model will be the number of incoming and outgoing transactions. Indeed, among those who left in January, almost 40% had less than ten incoming transactions.
Add this simple condition to the model and get a good quality:
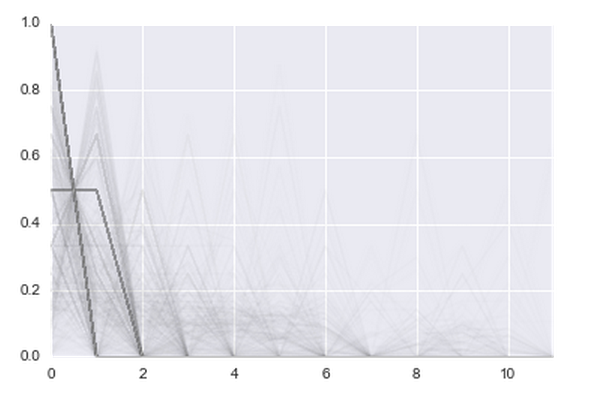
It is clear that just the number of transactions is not very cool. The user can make 500 transactions in January 2014 and easily leave in January 2015. You need to look at the trend. In ducks, in fact, everything ends in the first, second month:
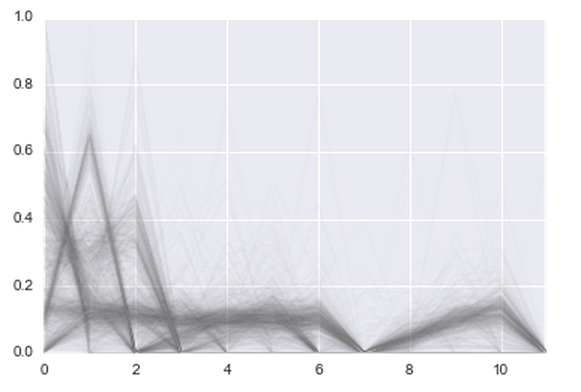
And for those who have left the stories more difficult:
Somehow I simply could not add this condition to the model, so I had to turn to machine learning. We washed down RandomForest on 500 trees with a depth of 10 on features like: “months before the first transaction”, “months before the last transaction”, “number of months with transactions”. The quality has grown a bit:
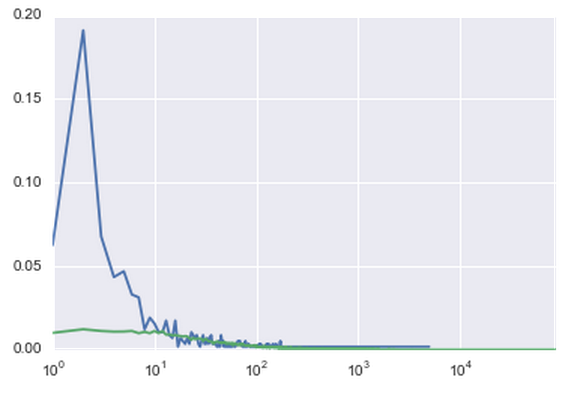
The reserve of simple clear solutions has been exhausted. Therefore, I had to dig into a giant file without a description even deeper. For all columns it was calculated how many unique values are found there.
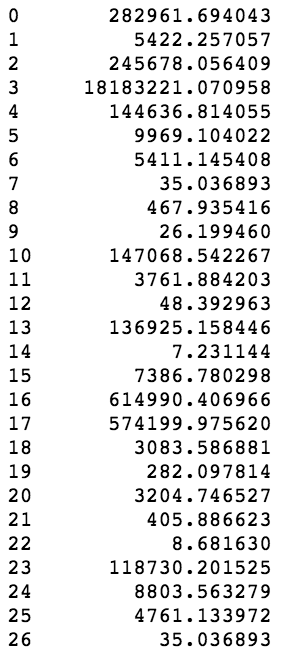
Why is the number of unique fractional values? Because I had to use a clever method of counting unique values with fixed memory . If you just stuff everything into sets, you won’t get enough memory.
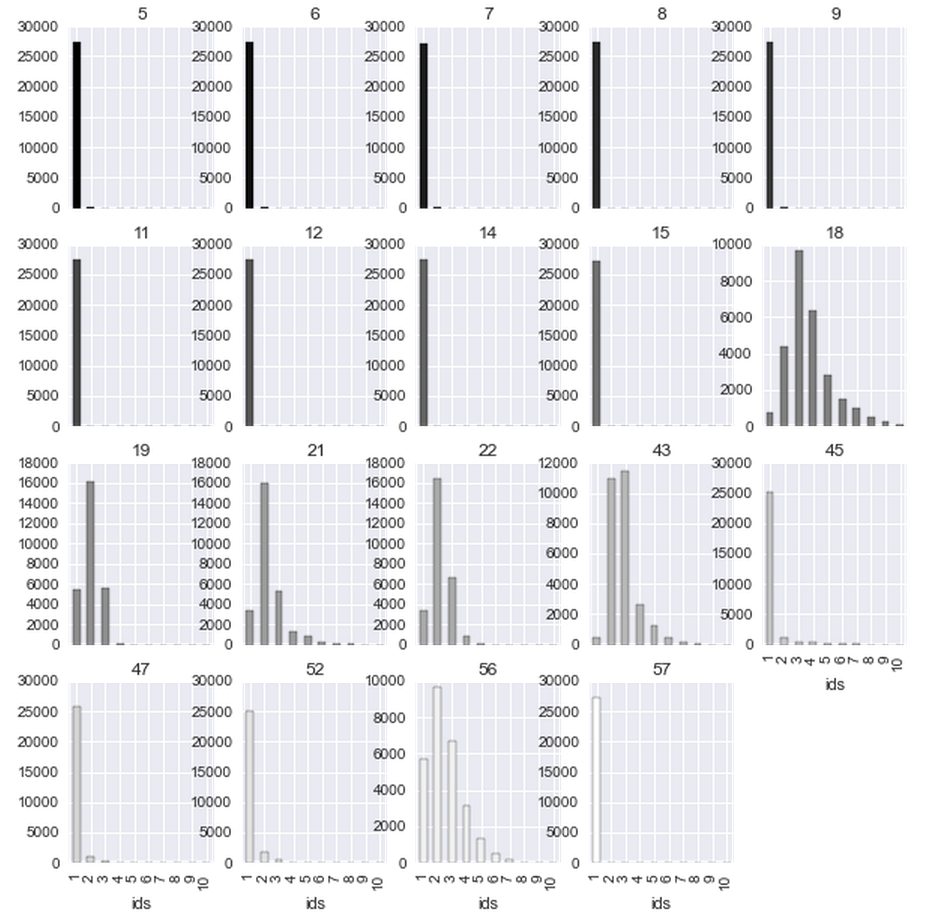
Then for the columns in which a reasonable number of different values were calculated histograms:
It can be seen that some of the histograms are similar, for example, 14 and 33, 22 and 41. Indeed, most of the fields are in pairs (yes, I manually typed the sign correlation graph):
That is, part of the columns describe id1, part id2. Some fields are signs of a transaction. In order to make sure which columns describe the user, I calculated how often for one id they take different values. It turned out that columns 5 to 15 almost never take more than one value per id. Indeed, some of them are city name, zip code. They entered the model as categorical. The rest can take different values for one id (mostly null, of course), so they entered the model with weights.
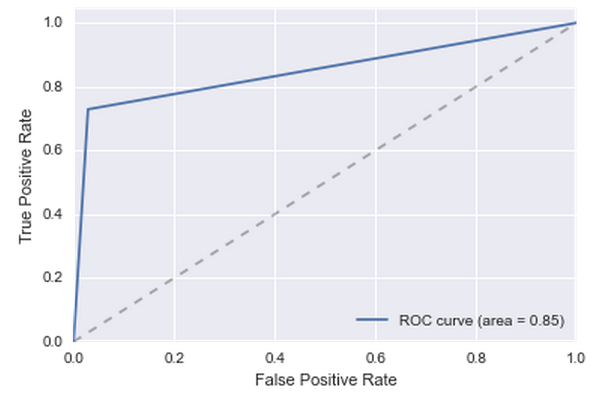
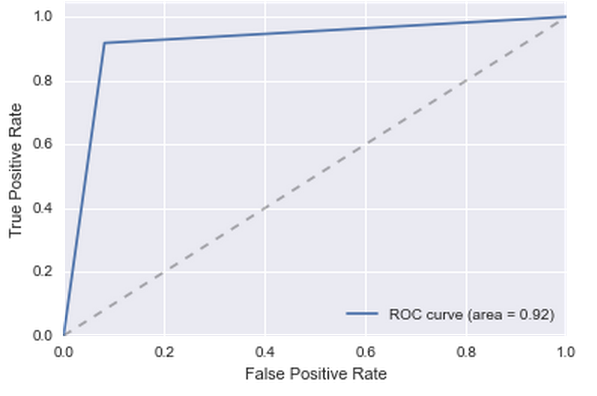
Because of all these categorical features, the complexity of the model has greatly increased, most of the new features did not contribute much. But there was one feature - the 56th. She is strongly influenced. The quality has grown significantly:
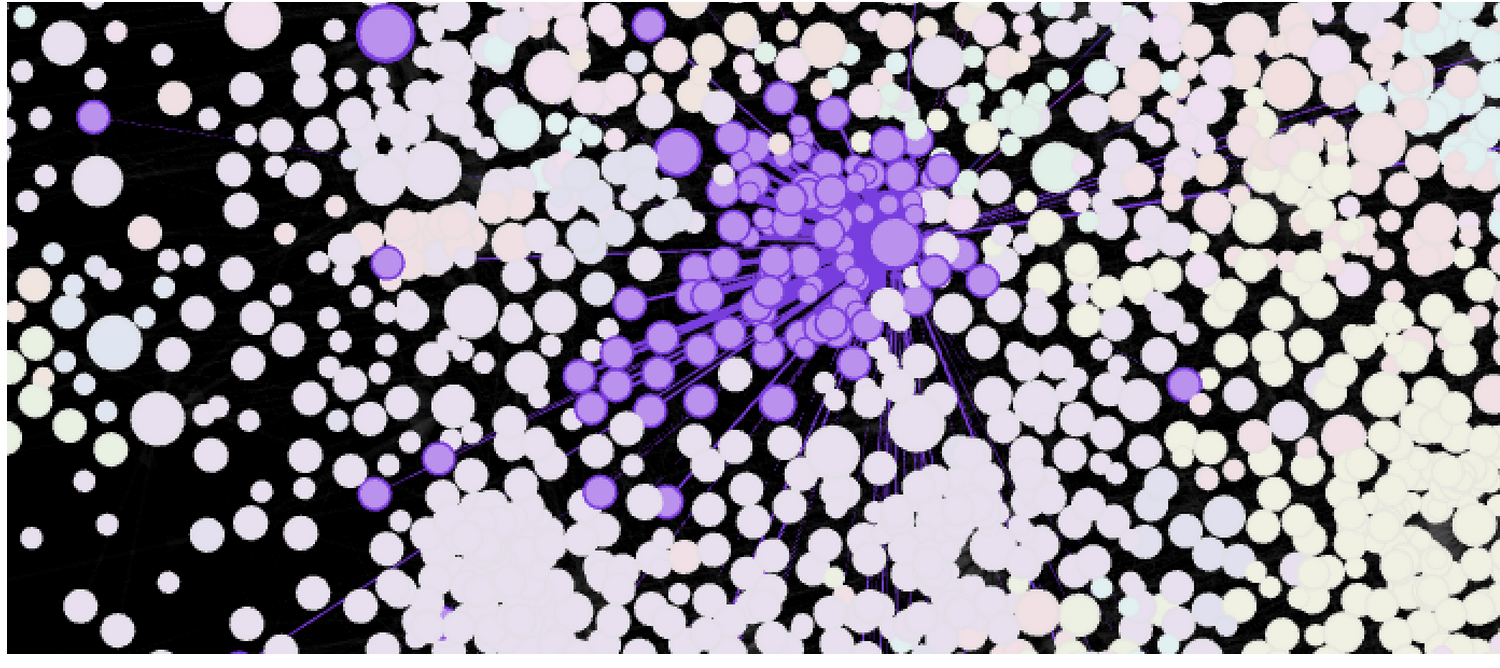
I tried another cool feature. He took out the transaction graph, which he built at the very beginning and looked at where the users were there who had leaked and remained. I was surprised to note that there is a cluster where there are almost only leaked ones. True, the classifier and so they did not make mistakes, so the increase in quality did not work.
Popodbirail parameters for RandomForest. Mark out a test sample. I made sure that everyone who left in January, left in February. I checked that in general, the percentage of those who left is normal. And sent to Sberbank. But something apparently went wrong, because in the top 3 I did not find myself. A larger top did not show us.
Sberbank generously shipped data. We were given ~ 20,000 users, about which it was known they got into an outflow in November, December, January or not. And there were ~ 30,000 users for whom it was necessary to guess whether they would leave in February. In addition, a 35GB file was attached about this content:
, The physical meaning of the fields was not specifically disclosed. Said "so interesting." It was known only where to look for user id. This alignment seemed to me extremely strange. However, Sberbank can also be understood. To start this hell of a data array, I decided to leave aside and study in more detail the users from the training and test sets.
It turned out incredible: if the user did not leave in November and December, then in January he probably will not leave. If the user is gone, he will most likely not return:
In addition, it turned out that 70% of users from the test sample is in the training. That is, the next ingenious classifier suggests itself: if a user leaves in January, he will be out of flow in February, if he does not leave in January, then he will not be in the outflow. To estimate the quality of such a decision, we take all users from January and make a prediction for them according to the data for December. It turns out not much, but better than nothing:
')
Yes, it is clear that January and February are completely different months. The end of December, the first half of January is especially special for Russians. But there is not much choice, you need to check the algorithm for something.
To somehow improve the solution, you still have to sort out the giant file without a description. First of all, I decided to throw out all the records in which the id does not belong to any user from the training or test sample. Oh horror, not a single record could not be thrown out. One user there corresponds not one, and, on average, 300 records. That is, these are some logs, and not aggregated data. In addition, 50 of the 60 columns are hashes. Logs with hashes instead of values. In my view, this is complete nonsense. I love the analysis of data for those moments when I manage to discover some new knowledge. In this case, the opening may look like this: “if the user in the seventh column often has 8UCcQrvgqGa2hc4s2vzPs3dYJ30 = then he will probably leave soon.” Not very interesting. Nevertheless, I decided to test several hypotheses, see what happens.
It is known that in every line of the log there are two id, and not one. Therefore, I assumed that we are working with some transactions. In order to check this somehow, a graph was constructed, where id were located at the vertices, and edges appeared if two id were encountered in one record. If there are transactions in the log, the graph should turn out very sparse and should be well grouped into clusters. It turned out not exactly what I expected, there were many connections between clusters by eye:
But, formally, the modularity was very high and the cluster, often formed around one vertex, so I decided that after all this is a transaction. Moreover, there were no better ideas.
Well, if we are dealing with transactions, a logical addition to the model will be the number of incoming and outgoing transactions. Indeed, among those who left in January, almost 40% had less than ten incoming transactions.
Add this simple condition to the model and get a good quality:
It is clear that just the number of transactions is not very cool. The user can make 500 transactions in January 2014 and easily leave in January 2015. You need to look at the trend. In ducks, in fact, everything ends in the first, second month:
And for those who have left the stories more difficult:
Somehow I simply could not add this condition to the model, so I had to turn to machine learning. We washed down RandomForest on 500 trees with a depth of 10 on features like: “months before the first transaction”, “months before the last transaction”, “number of months with transactions”. The quality has grown a bit:
The reserve of simple clear solutions has been exhausted. Therefore, I had to dig into a giant file without a description even deeper. For all columns it was calculated how many unique values are found there.
Why is the number of unique fractional values? Because I had to use a clever method of counting unique values with fixed memory . If you just stuff everything into sets, you won’t get enough memory.
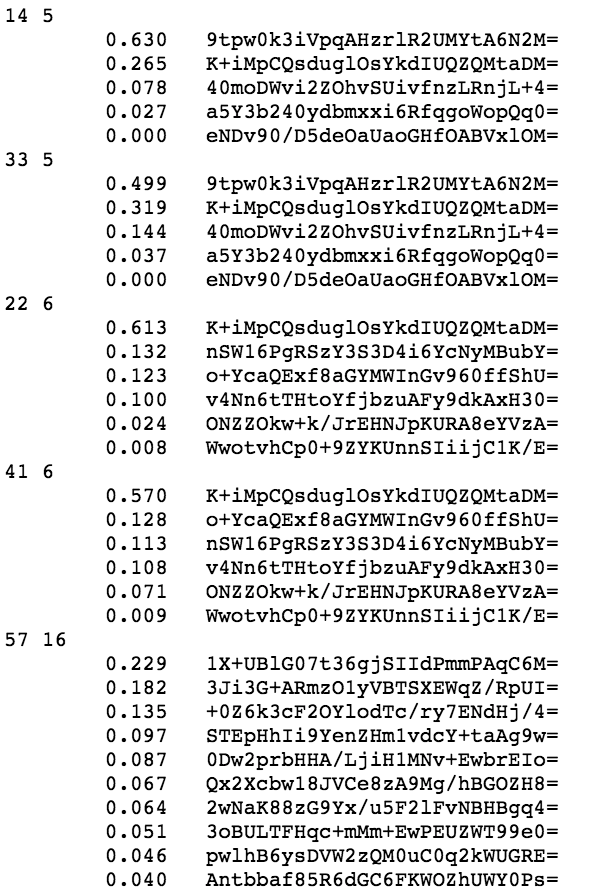
Then for the columns in which a reasonable number of different values were calculated histograms:
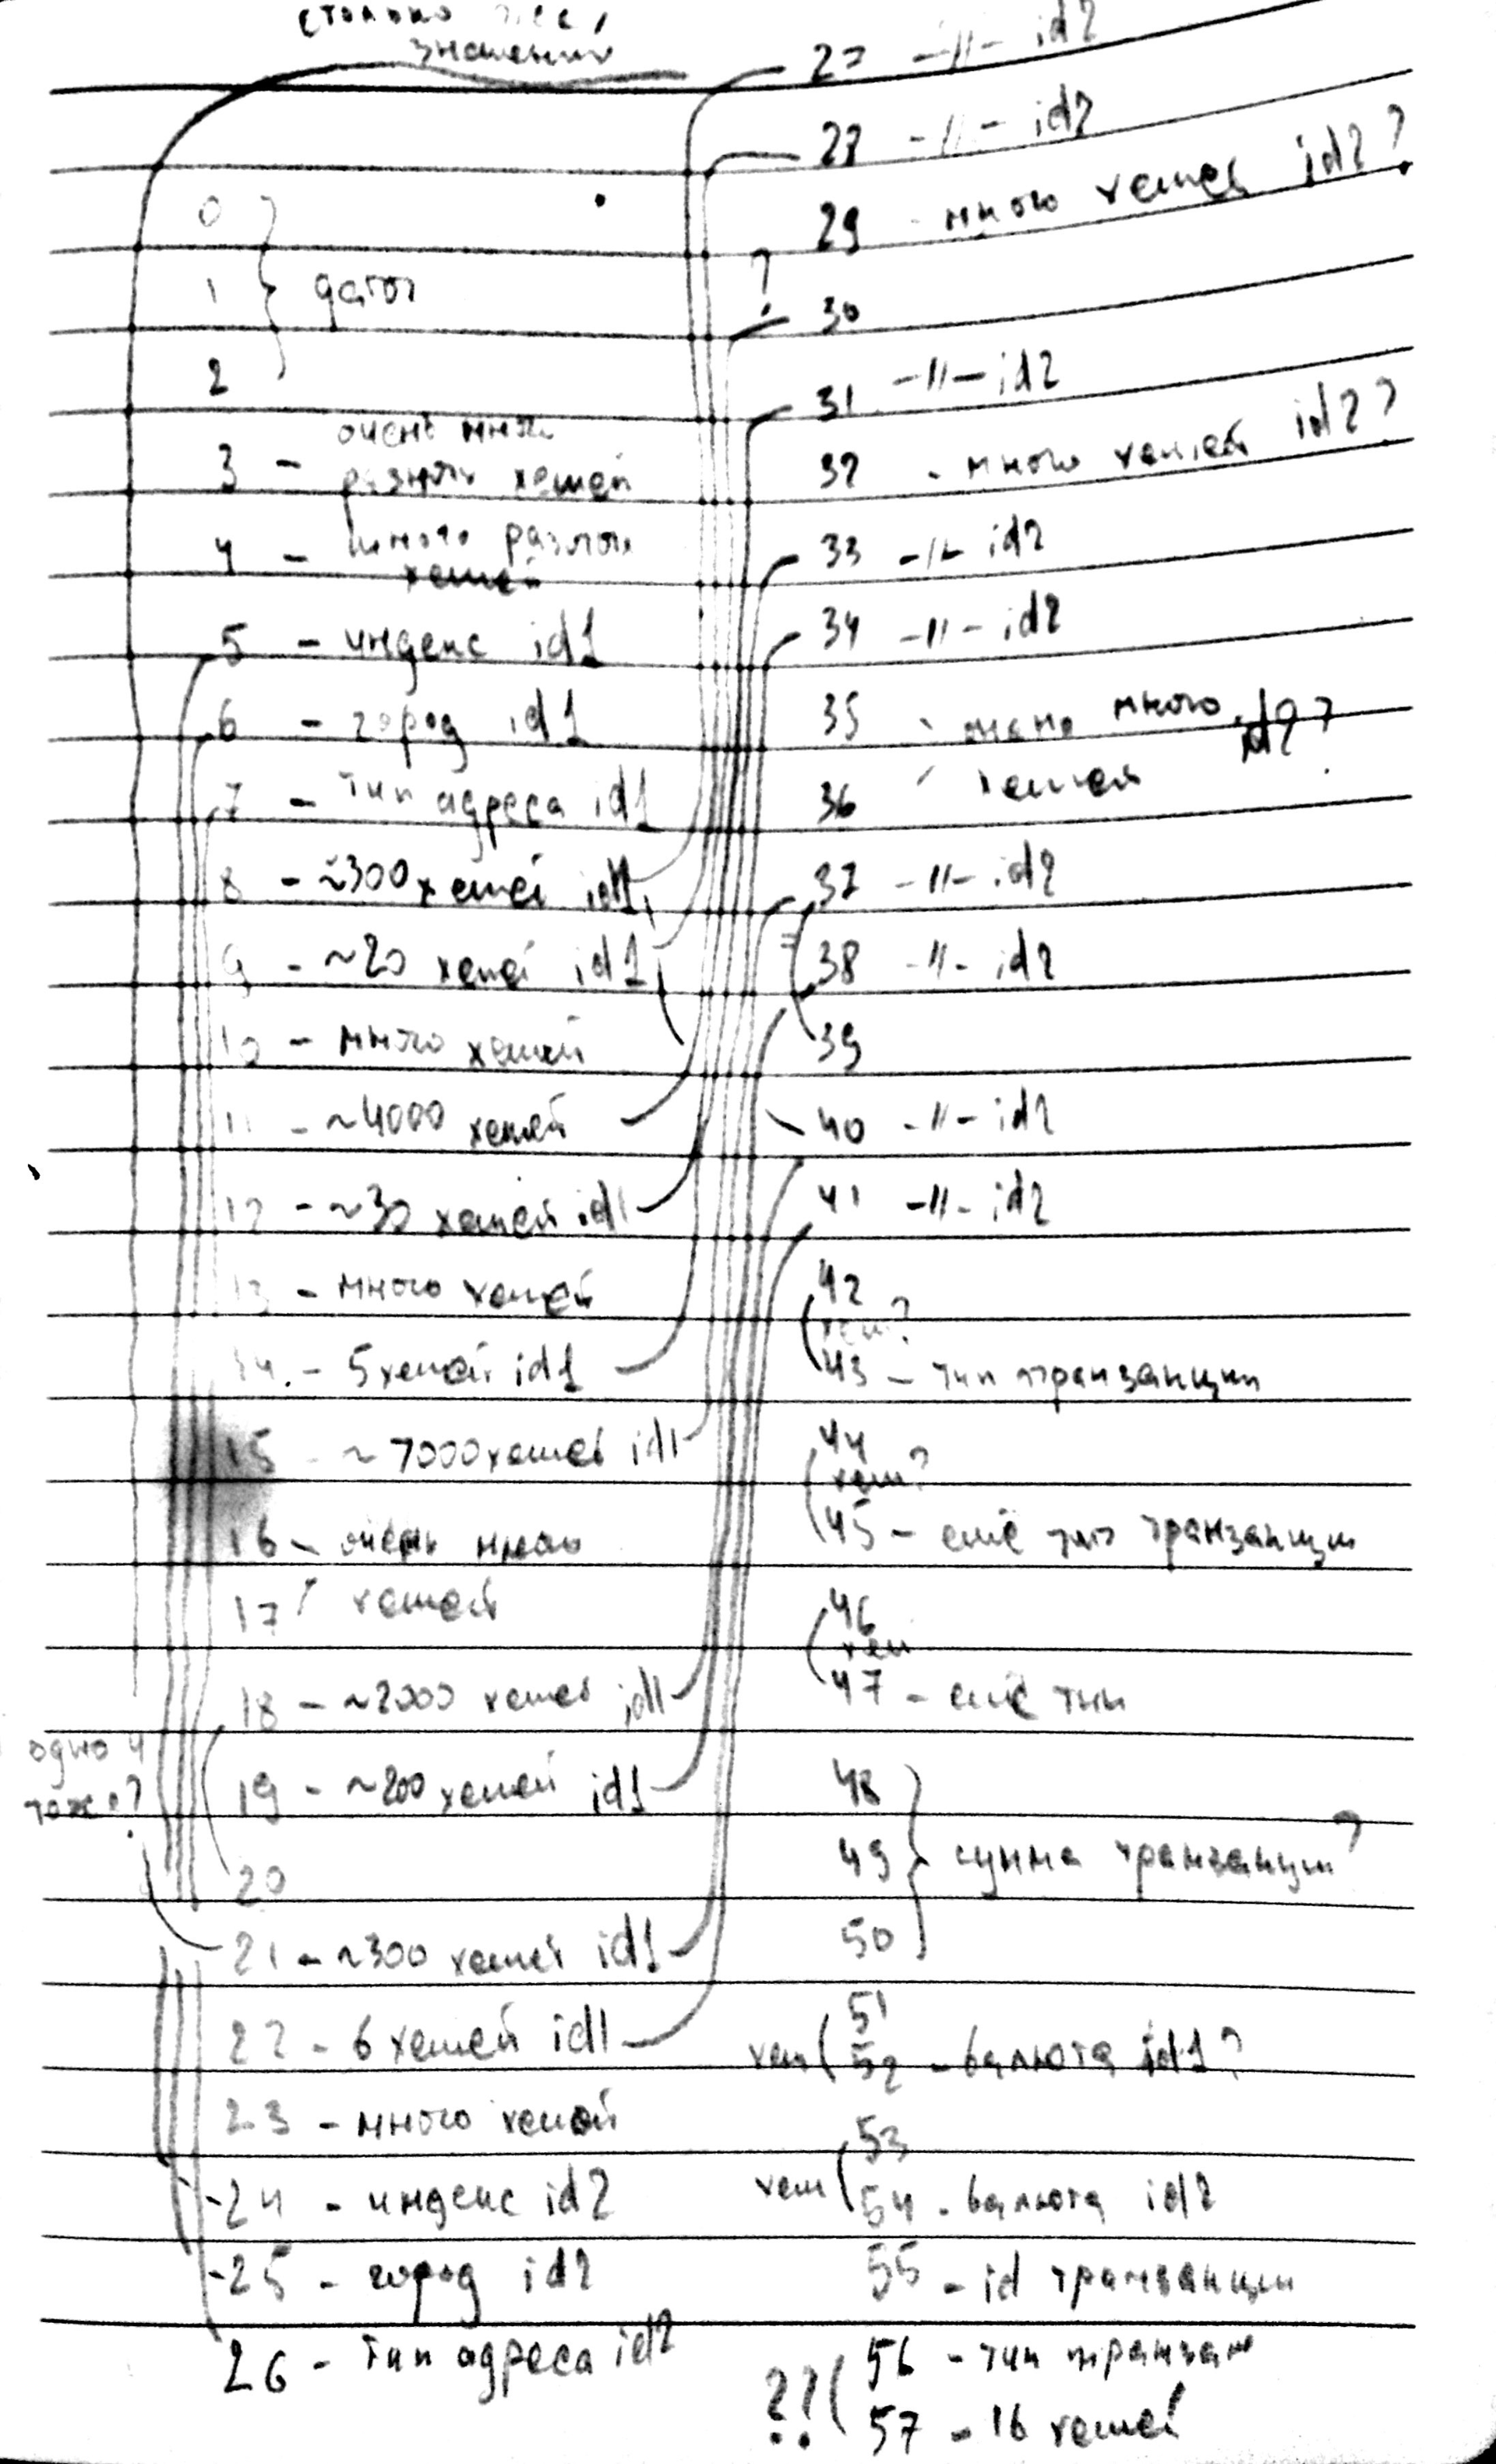
It can be seen that some of the histograms are similar, for example, 14 and 33, 22 and 41. Indeed, most of the fields are in pairs (yes, I manually typed the sign correlation graph):
That is, part of the columns describe id1, part id2. Some fields are signs of a transaction. In order to make sure which columns describe the user, I calculated how often for one id they take different values. It turned out that columns 5 to 15 almost never take more than one value per id. Indeed, some of them are city name, zip code. They entered the model as categorical. The rest can take different values for one id (mostly null, of course), so they entered the model with weights.
Because of all these categorical features, the complexity of the model has greatly increased, most of the new features did not contribute much. But there was one feature - the 56th. She is strongly influenced. The quality has grown significantly:
I tried another cool feature. He took out the transaction graph, which he built at the very beginning and looked at where the users were there who had leaked and remained. I was surprised to note that there is a cluster where there are almost only leaked ones. True, the classifier and so they did not make mistakes, so the increase in quality did not work.
Popodbirail parameters for RandomForest. Mark out a test sample. I made sure that everyone who left in January, left in February. I checked that in general, the percentage of those who left is normal. And sent to Sberbank. But something apparently went wrong, because in the top 3 I did not find myself. A larger top did not show us.
Source: https://habr.com/ru/post/267217/
All Articles