As we did ABC analysis for retail, or “without half a liter you will not understand”
Proverbs by themselves do not appear ... Sometimes you climb into such a jungle of analysts that, unwittingly, there is a hand to a cabinet with depressants (yes, all right, we know it is in every office).

But let's talk a little about something else.
')
In retail, logistics, warehouse management and inventory there is such a thing as ABC analysis . About him already written many theoretical publications. And everything seems to be relatively simple and understandable, but is it really so?
When a category manager or marketer of a trading network comes close to conducting an ABC analysis, he inevitably has a whole bunch of questions, hesitations and doubts. It is with them that we will work in this article!
Let's go over the algorithm of actions in the ABC analysis in grocery retail chains, exceptions to the rules that must be taken into account, we will show an example of analyzing the commodity group of Alcoholic beverages (yes, that's half a liter).
If someone hears ABC analysis for the first time, here’s
When conducting an ABC analysis, the first thing that needs to be done is to determine
It is important to answer such questions:
Go through the points.
The purpose of the analysis depends on the existing problem or, but why do we carry it out at all? Any analyst serves to achieve some goal, ABC analysis is by no means an exception. A clear vision of the goal is already half the success of marketing activity.
The goal predicts what we can achieve through the use of ABC analysis, so it may differ even depending on who carries out the analysis. Category managers most often analyze sales of goods, store managers - turnover, marketers - the inclusion of goods in customer checks.
The most popular goals are:
Reach the goal can be using different objects of analysis . They can be - supplies, warehouse stocks, product range of a single store or the entire distribution network, goods that are included in a certain product group or category.
Here it is necessary to approach the analysis carefully. For example, to optimize the assortment, analysis of the entire assortment of a store or network will yield practically nothing. After all, we cannot leave only bread, milk and alcohol in the store, although these groups will be the most popular. But in the context of a separate commodity group, you can easily track the products of group C (outsiders in terms of turnover and number of sales) from which you need to get rid of.
Criteria. Again, closely related to the object and purpose of the analysis.
The most common:
The choice of only one criterion for analysis significantly limits the reliability of the results. As a rule, two or three criteria are used and cross-analysis is performed, as described in more detail below.
Percentage ratio. Unfortunately, the averaged values proposed by the Pareto principle do not always correspond to reality. In reality, a category manager or store manager, in determining the percentage, is guided, first of all, by his experience, objectives and analysis criteria, the specifics of the product group, store or retail network.
80-15-5,
70-20-10,
50-30-20,
and even 40-40-20, these are all possible variants of percentages of categories A, B and C.
A wide variation indicates a variety of situations and the impossibility of targeting the universal ratio of category boundaries. Thus, a category manager of a large retail chain can afford to withdraw a significant amount of category C products from the range; in any case, the store shelves will not be empty. Another thing is managing a small trading network of 2-3 stores, where the withdrawal of 100-200 goods will have a detrimental effect on the breadth of the presented range.
A period of time. It is often too expensive to conduct ABC analysis on the use of working time by marketers, category managers or store managers, and the results of such an analysis will not be obvious due to the cyclical nature of sales of goods by day of the week or season.
For example, the analysis of the entire product range can be carried out every six months to analyze which products and groups of goods are the most important and what has changed in comparison with the previous period.
Analysis of goods in each product group, as a rule, is carried out once in 2 months, options are possible once in 3 months. It all depends on the size of the range and capabilities of network analysts.
Division into A, B, C category.
When analyzing a merchant assortment of a store, a marketer can use 1 criterion — for example, the profitability of a product or product group, but the data obtained is not always useful enough.
Therefore, cross-analysis is applied according to several criteria. Yes, this approach is not simple, but using more criteria allows you to better see the existing situation. When carrying out several options are possible:
1. Sequential categorization.
It is worth using if the assortment of the product group is too large. First, the assortment is analyzed by the first criterion (for example, turnover), then each resulting category is analyzed again by the second criterion (the number of sales), etc. As a result, we get subcategories with a relatively small list of products with which it is convenient to work.
2. Parallel categorization.
We carry out the ABC analysis simultaneously (in parallel) according to some criteria, creating categories like AA, Sun, etc ...
Using 2 criteria, say, Revenue and Number of sales, we get already 9 categories:
We use 3 criteria - 27 categories. For example:
This approach is more complex, gives a larger category of goods, but allows you to get extensive information about each category.
For example, using 3 criteria for parallel analysis, products that received AAA are the most important products for the retailer. They bring significant income, they are often bought, they bring revenue. So, they must be constantly available, with uninterrupted supplies and a good margin.
Products of categories , , are also quite important and it is worth working actively with them. For example, a product is included in category A in terms of revenue and profitability, and in category B in sales. It is necessary to find him the best place on the shelf, or to carry out promotional activities and the store will receive a significant profit. Another option is a product group with category A by the number of sales and profitability, and with category B by revenue. For products in this category, a revision of the pricing policy is possible, so a slight increase in the price of goods will lead to an increase in store revenue.
But it is worth getting rid of the category of goods in the CCC.
3. Using a synthetic approach to the definition of categories.
For each criterion is determined by the weighting factor (VC), depending on its importance for the purpose of the analysis.
For example, for the analysis, Turnover is more important than the Quantity of sales of goods, and the Number of sales is more important than Entering checks.
For each product, a synthetic indicator is calculated.
Further, it is necessary to conduct a ranking of the results.
This approach allows one number to characterize each heading included in the classification and to conduct the ABC analysis as if only one criterion were used.
Interpretation. The results of the ABC analysis should be carefully studied, it is not necessary to make hasty decisions.
The idea of a classic ABC analysis in any case remains unchanged - the distribution of goods by category for further work. The analysis allows to determine the goods that require maximum attention of marketers, category managers who manage the quality impact on the trading network, while limiting the area of management to the desired minimum.
The number of category A is always minimal, category C is maximum. At the same time, category A is a priority in terms of service and work with it. Category B has a standard level of service, category C - if goods are not removed from the range, then they have the least level of service and attention.
Products of the main range and products dropped out of it. In the main range of products sold at least 2 times a week for the selected period for analysis. Products that for some reason have become sold less often 2 times a week fall out of the main range. This may be elite, new, seasonal or out of stock items. ABC analysis makes sense to carry out the main range. And on the goods dropped out from the main range, it is necessary to pay attention and identify the cause of sales drops.
Promotional items. If for the period taken for ABC analysis, promotions were held in your sales network or in a separate store, then sales results of promotional items can significantly affect the accuracy of the analysis. Here it is important for the marketer to decide whether to exclude the goods falling under the stock from the data set for analysis, or to make a certain amendment for them depending on the conditions of the action.
Elite goods. Goods that are not included in the main store or network assortment (they are sold less than 2 times a week or even much less often), but with sales they can bring considerable income. They can be included in the data set for ABC analysis, where they are likely to fall into category C. But such products are important for the store's assortment, which means that they cannot be displayed. At the same time, due to the low frequency of sales, it is inappropriate to allocate a place in a warehouse warehouse for elite goods, it is easier to organize their purchases upon sale.
New items. It is clear to anyone that no matter how advertised a new product is, at first, its sales will be significantly lower than the proven brands. But at the same time, new products are absolutely necessary in any store. There are solutions.
New products are not included in the analysis and can not be withdrawn from the range of the first few months of sales.
If you exclude new products from the data set too technically, they are labeled “New”, and when interpreting the results of ABC analysis, such products are not subject to reduction.
Another option is the inclusion of new products in category A automatically. What is he bad? The fact that a certain number of new products in category A, shifts other products in the ranking below.
Missing items. For various reasons, sometimes goods may not be on store shelves or in stock. That is, in principle, it could be sold, and there was a demand, but in the data for the analysis of sales of goods there is no. Therefore, it is useful when interpreting ABC analysis to know the date of the last arrival of the goods in the store.
In the supermarket chain of 17 stores there were certain problems with the Alcoholic beverages group. Products of this group sold well and generated revenue, but occupied a significant shelf space of stores. Also, it was necessary to determine the brand and individual products for the planning of autumn promotions. We conducted ABC analysis using the BI Datawiz.io service.
So, the purpose of the analysis is the selection of goods for promotions, the reduction of the range of product groups.
The object of analysis is the main assortment of the “Alcohol” group throughout the distribution network.
The time period is 2 months.
The analysis will be carried out using a parallel approach based on 2 criteria : Turnover and Number of sales. The choice of these criteria is directly dependent on the purpose of the analysis. The manager of the trading network needed to reduce the number of goods occupying space on the shelves and not significantly affecting the turnover of the product group as a whole.
Analysis of the main assortment will allow us to obtain more accurate data without taking into account seasonal or missing goods for sale.
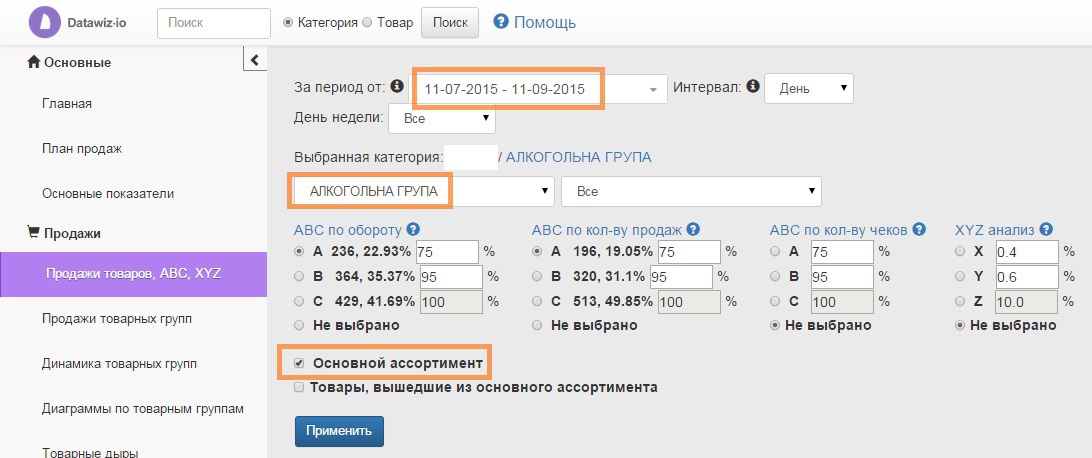
Percentage ratio.
In this variant, the optimal ratio will be 75-95-100 according to the selected criteria due to the specificity of the product group.
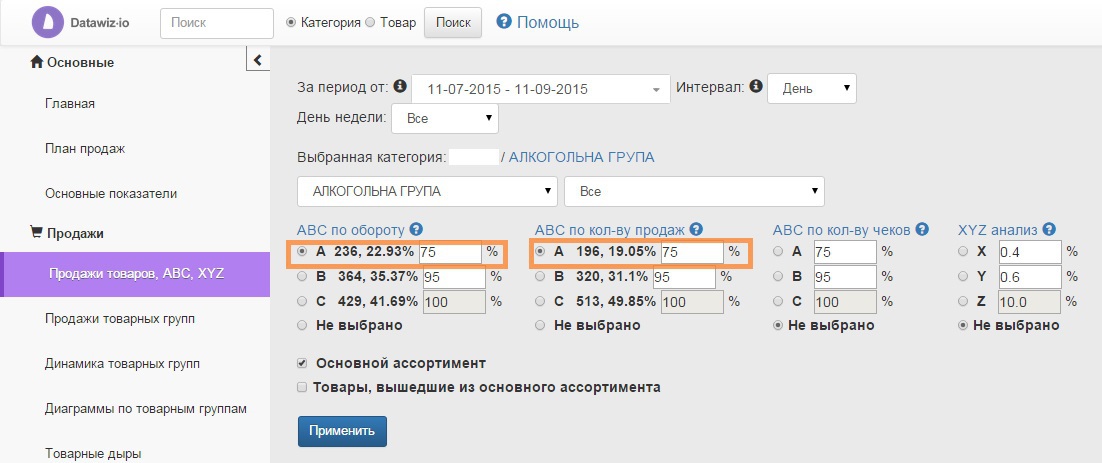
In the screenshot below we see the number of commodity items that are included in each category A, B and C and the percentage of the category of the total index.
For greater clarity, the ratio of categories we consider them in the diagram.
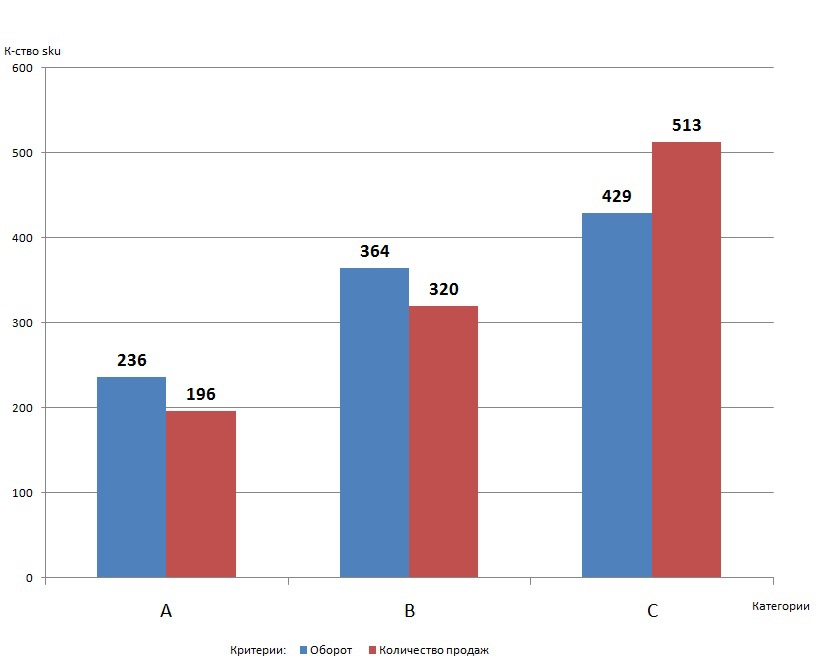
As you can see, category A is the smallest in terms of both turnover and number of sales, while category C is the largest - where you can get goods for reduction.
Interpretation. Let's analyze the results.
Analysis is possible both with the help of tabular data and with the help of visualizations.
The first goal is the selection of products for promotions.
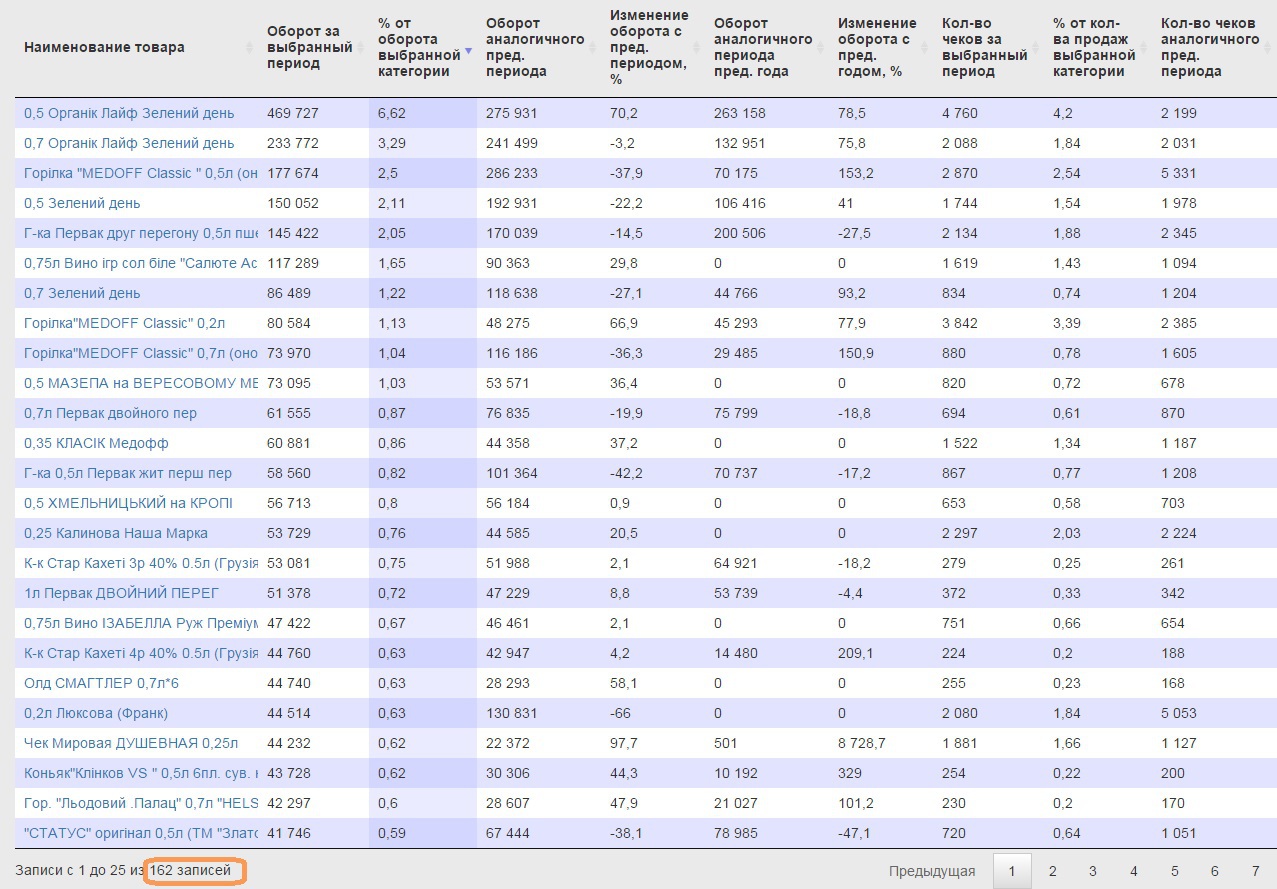
The category AA on the turnover and the number of sales fall 162 items of goods, as seen on the screenshot below.
We can visualize data for each category.
For example, now for building visualization we used the following indicators:
the horizontal axis is the number of sales for the selected period;
vertical axis - turnover for the selected period;
diameter of the circle -% of the turnover of the selected category. There are other options for plotting, depending on the objectives of the ABC analysis.
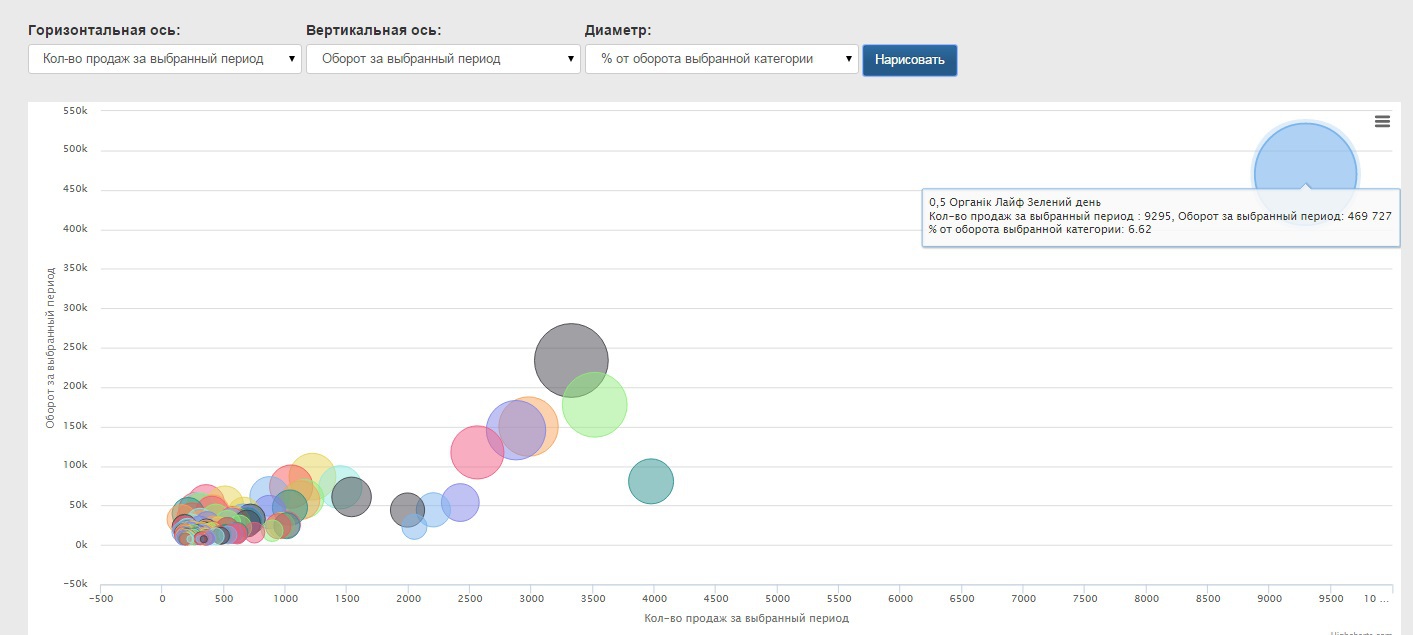
As you can see, GreenDay Organic Life is the leader in sales in this retail chain with a significant margin in the AA category.
The best-selling brands are GreenDay and MEDOFF. Work with suppliers of such goods should be very well established, it is they who supply us with goods leaders. It is possible to create special best conditions for them, additional space on the shelves, organization of promotional activities, etc.
But, we consider it inexpedient to carry out promotions for products of category AA, and these goods are sold excellently without a share.
In this case, it is better to plan the promotion for the category AB, which significantly affects the turnover of stores, and the number of sales of goods of the group will increase as a result of promotional activities.
The results of the selection of products of category AB are visible in the figure below.
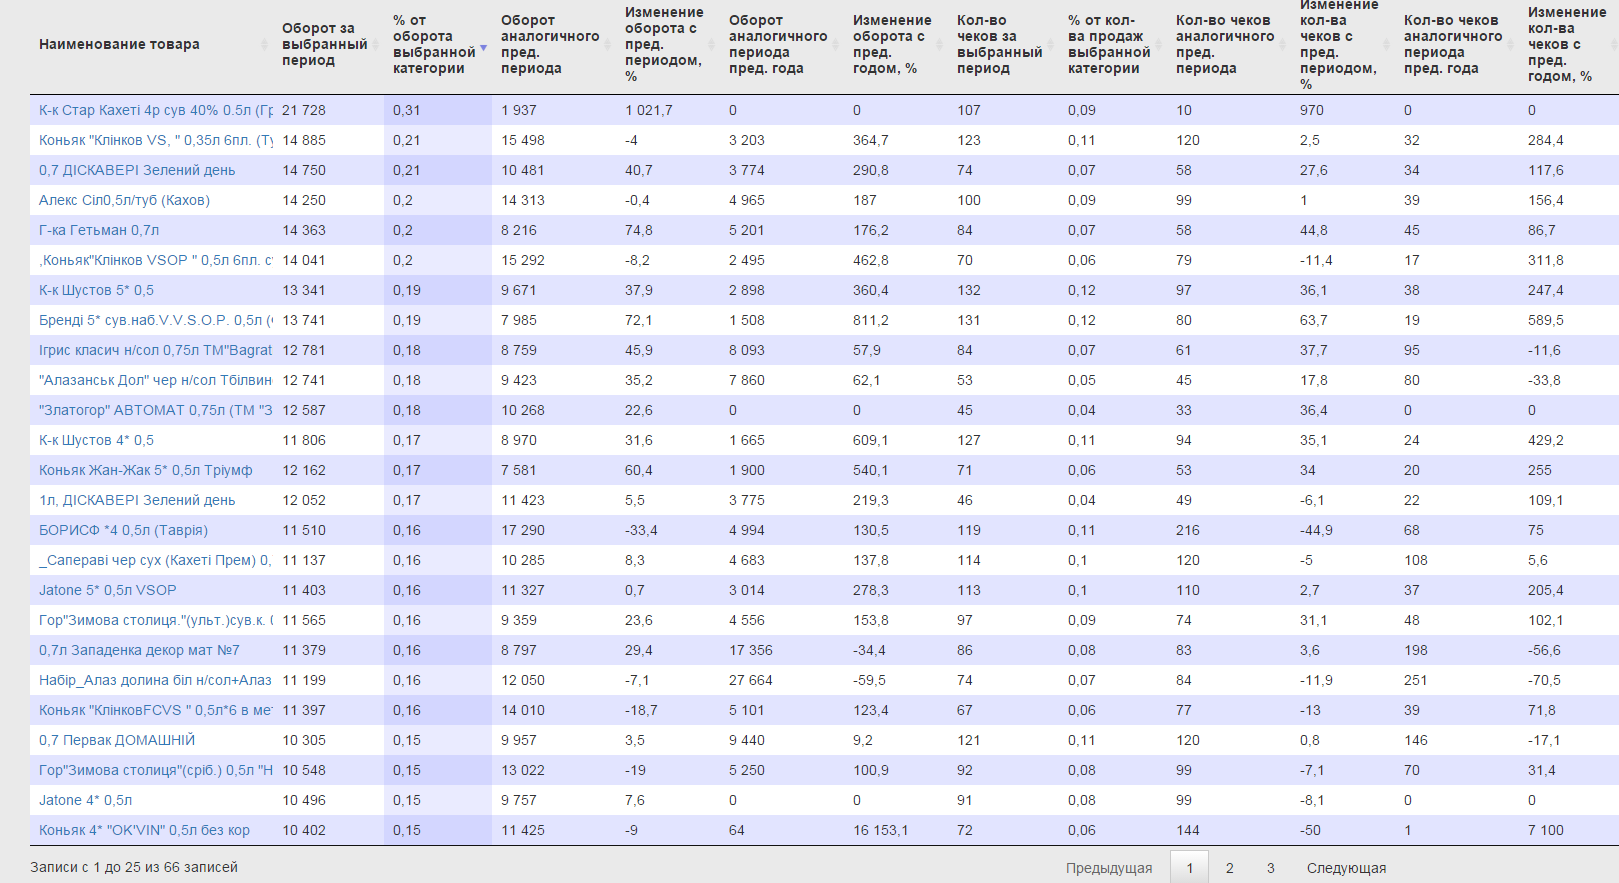
As can be seen, the most successful will be promotions for Georgian cognacs and wines, as well as brandy “Blades”.
The second goal of our analysis was to optimize the range and disposal of non-selling goods . We will deal with the category of SS.
Here visualization simplifies the analysis even more. As we remember, elite products can be included in this group. For example, the picture below is Scotch whiskey with a price above 800 UAH. for a bottle for 2 months, it sold only 2 times, but it brought a significant profit.
But goods on 2 axes tending to zero and with a small circle diameter that do not affect the total turnover should be removed from the range - they are not sold and only occupy space on the shelves. As an example, in the picture the wine “The sun in the glass” - sold only 2 times in 2 months at 32 UAH. per bottle and therefore does not affect the turnover.
Thus, ABC analysis allowed us to distribute the products included in the Alcoholic beverages group into 9 different categories and develop recommendations for the trading network for optimizing the assortment:
Work done, and you can note! Moreover, we are now aware of hot trends.
But let's talk a little about something else.
')
In retail, logistics, warehouse management and inventory there is such a thing as ABC analysis . About him already written many theoretical publications. And everything seems to be relatively simple and understandable, but is it really so?
When a category manager or marketer of a trading network comes close to conducting an ABC analysis, he inevitably has a whole bunch of questions, hesitations and doubts. It is with them that we will work in this article!
Let's go over the algorithm of actions in the ABC analysis in grocery retail chains, exceptions to the rules that must be taken into account, we will show an example of analyzing the commodity group of Alcoholic beverages (yes, that's half a liter).
If someone hears ABC analysis for the first time, here’s
how it is done.
ABC analysis is the most common assortment study method. It is based on the Pareto law , applicable to many aspects of life. Its essence for retail is that 20% of goods provide 80% of efficiency, and the remaining 80% of goods - only 20%.
ABC analysis is a method by which you can determine the contribution of each product to the turnover and profit of a store, distribute goods into categories for effective management of the assortment.
For this you need:
Select categories, for example
category A - priority goods, bringing up to 80% of the total turnover;
Category B - ordinary goods, from 80% to 95% of the total turnover;
Category C - goods-outsiders, from 95% to 100% of the total turnover (all that remains).
We define the boundaries of categories, which should differ significantly among themselves.
ABC analysis is a method by which you can determine the contribution of each product to the turnover and profit of a store, distribute goods into categories for effective management of the assortment.
For this you need:
- Sort all products by the selected criteria (for example, turnover).
- Calculate how many percent of the turnover of each product is the total turnover of the commodity group.
- Calculate the cumulative (or cumulative) percentage by adding the percentage to the sum of the previous percent.
| Turnover of goods | The percentage of turnover of goods from the total turnover | Cumulative percentage | |
|---|---|---|---|
| Item 1 | 100 UAH | ten% | ten% |
| Item 2 | 92 UAH | 9.2% | 10% + 9.2% = 19.2% |
| Product 3 ... | 80 UAH | eight% | 19.2% + 8% = 27.2% |
Select categories, for example
category A - priority goods, bringing up to 80% of the total turnover;
Category B - ordinary goods, from 80% to 95% of the total turnover;
Category C - goods-outsiders, from 95% to 100% of the total turnover (all that remains).
We define the boundaries of categories, which should differ significantly among themselves.
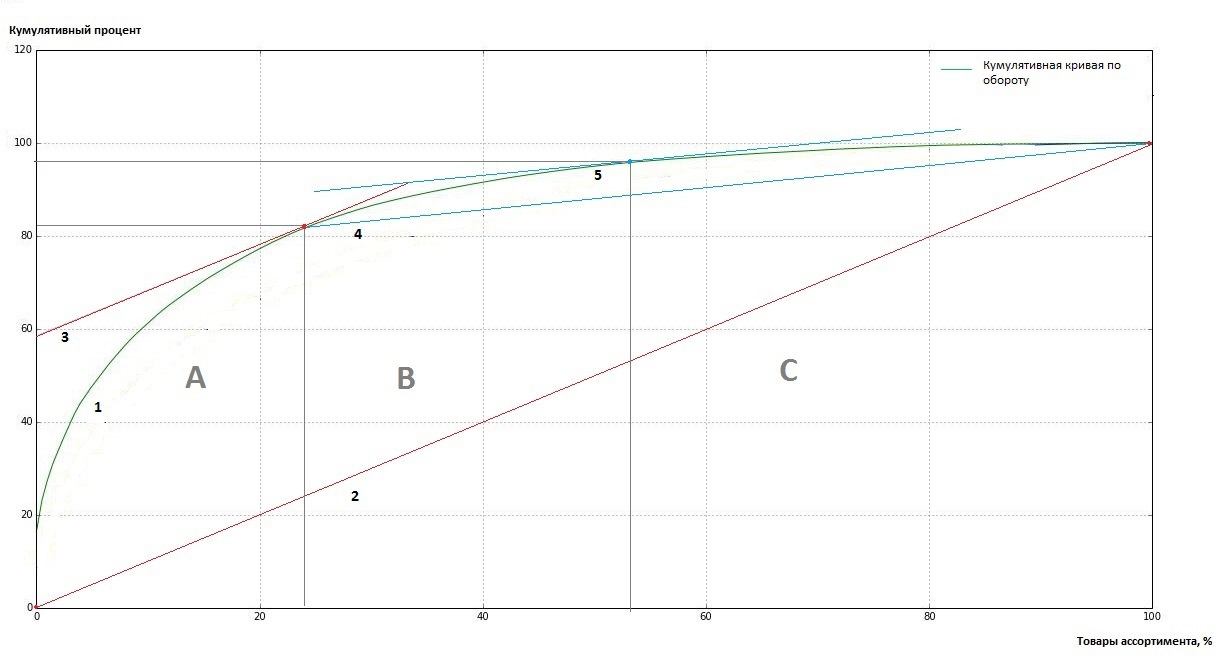
- Build a cumulative curve.
- Connect the straight extreme points of the curve.
- Find the point of tangency of the line parallel to the obtained straight line. This point will define the boundaries of category A, for which the nature of the accumulation of the quality criterion is homogeneous.
- Similarly, we connect with a straight line the point of the border of category A and the extreme point of the curve.
- Find the point of tangency of the line parallel to the obtained straight line and determine the boundaries of category B.
When conducting an ABC analysis, the first thing that needs to be done is to determine
How, Why and For what will we use it?
It is important to answer such questions:
- What is the purpose of the analysis?
- What will be the objects of analysis?
- What are the criteria?
- What percentage will be optimal for ABC analysis?
- What time period is it worth analyzing? and with what frequency?
- How to divide products into A, B, C categories?
- What will be the interpretation and actions based on the results of the analysis?
Go through the points.
The purpose of the analysis depends on the existing problem or, but why do we carry it out at all? Any analyst serves to achieve some goal, ABC analysis is by no means an exception. A clear vision of the goal is already half the success of marketing activity.
The goal predicts what we can achieve through the use of ABC analysis, so it may differ even depending on who carries out the analysis. Category managers most often analyze sales of goods, store managers - turnover, marketers - the inclusion of goods in customer checks.
The most popular goals are:
- identify the groups of goods that bring the most profit;
- optimize the range;
- highlight the goods leaders and outsiders;
- manage inventory and supplies;
- compare figures with the previous period, analyze the changes.
Reach the goal can be using different objects of analysis . They can be - supplies, warehouse stocks, product range of a single store or the entire distribution network, goods that are included in a certain product group or category.
Here it is necessary to approach the analysis carefully. For example, to optimize the assortment, analysis of the entire assortment of a store or network will yield practically nothing. After all, we cannot leave only bread, milk and alcohol in the store, although these groups will be the most popular. But in the context of a separate commodity group, you can easily track the products of group C (outsiders in terms of turnover and number of sales) from which you need to get rid of.
Criteria. Again, closely related to the object and purpose of the analysis.
The most common:
- turnover;
- revenue;
- yield;
- number of sales;
- number of checks, entry in checks - the frequency of purchases of goods.
The choice of only one criterion for analysis significantly limits the reliability of the results. As a rule, two or three criteria are used and cross-analysis is performed, as described in more detail below.
Percentage ratio. Unfortunately, the averaged values proposed by the Pareto principle do not always correspond to reality. In reality, a category manager or store manager, in determining the percentage, is guided, first of all, by his experience, objectives and analysis criteria, the specifics of the product group, store or retail network.
80-15-5,
70-20-10,
50-30-20,
and even 40-40-20, these are all possible variants of percentages of categories A, B and C.
A wide variation indicates a variety of situations and the impossibility of targeting the universal ratio of category boundaries. Thus, a category manager of a large retail chain can afford to withdraw a significant amount of category C products from the range; in any case, the store shelves will not be empty. Another thing is managing a small trading network of 2-3 stores, where the withdrawal of 100-200 goods will have a detrimental effect on the breadth of the presented range.
A period of time. It is often too expensive to conduct ABC analysis on the use of working time by marketers, category managers or store managers, and the results of such an analysis will not be obvious due to the cyclical nature of sales of goods by day of the week or season.
For example, the analysis of the entire product range can be carried out every six months to analyze which products and groups of goods are the most important and what has changed in comparison with the previous period.
Analysis of goods in each product group, as a rule, is carried out once in 2 months, options are possible once in 3 months. It all depends on the size of the range and capabilities of network analysts.
Division into A, B, C category.
When analyzing a merchant assortment of a store, a marketer can use 1 criterion — for example, the profitability of a product or product group, but the data obtained is not always useful enough.
Therefore, cross-analysis is applied according to several criteria. Yes, this approach is not simple, but using more criteria allows you to better see the existing situation. When carrying out several options are possible:
1. Sequential categorization.
It is worth using if the assortment of the product group is too large. First, the assortment is analyzed by the first criterion (for example, turnover), then each resulting category is analyzed again by the second criterion (the number of sales), etc. As a result, we get subcategories with a relatively small list of products with which it is convenient to work.
2. Parallel categorization.
We carry out the ABC analysis simultaneously (in parallel) according to some criteria, creating categories like AA, Sun, etc ...
Using 2 criteria, say, Revenue and Number of sales, we get already 9 categories:
| AA | AB | VA |
| BB | BC | CB |
| CC | AC | CA |
We use 3 criteria - 27 categories. For example:
| Revenue | Yield | Number of sales | |
|---|---|---|---|
| Item 1 | BUT | AT | BUT |
| Item 2 | BUT | BUT | BUT |
| Product 3 ... | WITH | AT | WITH |
This approach is more complex, gives a larger category of goods, but allows you to get extensive information about each category.
For example, using 3 criteria for parallel analysis, products that received AAA are the most important products for the retailer. They bring significant income, they are often bought, they bring revenue. So, they must be constantly available, with uninterrupted supplies and a good margin.
Products of categories , , are also quite important and it is worth working actively with them. For example, a product is included in category A in terms of revenue and profitability, and in category B in sales. It is necessary to find him the best place on the shelf, or to carry out promotional activities and the store will receive a significant profit. Another option is a product group with category A by the number of sales and profitability, and with category B by revenue. For products in this category, a revision of the pricing policy is possible, so a slight increase in the price of goods will lead to an increase in store revenue.
But it is worth getting rid of the category of goods in the CCC.
3. Using a synthetic approach to the definition of categories.
For each criterion is determined by the weighting factor (VC), depending on its importance for the purpose of the analysis.
For example, for the analysis, Turnover is more important than the Quantity of sales of goods, and the Number of sales is more important than Entering checks.
| Criterion | Weight coefficient |
|---|---|
| Turnover | 0.5 |
| Number of sales | 0.3 |
| Entering checks | 0.2 |
| Total | one |
For each product, a synthetic indicator is calculated.
| Kumul. % of turnover * VK | Kumul. % of the number of sales * VK | Kumul. % Check In * BK | Synthetic indicator | |
|---|---|---|---|---|
| Item 1 | 10% * 0.5 = 5 | 10% * 0.3 = 3 | 11% * 0.2 = 2.2 | 5 + 3 + 2.2 = 10.2 |
| Item 2 | 19.2% * 0.5 = 9.6 | 20% * 0.3 = 6 | 22% * 0.2 = 4.4 | 9.6 + 6 + 4.4 = 20 |
| Item 3 | 27.2% * 0.5 = 13.6 | 30% * 0.3 = 9 | 28% * 0.2 = 5.6 | 13.6 + 9 + 5.6 = 28.2 |
Further, it is necessary to conduct a ranking of the results.
This approach allows one number to characterize each heading included in the classification and to conduct the ABC analysis as if only one criterion were used.
Interpretation. The results of the ABC analysis should be carefully studied, it is not necessary to make hasty decisions.
The idea of a classic ABC analysis in any case remains unchanged - the distribution of goods by category for further work. The analysis allows to determine the goods that require maximum attention of marketers, category managers who manage the quality impact on the trading network, while limiting the area of management to the desired minimum.
The number of category A is always minimal, category C is maximum. At the same time, category A is a priority in terms of service and work with it. Category B has a standard level of service, category C - if goods are not removed from the range, then they have the least level of service and attention.
What is worth remembering or exceptions to the rules
Products of the main range and products dropped out of it. In the main range of products sold at least 2 times a week for the selected period for analysis. Products that for some reason have become sold less often 2 times a week fall out of the main range. This may be elite, new, seasonal or out of stock items. ABC analysis makes sense to carry out the main range. And on the goods dropped out from the main range, it is necessary to pay attention and identify the cause of sales drops.
Promotional items. If for the period taken for ABC analysis, promotions were held in your sales network or in a separate store, then sales results of promotional items can significantly affect the accuracy of the analysis. Here it is important for the marketer to decide whether to exclude the goods falling under the stock from the data set for analysis, or to make a certain amendment for them depending on the conditions of the action.
Elite goods. Goods that are not included in the main store or network assortment (they are sold less than 2 times a week or even much less often), but with sales they can bring considerable income. They can be included in the data set for ABC analysis, where they are likely to fall into category C. But such products are important for the store's assortment, which means that they cannot be displayed. At the same time, due to the low frequency of sales, it is inappropriate to allocate a place in a warehouse warehouse for elite goods, it is easier to organize their purchases upon sale.
New items. It is clear to anyone that no matter how advertised a new product is, at first, its sales will be significantly lower than the proven brands. But at the same time, new products are absolutely necessary in any store. There are solutions.
New products are not included in the analysis and can not be withdrawn from the range of the first few months of sales.
If you exclude new products from the data set too technically, they are labeled “New”, and when interpreting the results of ABC analysis, such products are not subject to reduction.
Another option is the inclusion of new products in category A automatically. What is he bad? The fact that a certain number of new products in category A, shifts other products in the ranking below.
Missing items. For various reasons, sometimes goods may not be on store shelves or in stock. That is, in principle, it could be sold, and there was a demand, but in the data for the analysis of sales of goods there is no. Therefore, it is useful when interpreting ABC analysis to know the date of the last arrival of the goods in the store.
We give an example of the ABC analysis.
In the supermarket chain of 17 stores there were certain problems with the Alcoholic beverages group. Products of this group sold well and generated revenue, but occupied a significant shelf space of stores. Also, it was necessary to determine the brand and individual products for the planning of autumn promotions. We conducted ABC analysis using the BI Datawiz.io service.
So, the purpose of the analysis is the selection of goods for promotions, the reduction of the range of product groups.
The object of analysis is the main assortment of the “Alcohol” group throughout the distribution network.
The time period is 2 months.
The analysis will be carried out using a parallel approach based on 2 criteria : Turnover and Number of sales. The choice of these criteria is directly dependent on the purpose of the analysis. The manager of the trading network needed to reduce the number of goods occupying space on the shelves and not significantly affecting the turnover of the product group as a whole.
Analysis of the main assortment will allow us to obtain more accurate data without taking into account seasonal or missing goods for sale.
Percentage ratio.
In this variant, the optimal ratio will be 75-95-100 according to the selected criteria due to the specificity of the product group.
In the screenshot below we see the number of commodity items that are included in each category A, B and C and the percentage of the category of the total index.
For greater clarity, the ratio of categories we consider them in the diagram.
As you can see, category A is the smallest in terms of both turnover and number of sales, while category C is the largest - where you can get goods for reduction.
Interpretation. Let's analyze the results.
Analysis is possible both with the help of tabular data and with the help of visualizations.
The first goal is the selection of products for promotions.
The category AA on the turnover and the number of sales fall 162 items of goods, as seen on the screenshot below.
We can visualize data for each category.
For example, now for building visualization we used the following indicators:
the horizontal axis is the number of sales for the selected period;
vertical axis - turnover for the selected period;
diameter of the circle -% of the turnover of the selected category. There are other options for plotting, depending on the objectives of the ABC analysis.
As you can see, GreenDay Organic Life is the leader in sales in this retail chain with a significant margin in the AA category.
The best-selling brands are GreenDay and MEDOFF. Work with suppliers of such goods should be very well established, it is they who supply us with goods leaders. It is possible to create special best conditions for them, additional space on the shelves, organization of promotional activities, etc.
But, we consider it inexpedient to carry out promotions for products of category AA, and these goods are sold excellently without a share.
In this case, it is better to plan the promotion for the category AB, which significantly affects the turnover of stores, and the number of sales of goods of the group will increase as a result of promotional activities.
The results of the selection of products of category AB are visible in the figure below.
As can be seen, the most successful will be promotions for Georgian cognacs and wines, as well as brandy “Blades”.
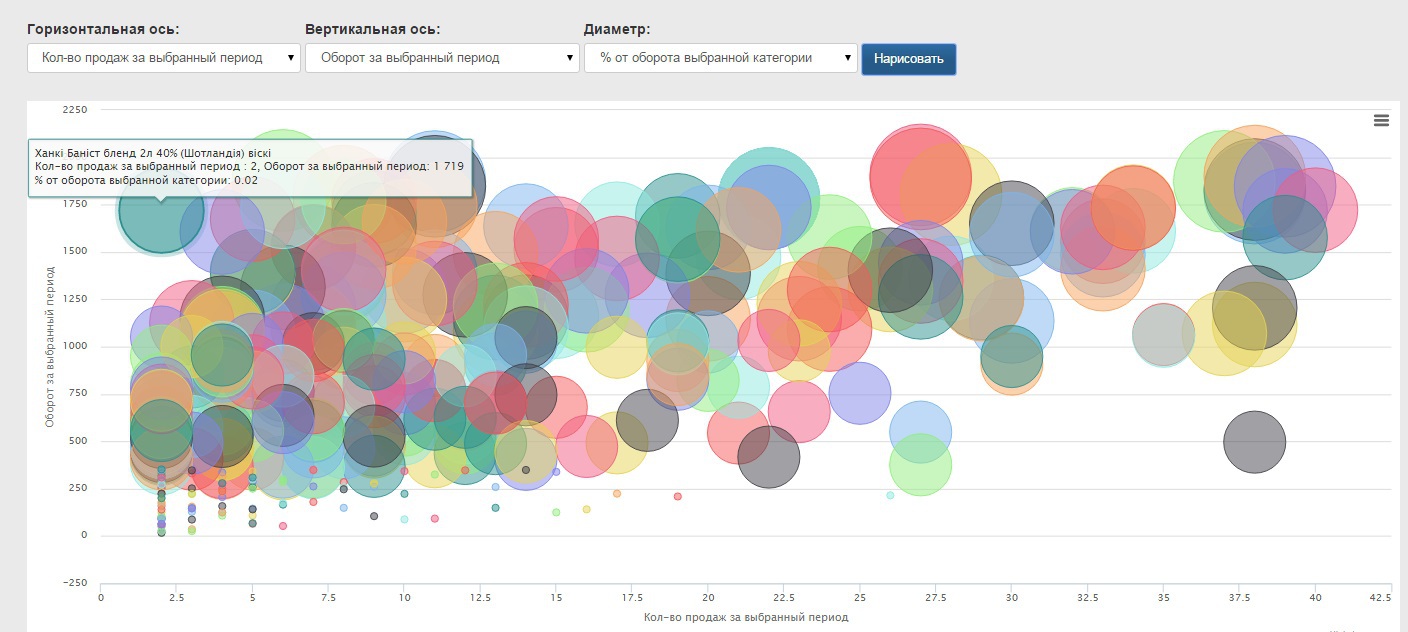
The second goal of our analysis was to optimize the range and disposal of non-selling goods . We will deal with the category of SS.
Here visualization simplifies the analysis even more. As we remember, elite products can be included in this group. For example, the picture below is Scotch whiskey with a price above 800 UAH. for a bottle for 2 months, it sold only 2 times, but it brought a significant profit.
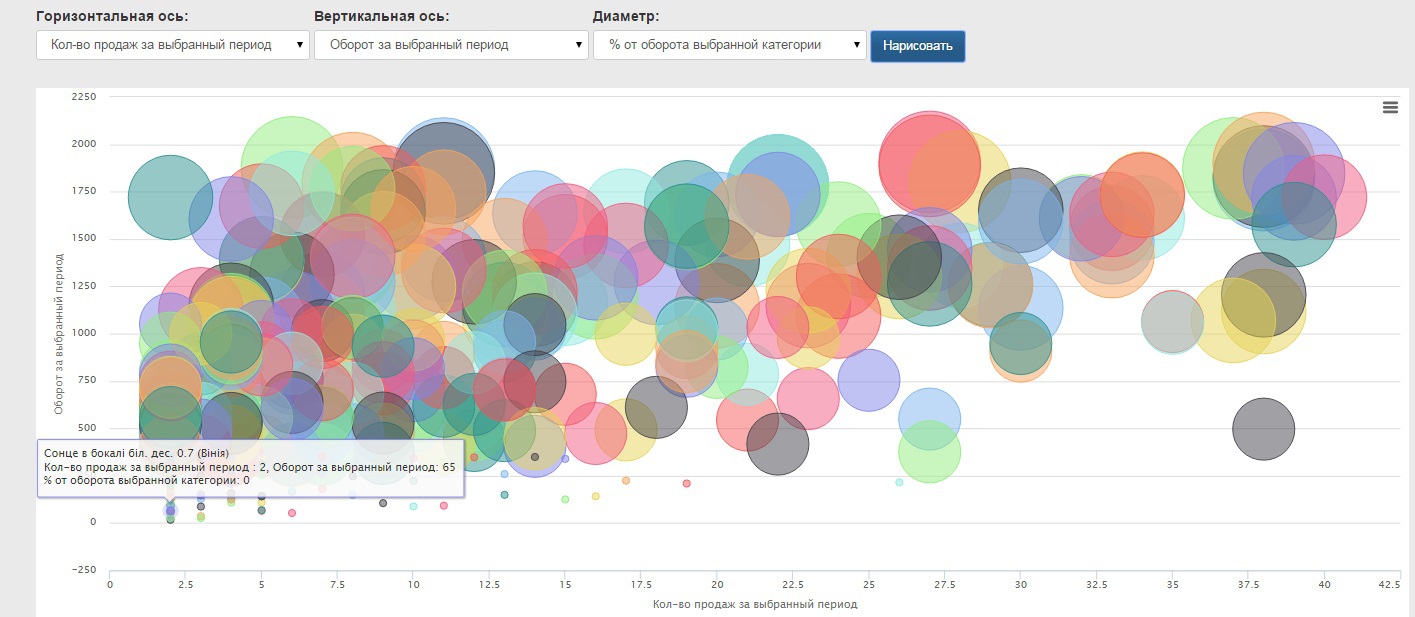
But goods on 2 axes tending to zero and with a small circle diameter that do not affect the total turnover should be removed from the range - they are not sold and only occupy space on the shelves. As an example, in the picture the wine “The sun in the glass” - sold only 2 times in 2 months at 32 UAH. per bottle and therefore does not affect the turnover.
Thus, ABC analysis allowed us to distribute the products included in the Alcoholic beverages group into 9 different categories and develop recommendations for the trading network for optimizing the assortment:
- category AA - goods-leaders, the category of the highest priority, products must always be available, careful control of inventory levels is necessary;
- category AB - products that will bring maximum efficiency during promotions;
- the categories BA, BB, VS, SV are middle-class goods, the average level of inventory management and placement on the shelves;
- CC category - outsider goods, a detailed analysis of the category and removal from the range of the most inefficient products.
Work done, and you can note! Moreover, we are now aware of hot trends.
Source: https://habr.com/ru/post/267175/
All Articles