Log Analysis with Hadoop / Python
Hi, Habr! In this post, I would like to tell you about how we, the Laboratory of New Professions, together with the Data-centric Alliance company, have been able to design several laboratory works devoted to the processing and analysis of web logs. These labs are key in the first case of our Big Data Specialist educational program and are based on DMP Facetz.DCA classroom data. My name is Artem Pichugin, and I am her coordinator.
Imagine you are a company selling cars. To show car advertising? Which sites? So that inexpensive and effective? It would seem that the answer is obvious: users who go to the pages of buying cars on the websites of companies, as well as on Avito type message boards and so on.
But therein lies the problem: it is in this place, exactly these users want to show ads - great demand for a small number of well-known sites, such shows will be expensive! There is a second option: to find less popular sites on which the users you are interested in (looking at the car purchase pages), and to display ads on these sites. In this case, the cost of displaying advertising will be lower, despite the fact that the conversion may remain quite good. There may even be a situation when a person has not yet looked at the topic of buying a car, but only thought about it - and the first thing he will see is your offer!
')
A similar problem is solved by companies-players of the RTB-market, which is now experiencing active growth (the other day the GetIntent platform attracted a round of investment of $ 1 million, at the beginning of the year Sberbank bought the Segmento platform, and new players appear like mushrooms after the rain). The analytical component of the RTB platform, which is responsible for collecting user information, is performed by the DMP system. Own DMPs are necessary not only for RTB companies, but also for everyone who has a large amount of data (for example, banks, telecoms, Internet portals), as well as anyone who wants to enrich their data by purchasing external data in the format of web logs. At the heart of the DMP-system is working with large amounts of data about users visiting sites based on logs. These logs are carefully collected with the involvement of many partners.
Disclaimer! Below we want to describe a step-by-step script for processing and analyzing logs using Hadoop and Python, which, in a simplified form, repeat the work of a key component of a DMP system. We use this scenario while learning how to process and analyze big data in the Laboratory for New Professions. When designing this scenario, we tried to be as close as possible to solving a specific business problem of building a DMP system. Course listeners perform these jobs with real data on a Hadoop cluster from 4 to 20 servers.
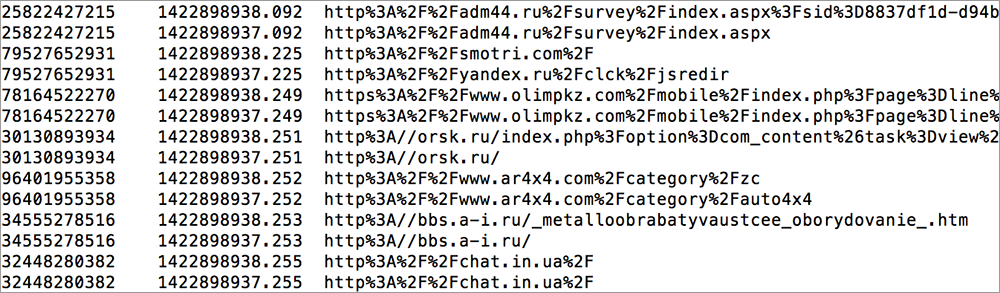
So, how can you use logs to optimize the display of advertising (seemingly: userid, url, timestamp - mortal boredom, just look)? For this you need to do several operations.
Given: several terabyte logs of site visits.
What are we doing:
We observe that in the top of such sites there are sites “preparation for traffic rules”, sites of driving schools. You say - this is an obvious conclusion, it was possible to guess so without any weblogs. Then answer - what? Which sites of driving schools and training for traffic rules need to advertise Lada Kalina? And the Ford Focus? And Mercedes ML? It is at this stage that a deeper knowledge of the client is required, which the DMP system “supplies”, which is a bit lower.
In order to accomplish this seemingly simple task, you must already be able to work with Big Data tools and have access to data for analysis. In our case, the data was provided by DMP Facetz.DCA.
In the previous part, we identified users who are interested in cars, found which non-obvious sites they were on. Now how to understand what ads to show them? To do this, we need to learn more about the customer profile, his age, income level, and other characteristics that are important to us as a seller. Of course, the business is well aware of the socio-demographic profile of its customers and knows which of them are the best to offer Kalina, and to whom the Mercedes ML.
The task of a DMP system is to enrich the knowledge about each individual client by placing as many “tags” as possible - gender, age, income level, etc. (in particular, the Facetz.DCA system is able to allocate more than 2000 similar segments on the material of 650,000,000 cookies). Naturally, there is no detailed information about each person, so you have to restore the signs with a high level of accuracy using machine learning. At this stage, the elements of "rocket science" appear.
Within the program, students solve one of the most important tasks - the restoration of the gender and age category of the client according to the logs of his site visits.
So, we return to the final task - a few terabytes of site visits logs are given.
Task 1: for each userid, determine the probability that it is male or female.
Task 2 (extra difficulty): predict gender and age for specific customers.
The first stage of work is data cleaning and preprocessing.
The second stage is feature engineering.
This is the most interesting and creative stage of work - it is necessary to enrich the source data, add some additional properties (“features”) that will allow you to interpret a poor data format!
At this level, there are many approaches and there is no unambiguous "manuals" how to do it correctly. Several ideas on how the program participants approached the solution of this problem:
All these features will be the basis for the machine learning algorithm.
The last stage is the use of machine learning.
The next step is to apply machine learning to solve the problem. To solve the first problem, it is necessary to select the target variable - the degree of confidence of the classifier in the field of a specific userid. Each listener, having done preliminary work on data preprocessing and feature engineering, creates a prediction model that ultimately determines the value of the target variable for each user. This task is a classical binary classification problem, which is solved within the program using the Python stack, where most of the machine learning algorithms are already implemented, for example, in the classic scikit-learn library. An automatic verification script assesses the quality of the classifier by the AUC indicator.
The task with an additional level of complexity is closest to the real task of data scientists, who are developing an analytical engine for DMP systems. Listeners had to make predictions about the gender and age category of a particular person. If both variables are predicted correctly, then the given userid prediction is considered correct. At the same time, it was possible to make a prediction not for all users, but at its own discretion, choose 50%. Thus, the listener himself could sort people according to the level of confidence in the prediction, and then select the best half.
This is one of the differences from the usual academic problem, where often you have to predict a given parameter for all observations. In the business approach, we take into account that advertising costs money, so the advertiser tries to optimize costs and show advertising only to those about whom our level of confidence in prediction exceeds a given threshold value.
This stage of work turned out to be the most creative and demanding to apply common sense, systemic thinking and the ability to iteratively improve its solution.
What particularly surprised our listeners:
Task
Imagine you are a company selling cars. To show car advertising? Which sites? So that inexpensive and effective? It would seem that the answer is obvious: users who go to the pages of buying cars on the websites of companies, as well as on Avito type message boards and so on.
But therein lies the problem: it is in this place, exactly these users want to show ads - great demand for a small number of well-known sites, such shows will be expensive! There is a second option: to find less popular sites on which the users you are interested in (looking at the car purchase pages), and to display ads on these sites. In this case, the cost of displaying advertising will be lower, despite the fact that the conversion may remain quite good. There may even be a situation when a person has not yet looked at the topic of buying a car, but only thought about it - and the first thing he will see is your offer!
')
Log Analysis
A similar problem is solved by companies-players of the RTB-market, which is now experiencing active growth (the other day the GetIntent platform attracted a round of investment of $ 1 million, at the beginning of the year Sberbank bought the Segmento platform, and new players appear like mushrooms after the rain). The analytical component of the RTB platform, which is responsible for collecting user information, is performed by the DMP system. Own DMPs are necessary not only for RTB companies, but also for everyone who has a large amount of data (for example, banks, telecoms, Internet portals), as well as anyone who wants to enrich their data by purchasing external data in the format of web logs. At the heart of the DMP-system is working with large amounts of data about users visiting sites based on logs. These logs are carefully collected with the involvement of many partners.
Disclaimer! Below we want to describe a step-by-step script for processing and analyzing logs using Hadoop and Python, which, in a simplified form, repeat the work of a key component of a DMP system. We use this scenario while learning how to process and analyze big data in the Laboratory for New Professions. When designing this scenario, we tried to be as close as possible to solving a specific business problem of building a DMP system. Course listeners perform these jobs with real data on a Hadoop cluster from 4 to 20 servers.
Sequencing
So, how can you use logs to optimize the display of advertising (seemingly: userid, url, timestamp - mortal boredom, just look)? For this you need to do several operations.
Given: several terabyte logs of site visits.
What are we doing:
- With the simplest heuristics, we define “the right users”, for example, by the number of visits to the auto.ru site in a week or two. As a result, we obtain a list of necessary users.
- Now for each site we consider its attendance as necessary users and all users in general. And the proportion of "correct" from the number of all visitors to the site. At some sites it will be 0.01% (not enough for our target audience), and for some 5% (a lot of our target audience).
- We sort the sites by descending calculated index and select the top 300 sites where our target audience is located. See their eyes.
We observe that in the top of such sites there are sites “preparation for traffic rules”, sites of driving schools. You say - this is an obvious conclusion, it was possible to guess so without any weblogs. Then answer - what? Which sites of driving schools and training for traffic rules need to advertise Lada Kalina? And the Ford Focus? And Mercedes ML? It is at this stage that a deeper knowledge of the client is required, which the DMP system “supplies”, which is a bit lower.
Big Data Tools
In order to accomplish this seemingly simple task, you must already be able to work with Big Data tools and have access to data for analysis. In our case, the data was provided by DMP Facetz.DCA.
- Logs need to be stored somewhere - you can put them directly in HDFS, and in such a way that MapReduce can work well with them.
- It is necessary to be able to process these logs - sort by different parameters, find the top 100/300/1000 sites, determine the proportion of target users in the general traffic. Here we need the MapReduce paradigm and the ability to write distributed algorithms using:
- filtering (map-only jobs)
- optimization: map-join connections (using distributed cache)
- optimization: combiner applications (reducer implementation requirements)
- reduce-join
- search top-100 (single reducer) - Although this is true not only for Big Data, but for a large amount of data it becomes especially critical, it is necessary to build a competent process of data preprocessing.
Machine learning
In the previous part, we identified users who are interested in cars, found which non-obvious sites they were on. Now how to understand what ads to show them? To do this, we need to learn more about the customer profile, his age, income level, and other characteristics that are important to us as a seller. Of course, the business is well aware of the socio-demographic profile of its customers and knows which of them are the best to offer Kalina, and to whom the Mercedes ML.
The task of a DMP system is to enrich the knowledge about each individual client by placing as many “tags” as possible - gender, age, income level, etc. (in particular, the Facetz.DCA system is able to allocate more than 2000 similar segments on the material of 650,000,000 cookies). Naturally, there is no detailed information about each person, so you have to restore the signs with a high level of accuracy using machine learning. At this stage, the elements of "rocket science" appear.
Within the program, students solve one of the most important tasks - the restoration of the gender and age category of the client according to the logs of his site visits.
So, we return to the final task - a few terabytes of site visits logs are given.
Task 1: for each userid, determine the probability that it is male or female.
Task 2 (extra difficulty): predict gender and age for specific customers.
The first stage of work is data cleaning and preprocessing.
- Work with abnormal values
- Remove trash (technical visits)
- Normalize url (for example, with www and without www)
- Work with missing values (fill in if the timestamp or url is missing, or delete it completely if the userid is missing)
The second stage is feature engineering.
This is the most interesting and creative stage of work - it is necessary to enrich the source data, add some additional properties (“features”) that will allow you to interpret a poor data format!
At this level, there are many approaches and there is no unambiguous "manuals" how to do it correctly. Several ideas on how the program participants approached the solution of this problem:
- You can analyze the domain itself and group sites by it;
- You can download the narrative part of the page (title, keywords, meta descriptions) and analyze them;
- The hardest, but the deepest option is to follow the link and download the entire code of the page and try to determine the theme of the page;
- Another approach is to link user visits to sites in a chain and determine the logic in the sequence of transitions;
- Mobile domains (m.facebook.com) can become a separate feature, they can also be useful for determining the category of a user.
All these features will be the basis for the machine learning algorithm.
The last stage is the use of machine learning.
The next step is to apply machine learning to solve the problem. To solve the first problem, it is necessary to select the target variable - the degree of confidence of the classifier in the field of a specific userid. Each listener, having done preliminary work on data preprocessing and feature engineering, creates a prediction model that ultimately determines the value of the target variable for each user. This task is a classical binary classification problem, which is solved within the program using the Python stack, where most of the machine learning algorithms are already implemented, for example, in the classic scikit-learn library. An automatic verification script assesses the quality of the classifier by the AUC indicator.
The task with an additional level of complexity is closest to the real task of data scientists, who are developing an analytical engine for DMP systems. Listeners had to make predictions about the gender and age category of a particular person. If both variables are predicted correctly, then the given userid prediction is considered correct. At the same time, it was possible to make a prediction not for all users, but at its own discretion, choose 50%. Thus, the listener himself could sort people according to the level of confidence in the prediction, and then select the best half.
This is one of the differences from the usual academic problem, where often you have to predict a given parameter for all observations. In the business approach, we take into account that advertising costs money, so the advertiser tries to optimize costs and show advertising only to those about whom our level of confidence in prediction exceeds a given threshold value.
This stage of work turned out to be the most creative and demanding to apply common sense, systemic thinking and the ability to iteratively improve its solution.
What particularly surprised our listeners:
- Even simple algorithms give a good result on a fairly large sample.
- More important is the pre-processing of + feature engineering (generating "features" based on data) than building more complex algorithms or prediction models.
- An acceptable solution can be obtained in simple ways, however, improving prediction accuracy requires disproportionate efforts and the use of non-trivial approaches.
Source: https://habr.com/ru/post/267107/
All Articles