Simple Optimization Technique Using Intel System Studio
 In this article, we describe a simple optimization technique using the Intel Cilk Plus and the Intel C ++ compiler based on the results of a performance analysis conducted using the Intel VTune Amplifier. Intel System Studio 2015 contains the mentioned components used for this article.
• Intel VTune Amplifier - an integrated performance analysis tool that helps developers analyze complex code and quickly detect bottlenecks.
• The Intel C ++ compiler generates optimized code for IA-32 and Intel 64 architectures. It also provides various features that help developers improve the performance of their programs.
• Intel Cilk Plus is an extension of the C / C ++ language, which is part of the Intel C ++ compiler, which allows you to increase performance by parallelizing new or existing C or C ++ programs.
Editor's noteIn this post, the author uses the debug version of the application for profiling, which is not entirely correct, since the compiler’s optimizations are completely absent in this version. After automatic optimization, the application profile will change significantly, and you first need to do it. However, from the point of view of methodology, the whole process is described correctly, so we decided to publish this post.
Original corrected and translation too.
Original corrected and translation too.
Strategy
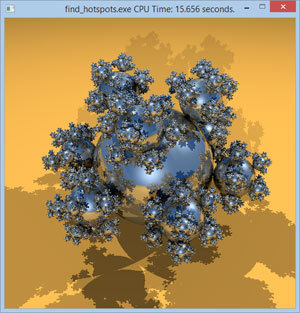
We use one of the code examples in the VTune tutorial tachyon_amp_xe as the target code for performance. This example displays an image of complex objects.
The performance optimization technique applicable to this example is described below.
- Run a simple bottleneck analysis or general analysis for a sample project in an integrated development environment, such as Visual Studio * 2013.
- Identify bottlenecks and other optimization options.
- Applying code changes to detected bottlenecks.
- Exploring compiler optimization options.
- Parallel code.
Optimization
Test environment
OS: Windows 8.1
Tool Kit: Intel System Studio for Windows Update 3
Development Environment: Microsoft Visual Studio 2013
')
Step 1. Interpretation and analysis of results data
Run a general analysis (if this is not possible, go to a simple analysis of bottlenecks) and detect bottlenecks. This sample code is created as an example for detecting bottlenecks and improving performance. Therefore, to work with it, you can use the sample page of the tachyon_amp_ex . After running the example in VTune, we get the following results.
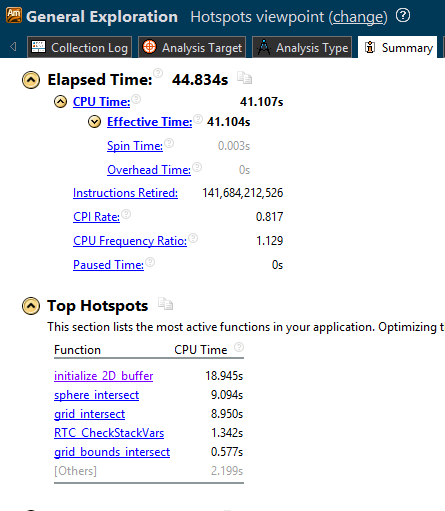
It can be seen that the time spent by this application was 44.834 seconds , and we will try to improve this basic level of performance.
In addition, in this application example, the initialize_2D_buffer function consumes the most time — 18.945 seconds , so it occupies the top line in the list of resource-intensive functions. We will try to optimize this particular function, which takes the most time.
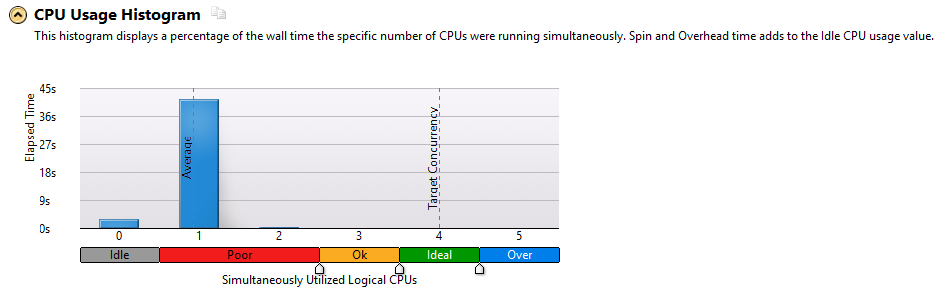
The CPU histogram shown above shows that in this example parallel processing is not used. Therefore, it is possible to use a multi-threaded architecture to speed up the processing of resource-intensive tasks.
Step 2. Algorithmic approach for the function initialize_2D_buffer
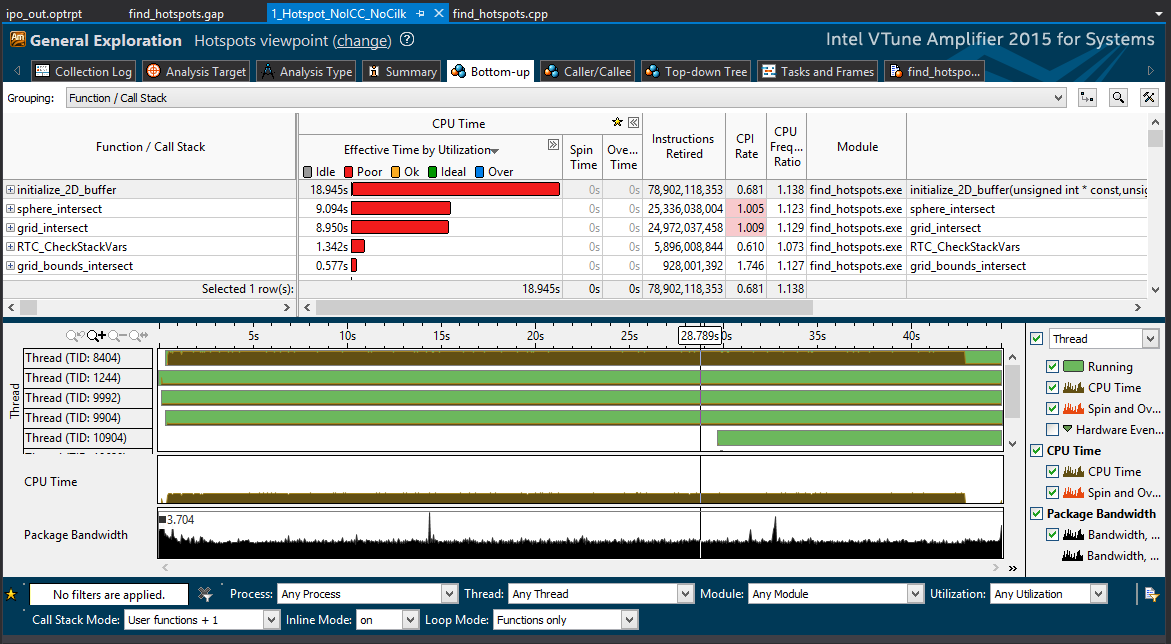
As we have seen, the execution of the initialize_2D_buffer function takes the most time, and this function involves the largest number of instructions. From this it follows that if somewhere and you can achieve increased productivity, then this is where the effect will be greatest.
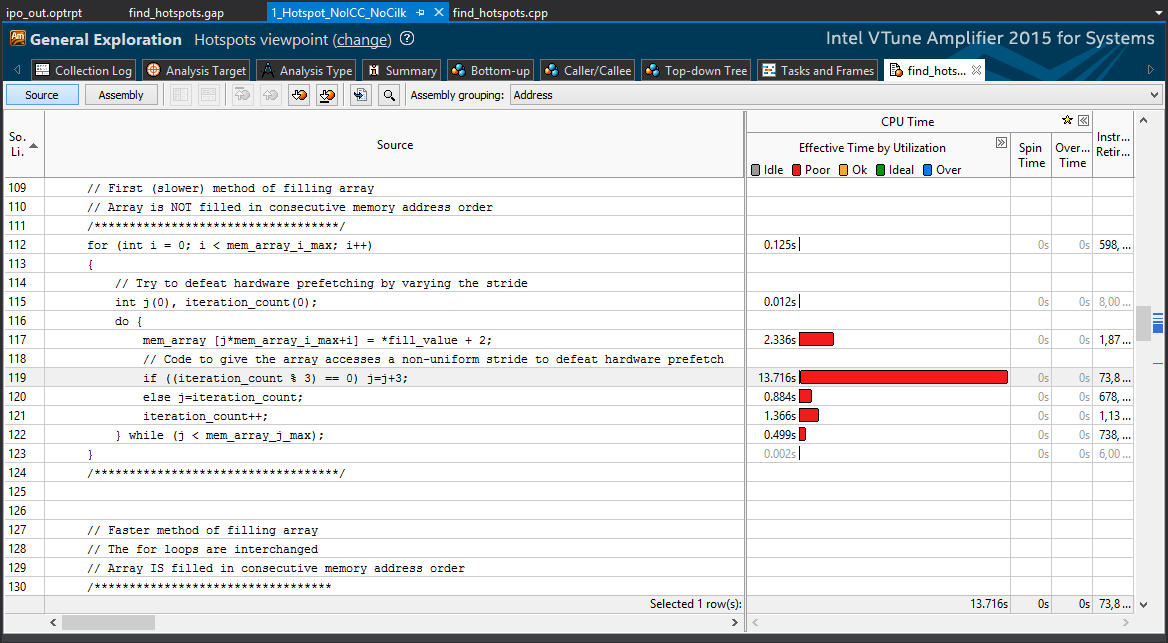
Double-click the function name. VTune Amplifier will open the source file on the very line where this function takes the most time. For the initialize_2D_buffer function, this string is used to initialize the memory array using scattered memory locations (not in a row). This sample code already has a faster alternative to the for loop.
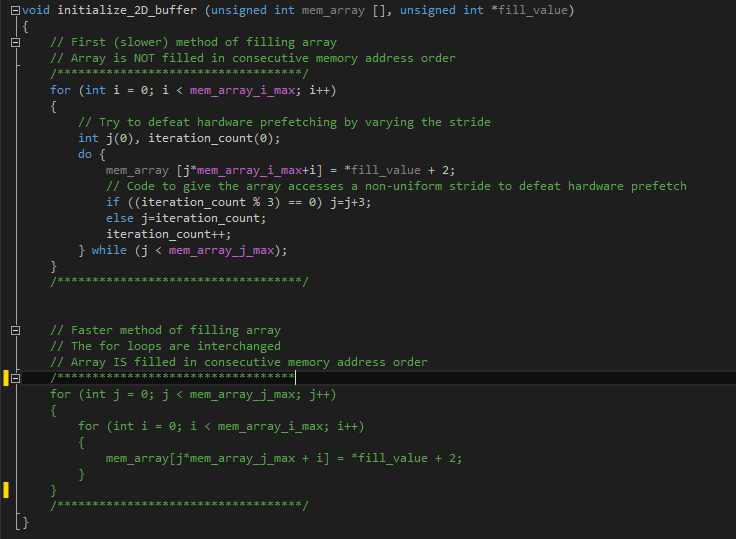
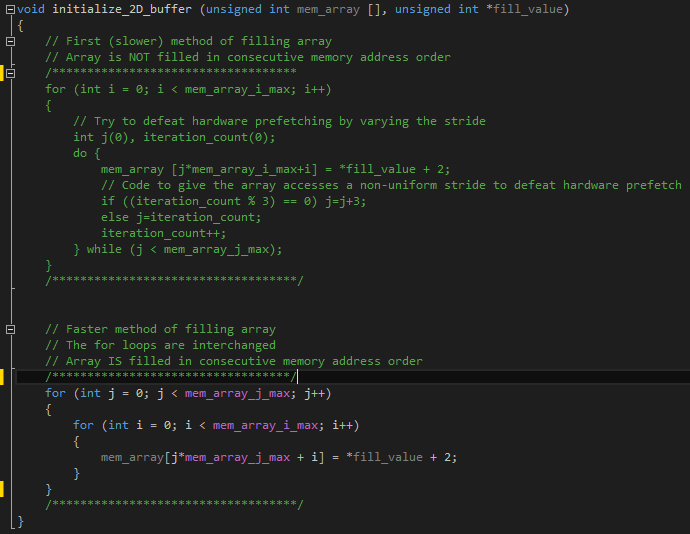
Below is the actual code of the initialize_2D_buffer function. The first for loop fills the target array inconsistently, while the second for loop performs the same task sequentially. You can improve performance by using the second for loop.
After replacing the for loop with the second one, we notice some performance gains. Consider the new results of profiling in VTune.
Compared with the previous result, the total execution time decreased from 44.834 to 35.742 seconds , that is, approximately 1.25 times . The operating time of our objective function was reduced from 18.945 to 11.318 seconds , that is, approximately 1.67 times .
Step 3. Compiler optimization options
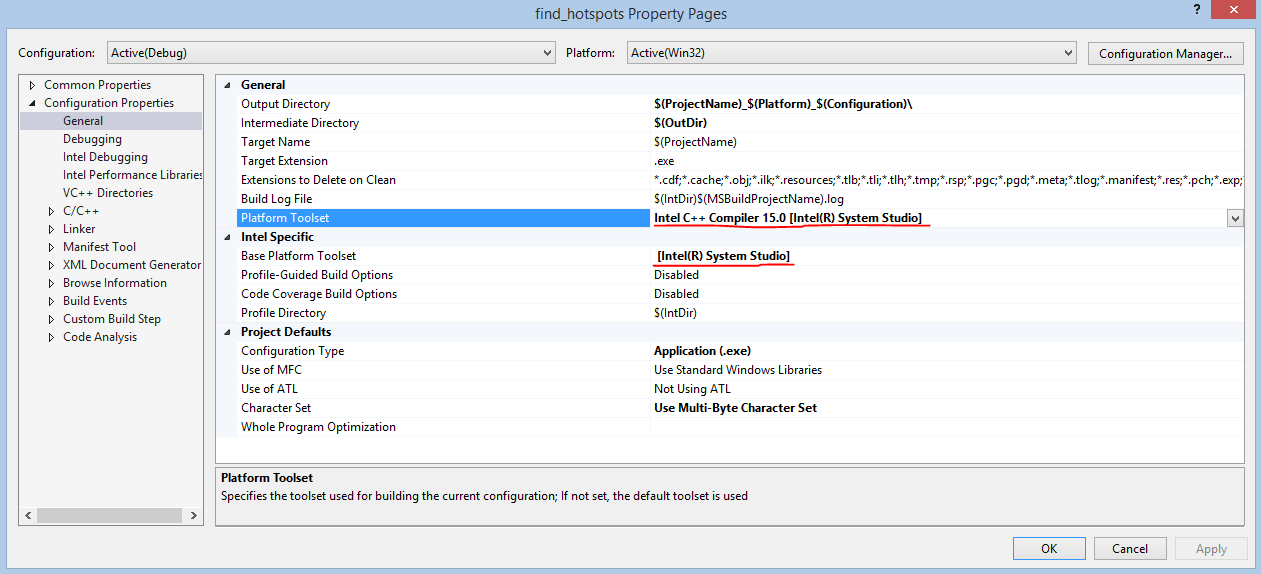
We often lose sight of the automatic optimization capabilities available in compilers. In this case, we simply enable Intel C ++ compiler built-in optimization, specifying the / O3 parameter when compiling. The same can be done with a graphical user interface. To use the “/ O3” parameter, you must first install the Intel C ++ compiler as the default compiler for this project.
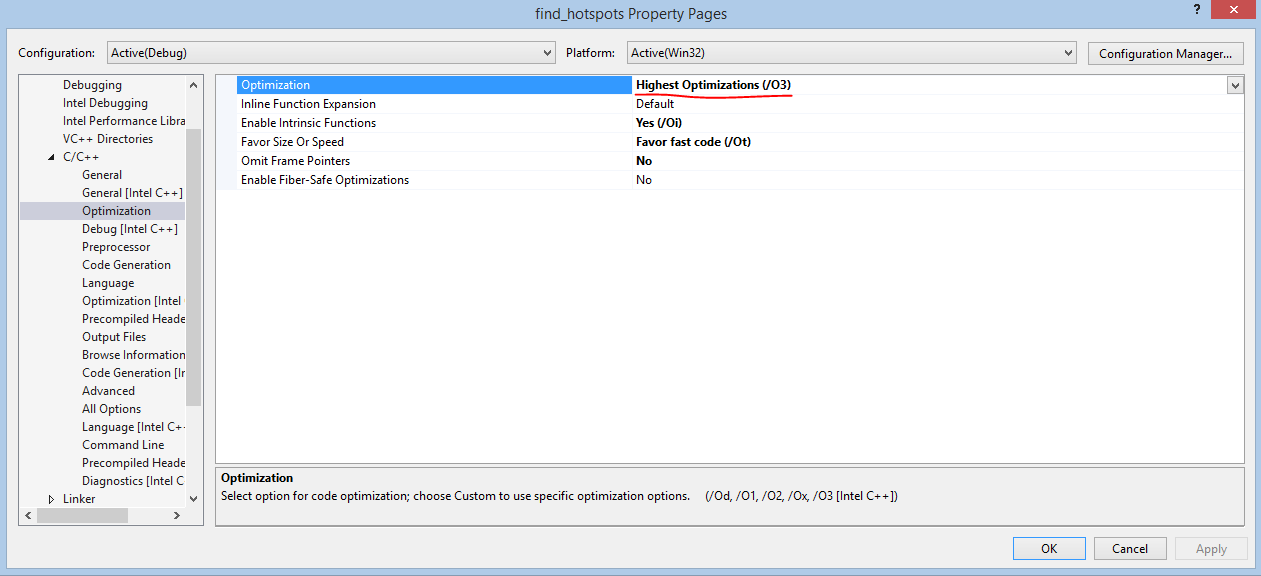
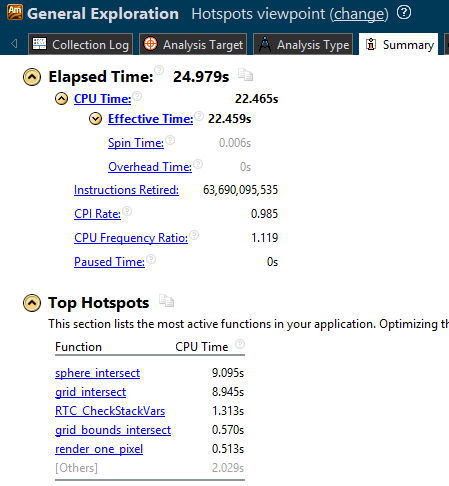
Adding this parameter alone is sometimes enough to significantly improve performance. For details on the optimization parameter / O [n], see here . New results: 24.979 seconds is enough to complete the task. First it took 35.742 seconds , that is, the program now works 1.43 times faster.
Step 4. Parallelizing with Cilk Plus
Parallel programming in itself is a vast area. There are many ways to implement parallel computing in the system, designed to work on multi-core platforms. This time we use Intel Cilk Plus - this is a fairly simple language extension that works very well.
When studying and analyzing code using VTune results, we can find a point at which the code repeatedly calls the most resource-intensive procedure. This is where the greatest potential for parallelization. Usually this is done as follows: we study the tree of the calling and called objects and return to the original narrow place until a fragment is found that is suitable for parallelization.
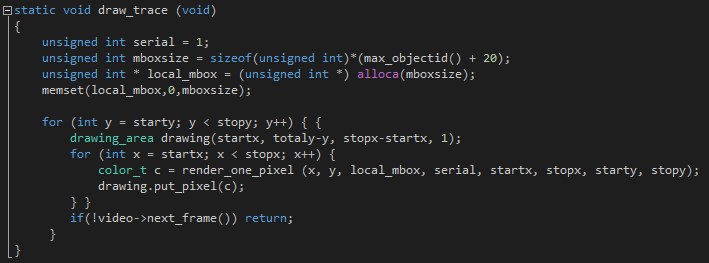
This time we will simply work with the draw_trace function in the find_hotspots.cpp file. Simply add cilk_for to parallelize the task we need: instead of one stream, several will be involved. After that, the work of four threads is clearly visible (the code was tested on a dual-core processor with hyper-trading technology), which simultaneously draw different lines.
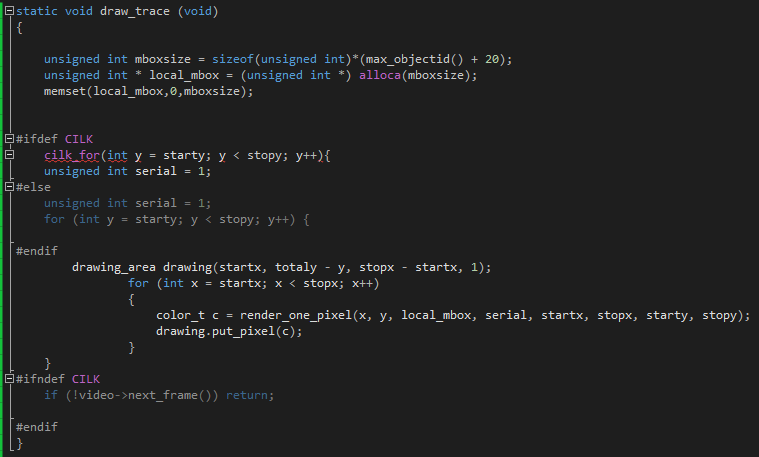

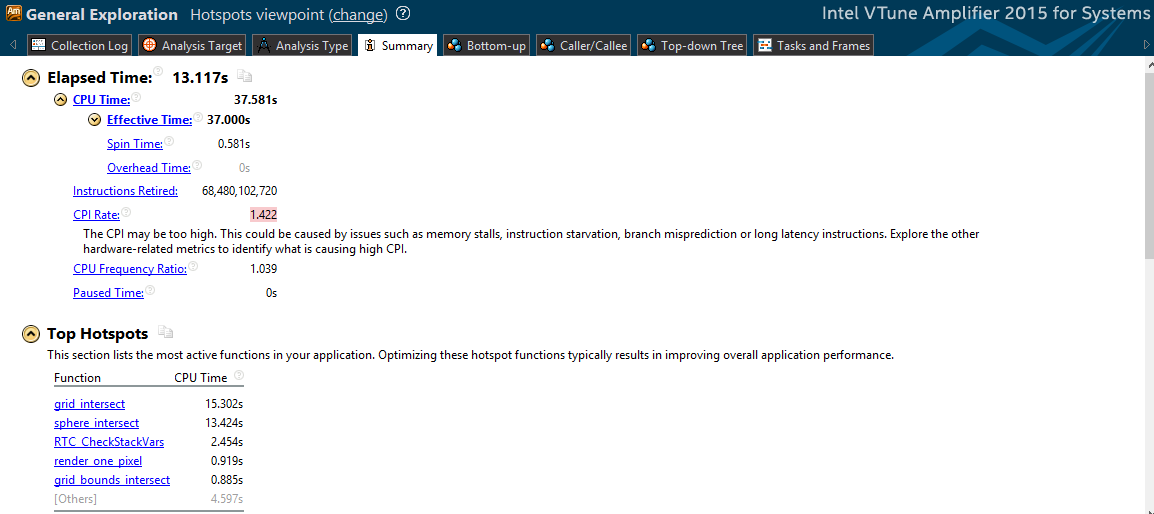
Now, 11.656 seconds is enough to complete the work, which is significantly better than the initial time. Consider the results of VTune.
The total running time is 13.117 seconds , that is, 1.9 times faster than before. We see that the multi-core architecture is effectively used.
Conclusion
The operating time of the entire program decreased from 44.834 to 13.117 seconds , that is, 3.41 times .
This level of optimization was achieved only with the help of a simple analysis in VTune, the addition of an Intel C ++ compiler parameter and the use of Cilk Plus.
Intel System Studio components help developers effortlessly improve their software.
Source: https://habr.com/ru/post/267033/
All Articles