HP Software Management and Monitoring Systems Overview
Management and monitoring of IT infrastructure is one of the main tasks of the IT department of any company. HP Software solutions will simplify the task of system administrators and organize effective control of the organization’s network.
Modern IT infrastructure is a complex heterogeneous network, including telecommunication, server and software solutions from different manufacturers, operating on the basis of various standards. Its complexity and scale determine the high level of automated monitoring and control tools that should be used to ensure reliable network operation. HP Software products can help solve monitoring tasks at all levels, from infrastructure (network equipment, servers and storage systems) to quality control of business services and business processes.
')
Monitoring systems: what are they?
In modern IT monitoring platforms, there are 3 directions for developing and taking monitoring to a new level. The first one is called “Bridge” (“Umbrella System”, “Manager Manager). Its concept is to utilize investments in already existing systems that perform the tasks of monitoring individual parts of the infrastructure, and turning the systems themselves into information agents. This approach is a logical development of conventional IT infrastructure monitoring. As prerequisites for the implementation of the Bridge-type system, the IT department can decide to consolidate disparate monitoring systems to move to monitoring IT services / systems as if they were whole, disparate systems not capable of showing the whole picture, the case of not diagnosing a serious application failure, as well as a large number of warnings and alarms, lack of uniform coverage, prioritization and identification of a causal link.
The result of the implementation will be an automated collection of all available events and IT infrastructure metrics, a comparison of their condition and impact on the health of the service. In the event of a failure, the operator will gain access to a panel displaying the root cause of the failure with recommendations for eliminating it. In the case of a typical failure, it is possible to assign a script that automates the necessary actions of the operator.
The next trend is called "Analytics anomalies." Here, as in the first case, metrics and events are collected from a number of infrastructure monitoring systems, and in addition, IT and security logging is configured. Thus, every minute a huge amount of information is accumulated, and the company wants to benefit from its disposal. There are a number of reasons for the introduction of Analytics for Anomalies: the complexity of collecting, storing and analyzing all data in a timely manner, the need to reactively fix unknown problems, the inability to quickly identify information that is important for eliminating failures, the difficulty of manually performing search operations for individual logs, and the need to identify deviations and repeated failures.
The implementation of the system will allow for the automated collection of events, metrics and logs, storing this information for the necessary period of time, as well as analyzing any information, including logs, performance data and systems data. In addition, it will be possible to predict and resolve any types of problems and prevent known failures.
And finally - "Application Performance Management," or the identification and elimination of failures in end-user transactions. Such a solution may be a useful addition, working in close contact with the previous two. At the same time, such a system in itself can also give a quick result from the implementation. In this case, the company has applications that are important for business. At the same time, accessibility and quality of the service are important, one of the key elements of which is the application (Internet banking, CRM, billing, etc.). When the availability or quality of the provision of this service falls, as a rule, we are talking about proactivity and rapid recovery. Such a system is usually implemented when it is necessary to improve the availability of application services and performance, as well as reduce the average recovery time. In addition, this approach is good for eliminating unnecessary costs and reducing the risks associated with a service level agreement (SLA), and to prevent customers from leaving (protecting the business).
The implementation results may differ depending on the main task. In general, this allows for the implementation of typical user actions by a “robot” from different regions / network segments, parsing of “mirrored” traffic, checking the availability and quality of services with identification of bottlenecks, informing the operator about the need to restore working capacity with an indication of the place of degradation. If necessary, it becomes possible to deeply diagnose the operation of the application to find the reasons for the systematic deterioration of the services.
The above approaches can be implemented using HP Software products, which will be discussed later.
"Bridge" from HP
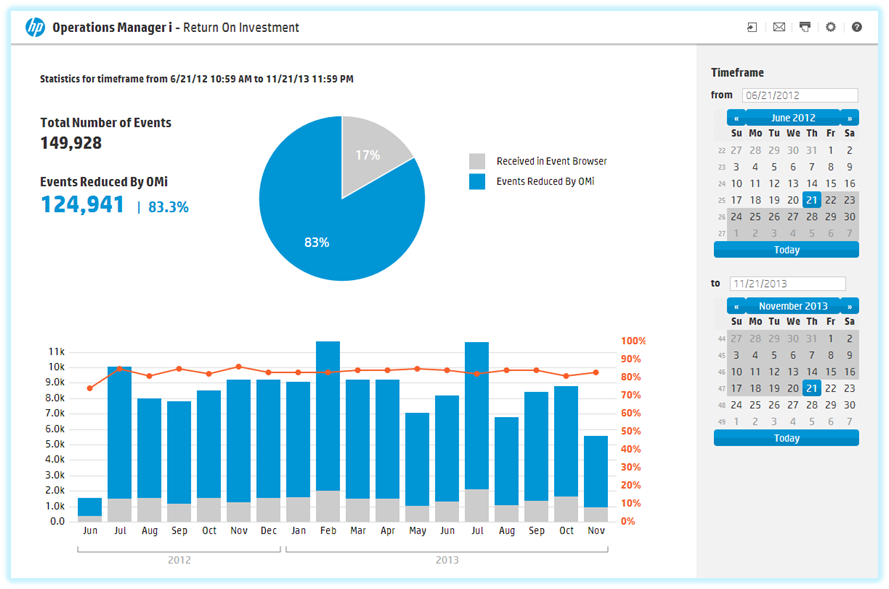
HP Operations Bridge introduces the latest generation of umbrella monitoring systems. The solution combines monitoring data from proprietary agents, various HP Software monitoring modules, and third-party monitoring tools. The flow of events from all sources of information is superimposed on the resource-service model, correlation mechanisms are applied to it to determine which events are causes, symptoms and effects.
Separately, it is necessary to dwell on the resource-service model, but rather on the models, since there are not many such models for analyzing information from different angles. From its completeness and relevance depends on the ability of the decision to perform a correlation of the flow of events. To maintain the relevance of the models, intelligence tools are used based on agents and non-agent technologies that allow to obtain detailed information about the components of the service, the relationships between them and the mutual influence on each other. It is also possible to import data on the service topology from external sources - monitoring systems.
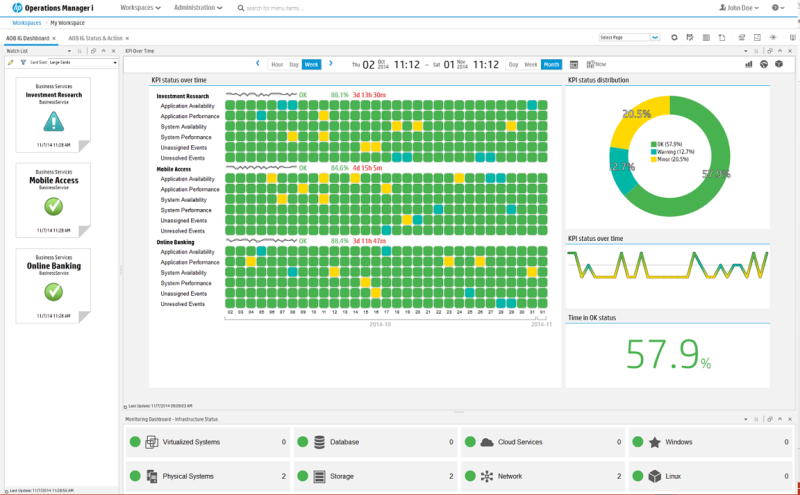
Another important aspect is ease of operation. In complex and dynamically changing environments, it is important to ensure that the monitoring system is adjusted when the structure of the systems changes and new services are added. The Operations Bridge includes the Monitoring Automation component, which allows you to automatically configure the systems that are entered into the monitoring perimeter, which uses data on service-resource models. At the same time, the configuration and monitoring settings that have already been made are supported.
Previously, administrators could perform the same settings of similar infrastructure components (for example, metrics on Windows, Linux or UNIX servers), which required considerable time and effort, then now you can dynamically and centrally adjust thresholds for a metric in the context of a service or a service.
Application Analytics
Using the traditional approach to monitoring implies that we initially know which parameters to monitor and which events to monitor. The growing complexity and dynamics of the development of IT infrastructures makes it necessary to look for other approaches, as it becomes increasingly difficult to control all aspects of the system.
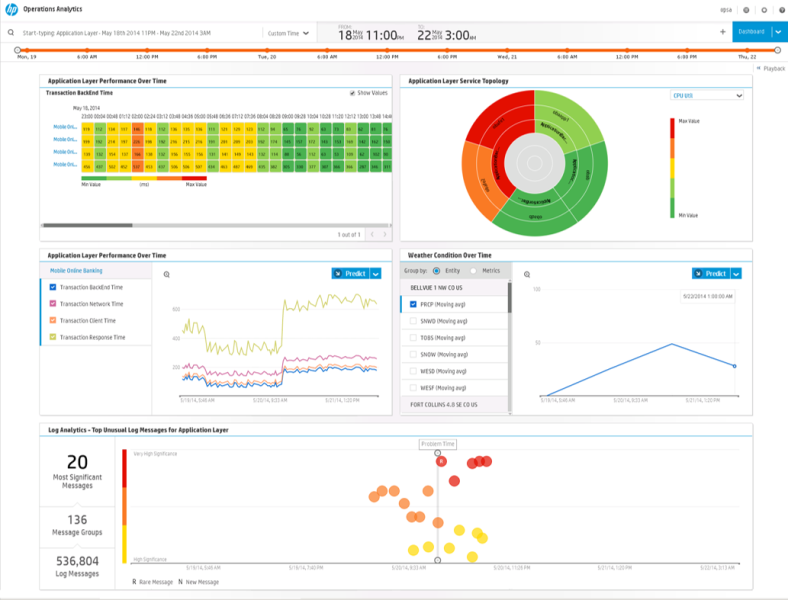
HP Operations Analytics allows you to collect and save all data about the application's work: log files, telemetry, business and performance metrics, system events, etc., and use analytical tools to detect trends and forecasting. The solution brings the collected data to a uniform format and then, making a contextual selection, based on the log data, displays on the timeline what happened at what time and on which system. The product provides several forms of data visualization (for example, an interactive “heat map” and the topology of log file interrelationships) and uses the helper function to find the entire set of data collected for a specific period in the context of an event or a query entered in the search bar. This helps the operator to understand what led to the failure (or, when using HP SHA data together with HP OA data, to make an appropriate forecast), as well as to identify both the culprit and the root cause of the failure that occurred. HP Operations Analytics provides an opportunity to reproduce the picture of the service and the environment at the time of failure and isolate it in context and time.
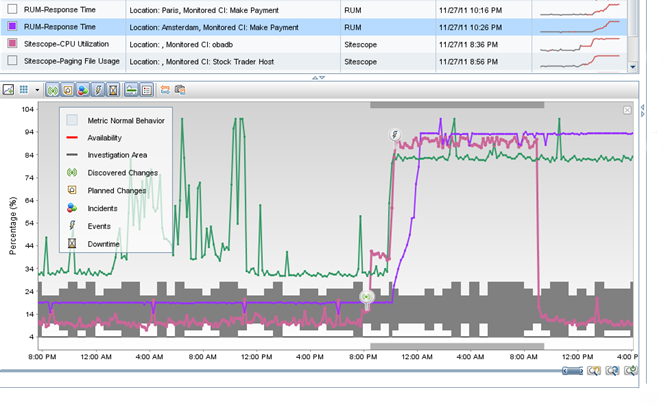
Another analytic tool is the HP Service Health Analyzer. HP SHA detects anomalous behavior of the monitored elements of the infrastructure in order to prevent possible denial of service or violation of the specified parameters of their provision. The product uses special algorithms for statistical data analysis based on the HP BSM topological service-resource model. With their help, it is possible to build a profile of normal values of performance parameters collected from both software and hardware platforms and from other BSM modules (for example, HP RUM, HP BPM), characterizing the state of services. Typical parameter values are entered into such profiles, taking into account the days of the week and the time of day. SHA performs historical and statistical analysis of the accumulated data (to understand the essence of the identified data), and also carries out a comparison with the existing dynamic profile (baselining).
Application Performance Monitoring
When it comes to monitoring application performance, the following components of the HP solution should be highlighted:
- HP Real User Monitoring (HP RUM) - monitoring the progress of real user transactions;
- HP Business Process Monitoring (HP BPM) - monitoring application availability by emulating user actions;
- HP Diagnostics - control the passage of requests within the application.
HP RUM and HP BPM allow you to assess the availability of the application from the end user's point of view.
HP RUM parses network traffic, revealing real user transactions. In this case, you can control the exchange of data between application components: the client part, the application server and the database. This makes it possible to track user activity, the processing time of various transactions, as well as determine the relationship between user actions and business metrics. Using HP RUM, monitoring service operators will be able to instantly receive operational notifications about problems in the availability of services and information about errors encountered by users.
HP BPM is an active monitoring tool that performs synthetic user transactions, indistinguishable from real ones for monitored systems. HP BPM monitoring data is convenient to use for calculating the real SLA, since the “robot” performs identical checks at identical intervals, ensuring continuous quality control of typical (or most critical) requests. By setting up samples to perform synthetic transactions from several points (for example, from different offices of the company), you can also evaluate the availability of the service for different users, taking into account their location and communication channels. To emulate HP BPM activity, use the Virtual User Generator (VuGen) tool, which is also used in the popular HP LoadRunner load testing product. VuGen supports a huge range of different protocols and technologies, so you can control the availability of virtually any service, as well as use a single set of scripts for testing and monitoring.
If the cause of failures or slowdowns of the service is inside such technologies as Java, .NET, etc., HP Diagnostics will help.
The solution provides deep control of Java, .NET, Python on Windows, Linux and Unix platforms. The product supports a variety of application servers (Tomcat, Jboss, WebLogic, Oracle, etc.), MiddleWare and databases. Specialized HP Diagnostics agents are installed on application servers and collect technology-specific data. For example, for a Java application, you can see which queries are being executed, which methods are used and how much time is spent on their development. The structure of the application is automatically drawn, it becomes clear how its components are involved. HP Diagnostics allows you to track the passage of business transactions within complex applications, identify bottlenecks and provide experts with the necessary information for making decisions.
Distribution of HP decisions in Ukraine , Georgia , Tajikistan , CIS countries .
Training courses on HP technologies in Kiev (TC MUK)
MUK-Service - all types of IT repair: warranty, non-warranty repair, sale of spare parts, contract service
Source: https://habr.com/ru/post/266791/
All Articles