Logging JDBC requests and their parameters in an existing application
In this publication, we will look at how to incorporate logging of jdbc operations into an existing application without recompiling and recompiling it. This will make it possible to log the parameters of requests that the program fills, and many other aspects of working with jdbc.
Well, if you have the opportunity to add log4jdbc to the assembly application.
<dependency> <groupId>com.googlecode.log4jdbc</groupId> <artifactId>log4jdbc</artifactId> <version>1.2</version> </dependency> And use net.sf.log4jdbc.DriverSpy when creating a connection.
')
If this is not possible, aspectj-scripting will help you with logging jdbc operations.
The experimental program remains the SonarQube, as in the articles about hawt.io/h2 and CRaSH-ssh . These articles discussed in more detail the configuration process and the principle of work of aspectj-scripting and provides step-by-step instructions.
To log jdbc operations, change the parameters for running the jvm sonar:
sonar.web.javaAdditionalOpts = -javaagent: aspectj-scripting-1.0-agent.jar -Dorg.aspectj.weaver.loadtime.configuration = config: file: h2_jdbc.xml
It also requires the availability of the jvm aspectj-scripting agent and the h2_jdbc.xml configuration file:
<?xml version="1.0" encoding="UTF-8" standalone="yes"?> <configuration> <aspects> <name>com.github.igorsuhorukov.JdbcLog</name> <type>AROUND</type> <pointcut>execution(* org.apache.commons.dbcp.BasicDataSource.getConnection())</pointcut> <process> <expression> log4jdbcresultUrls = com.github.smreed.dropship.MavenClassLoader.forMavenCoordinates("com.googlecode.log4jdbc:log4jdbc:1.2").getURLs(); slf4jresultUrls = com.github.smreed.dropship.MavenClassLoader.forMavenCoordinates("org.slf4j:slf4j-simple:1.6.0").getURLs(); resultUrls = new java.net.URL[log4jdbcresultUrls.length + slf4jresultUrls.length]; System.arraycopy(log4jdbcresultUrls, 0, resultUrls, 0, log4jdbcresultUrls.length); System.arraycopy(slf4jresultUrls, 0, resultUrls, log4jdbcresultUrls.length, slf4jresultUrls.length); log4jdbcLoader = new java.net.URLClassLoader(resultUrls, Thread.currentThread().getContextClassLoader()); log4jdbcLoader.loadClass("net.sf.log4jdbc.ConnectionSpy"); currentLoader = java.lang.Thread.currentThread().getContextClassLoader(); java.lang.Thread.currentThread().setContextClassLoader(log4jdbcLoader); res = new net.sf.log4jdbc.ConnectionSpy(joinPoint.proceed()); java.lang.Thread.currentThread().setContextClassLoader(currentLoader); res; </expression> </process> </aspects> </configuration> This aspect allows you to intercept the getConnection () call of the BasicDataSource class from the common-dbcp library and return the wrapper ConnectionSpy to connect to the database. At the same time, classes from log4jdbc become available in the application by creating their own class loader from maven artifacts in the local repository. aspectj-scripting loads artifacts com.googlecode.log4jdbc: log4jdbc: 1.2 and org.slf4j: slf4j-simple: 1.6.0 based on the configuration you specified above. This works thanks to the fact that we passed two additional parameters at the start of jvm: " -javaagent " to start the aspectj-scripting agent and -Dorg.aspectj.weaver.loadtime.configuration to transfer configuration to it. And the aspectj agent instruments the application classes when they are loaded.
The following loggers are available in the log4jdbc library:
- jdbc.sqlonly - Logs only SQL
- jdbc.sqltiming - Logs SQL and runtime
- jdbc.audit - Logs all JDBC API calls, except for working with ResultSet
- jdbc.resultset - All calls to the ResultSet are logged
- jdbc.connection - Opening and closing connections are logged, useful to find connections for leaks
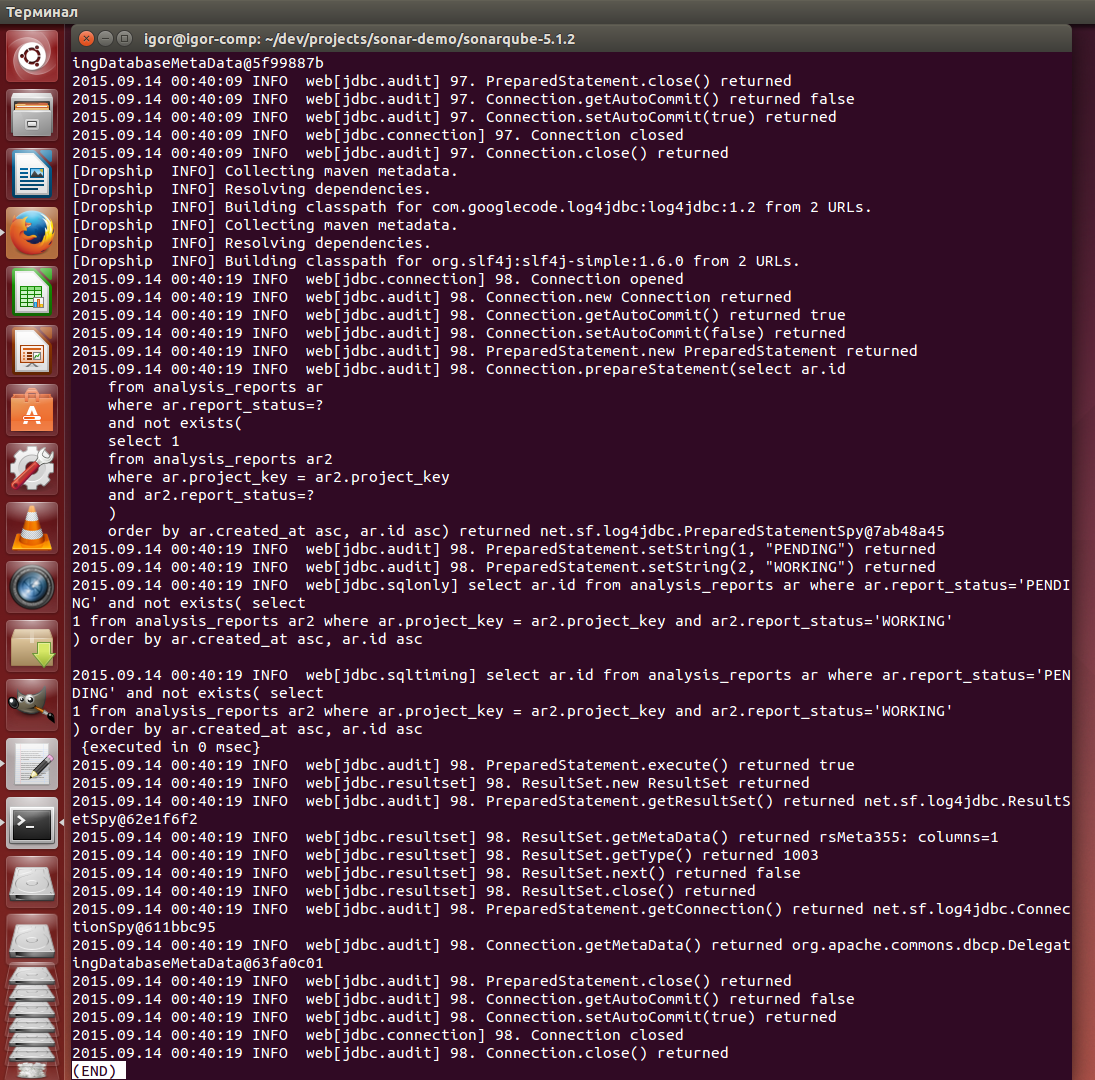
Finally, here are some examples from the SonarQube logs, the web part of which is written in ruby and runs in jruby:
[jdbc.connection] 2. Connection opened
[jdbc.connection] 81. Connection closed
[jdbc.sqltiming] select * from schema_migrations {executed in 4 msec}
[jdbc.audit] 7. PreparedStatement. setString (1, "sonar.core.id") returned
[jdbc.audit] 9. PreparedStatement .setTimestamp (1, 2015-08-09 18: 49: 08.205) returned
[jdbc.audit] 9. PreparedStatement. setFetchSize (200) returned
[jdbc.audit] 14. Connection. prepareStatement (update metrics set best_value = ?, delete_historical_data = ?, description = ?, direction = ?, domain = ?, enabled = ?, hidden = ?, short_name = ?, optimized_best_value = ?, origin = ?, qualitative = ?, val_type =?, user_managed =?, worst_value =? where id =?) returned net.sf.log4jdbc.PreparedStatementSpy@6e22c0e5
[jdbc.resultset] 2. ResultSet. getMetaData () returned rsMeta0: columns = 1
[jdbc.resultset] 2. ResultSet. getType () returned 1003
[ jdbc.sqlonly ] select ar.id from analysis_reports ar where ar.report_status = 'PENDING' and not exists (select 1 from analysis_reports ar2 where ar.project_key = ar2.project_key and ar2.report_status = 'WORKING') created_at asc, ar.id asc
An example, described in the article, you can see in the screencast:
So, we were able to modify the jvm SonarQube configuration so that all the calls to the Jdbc API application with their parameters were recorded in its log file. I hope this publication will be useful to you and you will find other ways to use aspect-oriented programming for existing java programs.
Source: https://habr.com/ru/post/266781/
All Articles