Z-Desk - geometric constructions in space
Hi, Habr. I want to talk about one of his development in the field of 3D-graphics, which he called the Z-Desk.
My parents are engineers. We had a drawing board at home. There was something magical when paper was attached to it, and a drawing was created on paper with the help of simple tools. School drawing became my favorite subject. The institute appeared in general disruptive discipline - descriptive geometry. With the help of simple rules it was possible to make complex spatial constructions.
At the same time, the era of personal computers came to life. The first graphic packages for building on the plane and in space appeared. All this I really liked. Also liked the game Descent. Who knows will understand.
')
In parallel, he studied programming. Turbo Pascal was the Graph library. With a simple API, you could draw lines and geometric shapes. An idea appeared in my head - that if we had added a third dimension to the drawing board using a computer, and that if we could draw in the volume as easily as on the screen in Turbo Pascal.
This idea wandered in my head, but could not find a way out. And now, when 3D became available in browsers through the WebGL API, I understood that the time had come.
The first attempt looked like a module to Drupal. The drawing was viewed as a publication. The language for creating 3D scenes was PHP. After publication, the drawing could be viewed in several modes. X3Dom was chosen as the WebGL library — she used special HTML tags to create scenes.
There were strengths and weaknesses in this approach. The advantage is that for the management of materials and users it was possible to apply all the features of a CMS. The disadvantage was a somewhat inconvenient use of the system, a large number of actions in order to at least see something on the screen.
Although I consider this attempt not very successful, in the process of its implementation a lot of experience was gained and various approaches to the software and user interface of the system were tested. About this attempt I wrote an article on Habré.
habrahabr.ru/post/209496 - Creating 3D-illustrations - a prototype of the system
Good people wrote reviews, some even tried to draw something, but since the interface was heavy and incomprehensible, the system did not show much success in this direction.
Smart people in the comments advised to look in the direction of the library three.js. What I did. Along with the study of the library, new approaches to the system and its interface began to appear. The main idea is to make acquaintance with the system as simple and clear as possible so that the finished result is just a click away.
This is how the Z-Desk system appeared. In order for the system to work properly, you need a browser with WebGL support. If you have a good video card and one of the latest versions of Firefox or Chrome, then most likely everything will be fine. I apologize to all the others if something does not work.
headfire.imtqy.com/zdesk - View the Z-Desk system in action
github.com/headfire/zdesk - Repository on GitHub
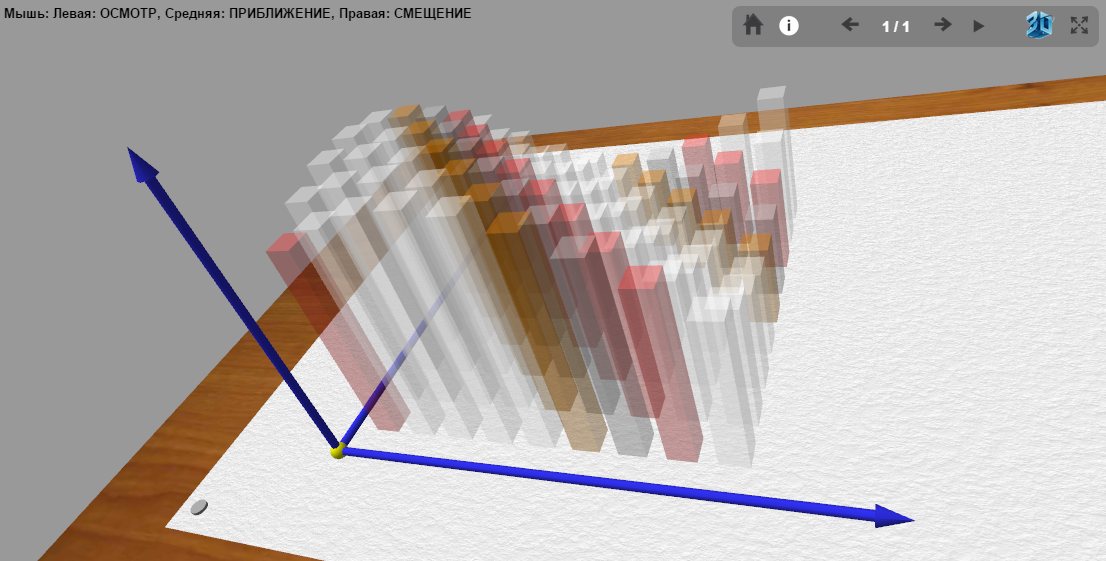
After loading you are met by a three-dimensional model of a “warm tube” drawing board (hello from childhood). The board gives the system an original look, besides it helps to orient in the sizes and orientations of objects when building and viewing. On the left is the program code. The starting example shows how to draw two points and connect them with a segment. Above the code is a field for selecting other examples. At the moment, examples have been created that describe all the capabilities of the system.
You can draw in the plane of the drawing paper. To do this, when determining the coordinates, you must not specify the third coordinate (or specify 0). In this case, the drawing will be drawn on paper. But if you add the Z-coordinate a miracle happens - the drawing will spread its wings and soar above the surface of the drawing board.
The scene creation language is now JavaScript. You can edit the existing code and enter your own. After clicking on the "Run" button, it is immediately drawn in the model. If you make a mistake, the system will write an error message and highlight the line of code.
Another major change in the system - now there is no CMS. Examples are stored as simple JS files. The whole system is a static one-page application without server scripts and databases. This means that you cannot save your drawing in the system. Therefore, if you liked what you created - copy it into a text editor and save it in your file. In the future, it will be necessary to make the possibility of publishing the created drawings, but for the demo version this is not so relevant.
One of the prerequisites of the project, I determined the possibility of showing illustrations in stereo mode.
If you are a happy owner of the cross-look skill, you can see the stereo drawing without any technical means. Turn on the 3D button in the control panel and flatten your eyes (be careful, after finishing viewing, make sure that your eyes are in the normal position :).
If you click 3D a second time, the mode for 3D TVs will turn on. 3D TVs are no longer a curiosity and are quite widespread. One problem - not enough 3D content. Z-Desk system is designed to solve this problem. You can connect the TV via HDMI and view the drawing in 3D mode without any drivers. Turning, as it was written above, to the 3D-TV mode, open the drawing field on the full screen using another button, turn on the 3D SideBySide on the TV, put on your glasses and look at your drawing in all its beauty. Stereo mode was tested on the TV Philips 42 "42PFL7606H / 60 (for this special thanks to my friend Sergey).
The construction mastab is defined by a sheet of paper on the drawing board. This is not just a sheet - but the drawing format A0 (841 × 1189). All object coordinates must be correlated with these dimensions. Zero - in the center of the sheet. Z axis is pointing up. The coordinate system with a special command can be moved and rotated. All subsequent constructions will be made taking into account the new position of the coordinate system.
Points, lines, arrows and other objects are modeled by bodies, that is, they have a certain thickness and volume. Although it adds entertainment, very small constructions look sloppy - so you should draw larger ones.
For the construction can be used in various colors. For different types of objects the color is set separately. This is done so that you can set the color scheme and then build in the same style without constantly switching the color context. In addition to color, objects can be set to transparency. This is useful, for example, when you want to draw auxiliary or explanatory constructions.
The system has done everything to create really useful illustrations. At any point in space, you can create text labels and they will move with the model, but at the same time stay in the plane of the screen and be readable. In addition, you can display information at the top of the drawing in plain text.
In geometric problems, it is often necessary to mark segments or angles as identical. At school, we did this by applying a notch (from one to four) to the middle of the segment. The corners were marked with small arcs on the same principle. This simple method is implemented in the system.
If you decide to illustrate the sequential construction of several steps, then this is also possible. A drawing can contain several slides and you can control the visibility of objects by placing them only on the desired slides.
For completeness, I provide a full list of commands for constructing drawings:
I think such a system may have some academic interest.
I came across the opinion that it is inconvenient to create illustrations using programming and that something like a voluminous editor is needed. Indeed, there are shortcomings in the approach to language, but there are also advantages. The use of a programming language is a great advantage for precise, repetitive, and parametric constructions. And further:
Indeed, when you try to awaken an interest in programming in children, some entertainment is needed. When you write several pages of code, and the program gives x = 3.455 as a result, it can cool even the hottest children's hearts in the first stages.
But, if the program
produces a super-volume drawing
- this will certainly add to the interest of children in computer science. On the Internet in this direction are under active development. On Geektimes recently there was an article about a “live” textbook of linear algebra:
geektimes.ru/post/262068 - The first interactive textbook on linear algebra
This is a very interesting direction. It is possible and necessary to develop and use similar approaches.
Please do not take this system too seriously and do not judge strictly. I just did what I wanted for a long time. And if it benefits anyone, it will be great. I am very grateful to my father for instilling in me a love for engineering disciplines. I am also grateful to the creators of the three.js (WebGL) and codemirror.js libraries (code editor). Very good, thoughtful and reliable libraries.
threejs.org - WebGL 3D library
codemirror.net - Text Editor on JavaScript
Bye, Habr! Waiting for feedback ...
-
Prehistory
My parents are engineers. We had a drawing board at home. There was something magical when paper was attached to it, and a drawing was created on paper with the help of simple tools. School drawing became my favorite subject. The institute appeared in general disruptive discipline - descriptive geometry. With the help of simple rules it was possible to make complex spatial constructions.
At the same time, the era of personal computers came to life. The first graphic packages for building on the plane and in space appeared. All this I really liked. Also liked the game Descent. Who knows will understand.
')
In parallel, he studied programming. Turbo Pascal was the Graph library. With a simple API, you could draw lines and geometric shapes. An idea appeared in my head - that if we had added a third dimension to the drawing board using a computer, and that if we could draw in the volume as easily as on the screen in Turbo Pascal.
This idea wandered in my head, but could not find a way out. And now, when 3D became available in browsers through the WebGL API, I understood that the time had come.
First try
The first attempt looked like a module to Drupal. The drawing was viewed as a publication. The language for creating 3D scenes was PHP. After publication, the drawing could be viewed in several modes. X3Dom was chosen as the WebGL library — she used special HTML tags to create scenes.
There were strengths and weaknesses in this approach. The advantage is that for the management of materials and users it was possible to apply all the features of a CMS. The disadvantage was a somewhat inconvenient use of the system, a large number of actions in order to at least see something on the screen.
Although I consider this attempt not very successful, in the process of its implementation a lot of experience was gained and various approaches to the software and user interface of the system were tested. About this attempt I wrote an article on Habré.
habrahabr.ru/post/209496 - Creating 3D-illustrations - a prototype of the system
Good people wrote reviews, some even tried to draw something, but since the interface was heavy and incomprehensible, the system did not show much success in this direction.
Smart people in the comments advised to look in the direction of the library three.js. What I did. Along with the study of the library, new approaches to the system and its interface began to appear. The main idea is to make acquaintance with the system as simple and clear as possible so that the finished result is just a click away.
Z-Desk system
This is how the Z-Desk system appeared. In order for the system to work properly, you need a browser with WebGL support. If you have a good video card and one of the latest versions of Firefox or Chrome, then most likely everything will be fine. I apologize to all the others if something does not work.
headfire.imtqy.com/zdesk - View the Z-Desk system in action
github.com/headfire/zdesk - Repository on GitHub
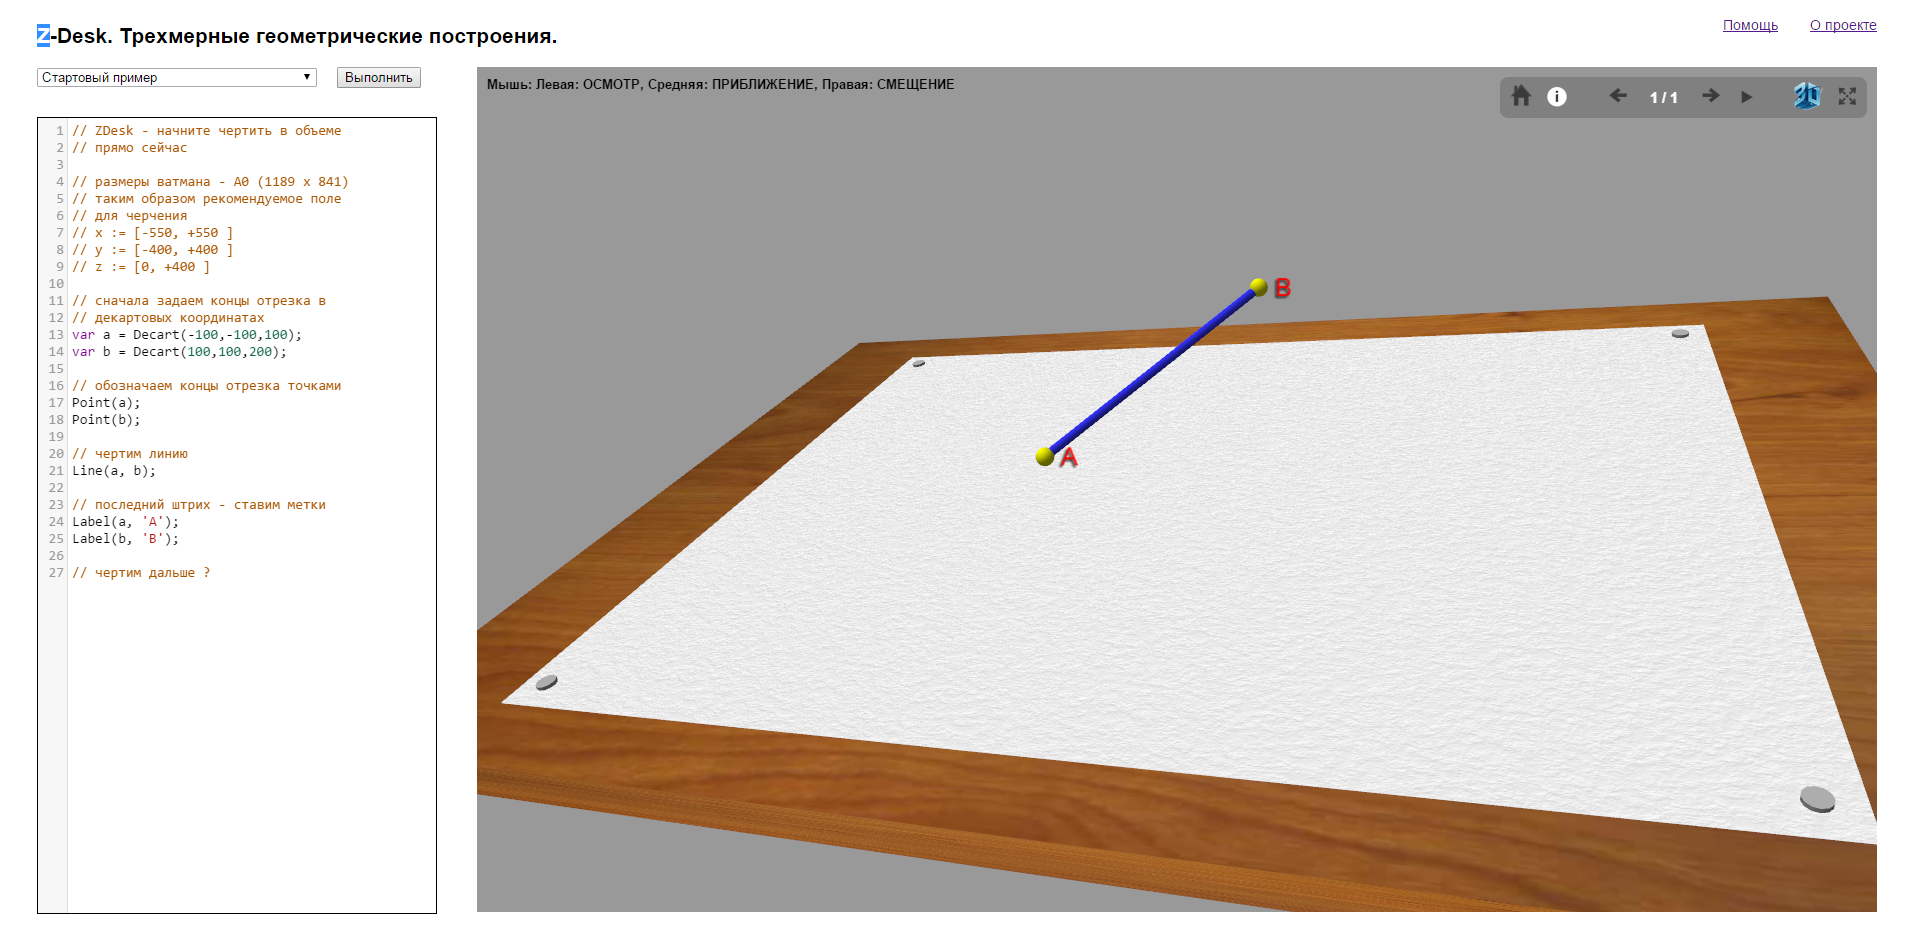
After loading you are met by a three-dimensional model of a “warm tube” drawing board (hello from childhood). The board gives the system an original look, besides it helps to orient in the sizes and orientations of objects when building and viewing. On the left is the program code. The starting example shows how to draw two points and connect them with a segment. Above the code is a field for selecting other examples. At the moment, examples have been created that describe all the capabilities of the system.
You can draw in the plane of the drawing paper. To do this, when determining the coordinates, you must not specify the third coordinate (or specify 0). In this case, the drawing will be drawn on paper. But if you add the Z-coordinate a miracle happens - the drawing will spread its wings and soar above the surface of the drawing board.
The scene creation language is now JavaScript. You can edit the existing code and enter your own. After clicking on the "Run" button, it is immediately drawn in the model. If you make a mistake, the system will write an error message and highlight the line of code.
Another major change in the system - now there is no CMS. Examples are stored as simple JS files. The whole system is a static one-page application without server scripts and databases. This means that you cannot save your drawing in the system. Therefore, if you liked what you created - copy it into a text editor and save it in your file. In the future, it will be necessary to make the possibility of publishing the created drawings, but for the demo version this is not so relevant.
Display in stereo mode on 3D-TVs and without them
One of the prerequisites of the project, I determined the possibility of showing illustrations in stereo mode.
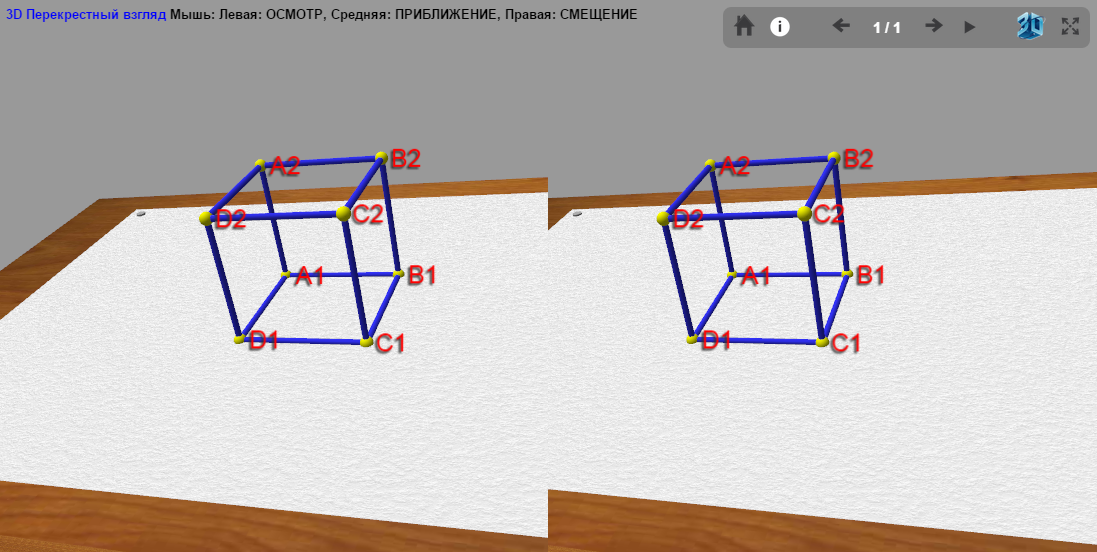
If you are a happy owner of the cross-look skill, you can see the stereo drawing without any technical means. Turn on the 3D button in the control panel and flatten your eyes (be careful, after finishing viewing, make sure that your eyes are in the normal position :).
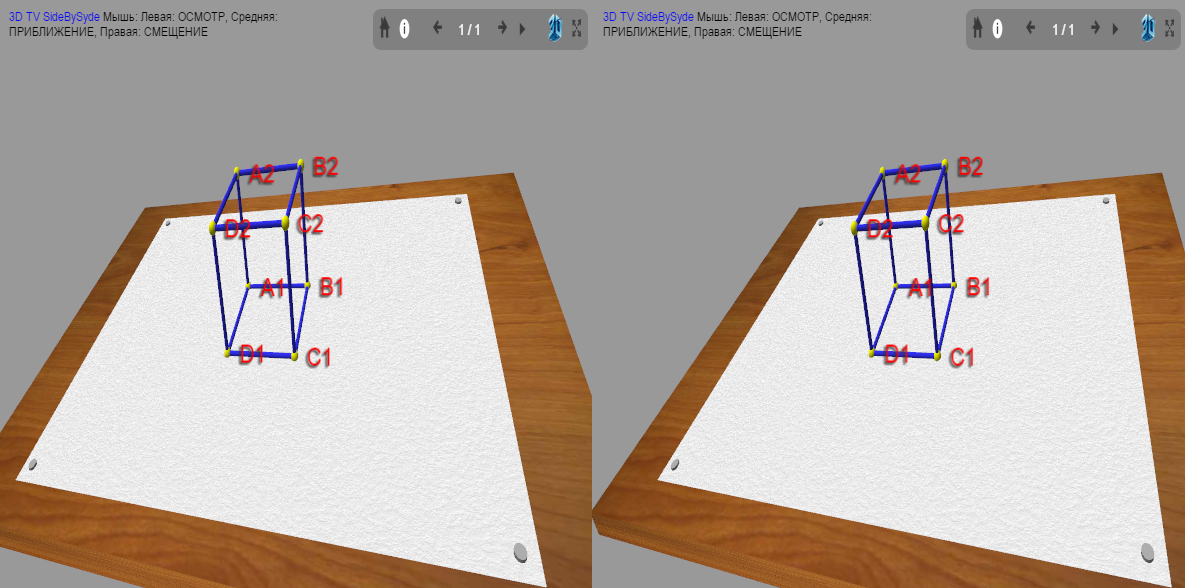
If you click 3D a second time, the mode for 3D TVs will turn on. 3D TVs are no longer a curiosity and are quite widespread. One problem - not enough 3D content. Z-Desk system is designed to solve this problem. You can connect the TV via HDMI and view the drawing in 3D mode without any drivers. Turning, as it was written above, to the 3D-TV mode, open the drawing field on the full screen using another button, turn on the 3D SideBySide on the TV, put on your glasses and look at your drawing in all its beauty. Stereo mode was tested on the TV Philips 42 "42PFL7606H / 60 (for this special thanks to my friend Sergey).
A few more words about the system
The construction mastab is defined by a sheet of paper on the drawing board. This is not just a sheet - but the drawing format A0 (841 × 1189). All object coordinates must be correlated with these dimensions. Zero - in the center of the sheet. Z axis is pointing up. The coordinate system with a special command can be moved and rotated. All subsequent constructions will be made taking into account the new position of the coordinate system.
Points, lines, arrows and other objects are modeled by bodies, that is, they have a certain thickness and volume. Although it adds entertainment, very small constructions look sloppy - so you should draw larger ones.
For the construction can be used in various colors. For different types of objects the color is set separately. This is done so that you can set the color scheme and then build in the same style without constantly switching the color context. In addition to color, objects can be set to transparency. This is useful, for example, when you want to draw auxiliary or explanatory constructions.
The system has done everything to create really useful illustrations. At any point in space, you can create text labels and they will move with the model, but at the same time stay in the plane of the screen and be readable. In addition, you can display information at the top of the drawing in plain text.
In geometric problems, it is often necessary to mark segments or angles as identical. At school, we did this by applying a notch (from one to four) to the middle of the segment. The corners were marked with small arcs on the same principle. This simple method is implemented in the system.
If you decide to illustrate the sequential construction of several steps, then this is also possible. A drawing can contain several slides and you can control the visibility of objects by placing them only on the desired slides.
System interface
For completeness, I provide a full list of commands for constructing drawings:
// place = Decart ( x, y,[z] ); place = Polar( radius, angle, [z] ); // Point ( place ); Line ( startPlace, endPlace ); Vect ( startPlace, endPlace ); Circle ( radius, place, [lookAt] ); Arc ( radius, startAngle, angle, place, [lookAt] ); // Triangle ( aPlace, bPlace, cPlace ); // Box ( place, xSize, ySize, zSize, [lookAt], [zAngle] ); Sphere ( place, radius ); Cylinder ( place, topRadius, bottomRadius ,height, [lookAt] ); Torus ( place, mainRadius, tubeRadius, [lookAt] ); // MarkLine ( startPlace, endPlace, marksCount ); MarkAngle( firstPlace, basePlace, secondPlace, marksCount ); Label ( place, text ); Message ( text ); // Coord ( ); SetCoord ( place, [lookAt],[zAngle] ); // color : GRAY, RED, GREEN, BLUE, YELLOW, MAGENTA, GYAN, BROWN transparent : NORMAL, GLASS, CHOST SetPointColor ( color ); SetLineColor ( color ); SetObjectColor( color ); SetTriangleColor ( color ); SetMarkColor ( color ); SetTransparent ( transparent ); // SetVisible ( startSlide, endSlide ); // PI = 3.14 ...; angleInRadians = Rad ( angleInDegrees ); angleInDegrees = Deg ( angleInRadians ); Sin ( x ); Cos ( x ); Tan ( x ); ASin ( x ); ACos ( x ); ATan ( x ); // E = 2.71 ...; Sqr ( x ); Sqrt( x ); Power( x, y ); Log ( x ); Exp ( x ); // Max ( x1, x2, x3, ... ); Min ( x1, x2, x3, ... ); Random ( min, max ); // ** !!! Where could it come in handy
I think such a system may have some academic interest.
- It is possible to illustrate online textbooks and problem books on geometry, mathematics, physics, chemistry.
- You can create volumetric infographics.
- In educational institutions, you can create modern demo zones, where colorful volumetric illustrations are consistently broadcast on a 3D TV.
I came across the opinion that it is inconvenient to create illustrations using programming and that something like a voluminous editor is needed. Indeed, there are shortcomings in the approach to language, but there are also advantages. The use of a programming language is a great advantage for precise, repetitive, and parametric constructions. And further:
- You can learn the basics of programming in a fun and visual way.
Indeed, when you try to awaken an interest in programming in children, some entertainment is needed. When you write several pages of code, and the program gives x = 3.455 as a result, it can cool even the hottest children's hearts in the first stages.
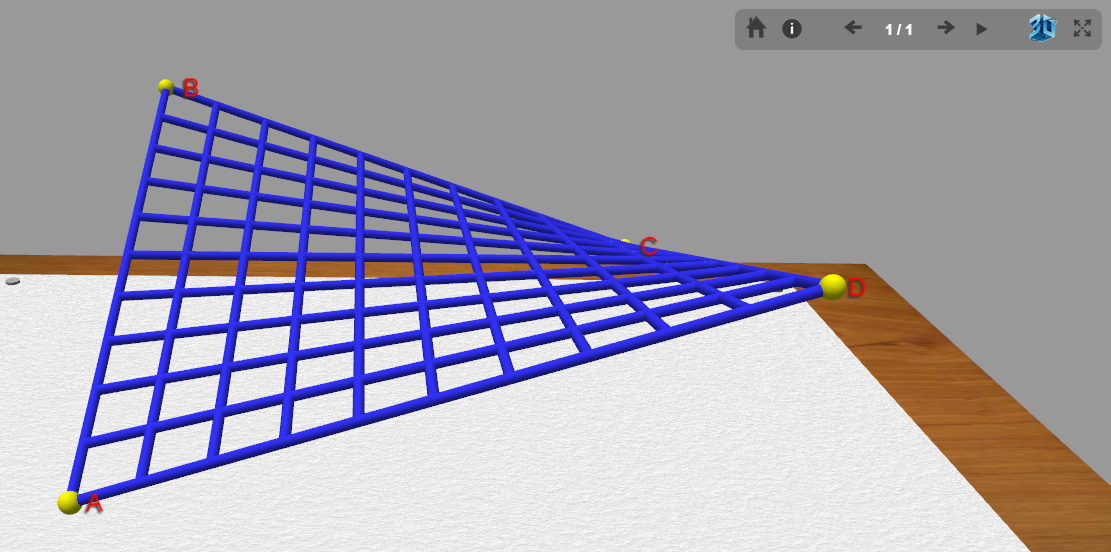
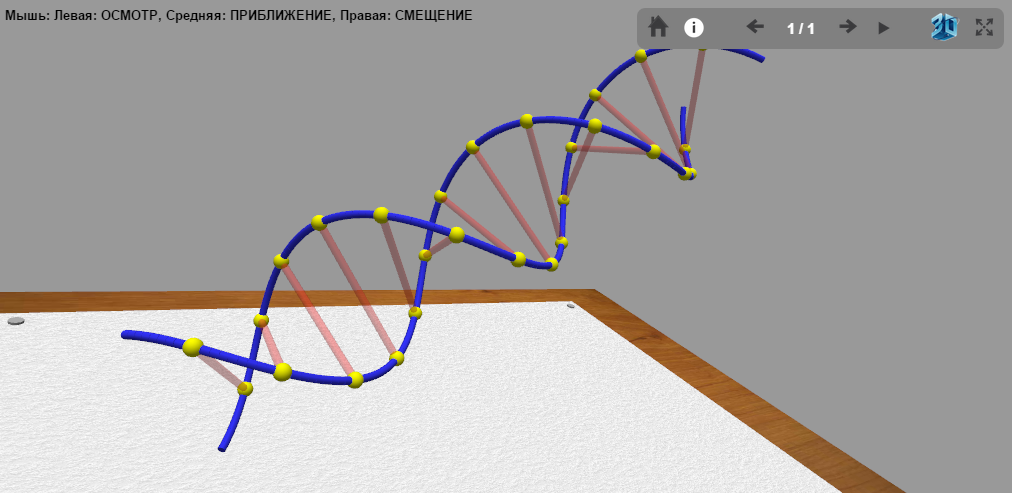
But, if the program
// ZDesk - - SetCoord(Decart(-400, 0, 100), Decart(500,0,700)) var i; var a1 = Polar(100,0,0); var a2 = Polar(100,Rad(180),0); var b1, b2; for (i=1;i<150;i++) { b1 = a1; a1 = Polar(100,Rad(i*4),i*6); b2 = a2; a2 = Polar(100,Rad(i*4+180),i*6) SetTransparent(NORMAL); SetLineColor(BLUE); Line(a1,b1); Line(a2,b2); if (i%10 == 0) { Point(b1); Point(b2); SetLineColor(RED); SetTransparent(GLASS); Line(b1, b2); } } produces a super-volume drawing
- this will certainly add to the interest of children in computer science. On the Internet in this direction are under active development. On Geektimes recently there was an article about a “live” textbook of linear algebra:
geektimes.ru/post/262068 - The first interactive textbook on linear algebra
This is a very interesting direction. It is possible and necessary to develop and use similar approaches.
Conclusion
Please do not take this system too seriously and do not judge strictly. I just did what I wanted for a long time. And if it benefits anyone, it will be great. I am very grateful to my father for instilling in me a love for engineering disciplines. I am also grateful to the creators of the three.js (WebGL) and codemirror.js libraries (code editor). Very good, thoughtful and reliable libraries.
threejs.org - WebGL 3D library
codemirror.net - Text Editor on JavaScript
Bye, Habr! Waiting for feedback ...
-
Source: https://habr.com/ru/post/266721/
All Articles