Memory Profiling with Intel® VTune ™ Amplifier XE
Inefficient memory access is perhaps one of the most frequent program performance problems. The speed of loading data from memory traditionally lags behind the speed of their processing by the processor. To reduce data access time in modern processors, special blocks and multi-level cache systems are implemented, which allow reducing processor idle time when loading data, however, in some cases, the processor logic does not work effectively. In this post we will talk about how you can explore the work with the memory of your application using the new Memory Access profile in VTune Amplifier XE.
Memory-related metrics have long been available in the VTune Amplifier. A new type of analysis Memory Access not only collected them in one place, but also added several major improvements.
It was before in other types of analysis:
')
Appeared in Intel VTune Amplifier XE 2016:
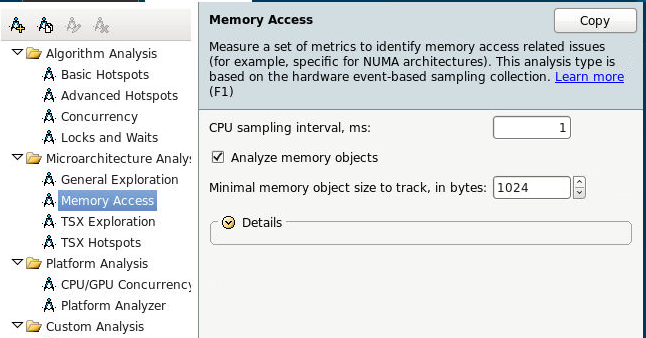
So, we start the Memory Access analysis, immediately enable tracking of data objects. This feature is currently available only on Linux.
Or from the command line:
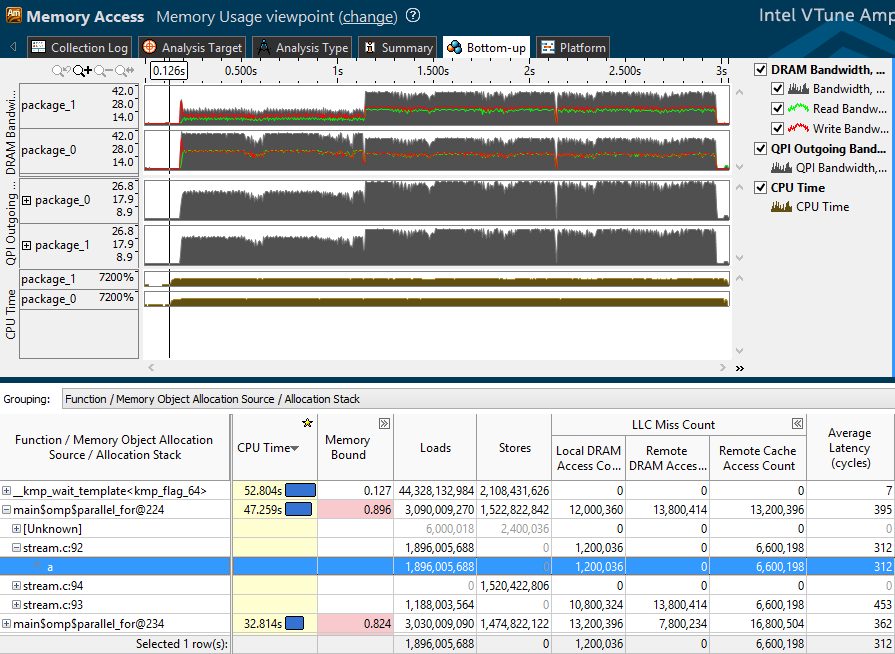
So, we will look at the profile obtained after profiling the benchmark stream. In the upper half of the Bottom-up window, the traffic generated by our application is reflected:
Below is a table showing the main hardware metrics and memory access counters:
Memory Bound includes the ratio of the number of accesses to remote and local RAM, and metrics in the same categories as top-level cache misses (LLC):

Memory Bound metrics are formulas that include the number of events (for example, LLC misses) and their estimated cost in cycles. The value of the metric is compared with a certain reference value, and is highlighted in pink if it exceeds a predetermined threshold. At the exit, the user receives a hint about what you should pay attention to - a large number of cache misses may indicate inefficient location of data objects, perhaps the “hottest” objects can be placed in a separate block that can be kept in the cache longer.
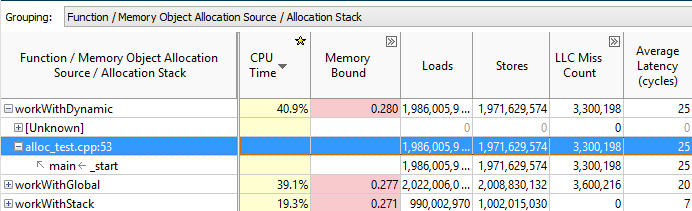
The problems of working with memory are inextricably linked with data objects that previously had to be calculated by oneself. Now you can simply select the grouping with a Memory Object, and observe which objects specifically account for most of the hits, cache misses, etc .:

At the same time, if you double-click on a function on an object, you will be taken to the line of code that performed the memory operation of interest to us:

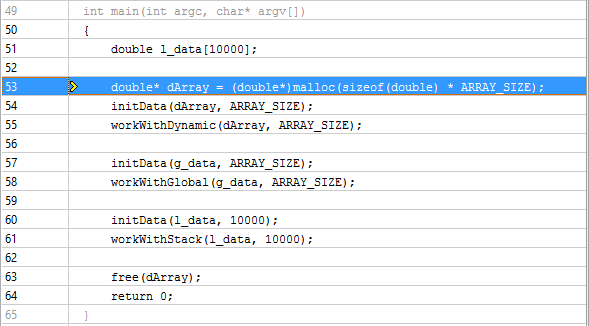
And if you grouped by the Memory Object Allocation Source and double-click on the object itself, you can determine the place of its creation:
VTune Amplifier recognizes dynamically generated C and C ++ objects and static C, C ++ and Fortran objects.
On NUMA machines, accessing local RAM is faster than remote memory, because The other socket's RAM has to be accessed via the QPI bus, which is slower than the local RAM access bus. A large number of accesses to the RAM or cache of another socket, together with high values of Average Latency, may indicate an inefficient localization of application data. If, for example, a global data object is created in the main thread, and other threads, possibly running on another socket, actively access it, processor downtime due to remote access to the data is possible. Such problems can be solved by localizing hot data in the stream, “pinning” (pinning) streams, using different NUMA-aware libraries.
Detecting NUMA problems in VTune Amplifier is now quite simple. To begin with, we look at all the metrics with the word Remote, for example, the Remote / Local DRAM ratio - the relative number of remote hits:

You can filter features and objects with high QPI traffic. On the Summary tab in Bandwidth Utilization Histogram we move the sliders, defining which values we consider Low, Medium and High:

In Bottom-up we group by Bandwidth Domain, and see which objects were used (or which code was executed) during times of high QPI load:

Well, traditionally for Bandwidth analysis, bursts of traffic are clearly visible on the timeline. Select this area and filter (right-click, Filter In by selection). The list of functions in the table below will reflect only the code that was executed in the selected time interval:

Below is the result of the profile of another benchmark - Intel Memory Latency Checker :

The selected fragment has a large read traffic and a low write traffic from the socket's local RAM 1. Ie socket 1 is actively reading something. Also socket 1 has large outgoing QPI traffic, i.e. it actively sends something to socket 0 (there is no one more, there are only two of them. If there are 4 sockets and more, you can also determine the direction by UNIT, specific QPI links). At the same time, socket 0 has a high processor activity. All this suggests that the socket 0 actively accesses data that is located in the RAM of socket 1, which is supported by data on the number of remote calls in the table. Then you can break the table to the level of functions and find specific places in the code responsible for the identified access pattern.
A new type of analysis Memory Access helps to see how the execution of the application code correlates with the physical memory topology of the machine. What memory levels are involved (caches, DRAM, remote DRAM), how memory traffic is distributed. And, most importantly, what code was executed during long memory accesses, and to which data objects these accesses occurred.
Yes, and if anyone has not heard - Intel Parallel Studio can be downloaded for free for various non-commercial needs - details here .
Memory-related metrics have long been available in the VTune Amplifier. A new type of analysis Memory Access not only collected them in one place, but also added several major improvements.
It was before in other types of analysis:
')
- Misses caches of all levels
- Traffic data to local RAM (DRAM bandwidth)
- Number of accesses to local and remote RAM on NUMA machines
Appeared in Intel VTune Amplifier XE 2016:
- Tracking data objects
- Remote traffic data on NUMA machines (QPI bandwidth)
- Average execution time (Average Latency) of instructions for accessing memory or loading data from application objects
So, we start the Memory Access analysis, immediately enable tracking of data objects. This feature is currently available only on Linux.
Or from the command line:
amplxe-cl -c memory-access -knob analyze-mem-objects=true -knob mem-object-size-min-thres=1024 -- ./my_app Memory subsystem metrics
So, we will look at the profile obtained after profiling the benchmark stream. In the upper half of the Bottom-up window, the traffic generated by our application is reflected:
- DRAM bandwidth - read (green), write (red), and total traffic to local RAM for each socket (package).
- QPI outgoing bandwidth - outgoing traffic from one socket to another.
Below is a table showing the main hardware metrics and memory access counters:
- Average Latency - the average number of processor cycles spent on executing instructions for accessing memory or loading data from application objects. This statistical value may not be accurate with short measurements. However, if the value is large, you should pay attention to the other metrics.
- LLC Miss Count - the number of top-level cache misses (usually L3) - divided into references to local RAM, remote RAM, and remote cache, since Downloadable data may be in the cache of another processor.
- Loads and Stores - the number of executed instructions for reading and writing data
- Memory Bound - memory performance metrics
Memory Bound includes the ratio of the number of accesses to remote and local RAM, and metrics in the same categories as top-level cache misses (LLC):
Memory Bound metrics are formulas that include the number of events (for example, LLC misses) and their estimated cost in cycles. The value of the metric is compared with a certain reference value, and is highlighted in pink if it exceeds a predetermined threshold. At the exit, the user receives a hint about what you should pay attention to - a large number of cache misses may indicate inefficient location of data objects, perhaps the “hottest” objects can be placed in a separate block that can be kept in the cache longer.
Data objects
The problems of working with memory are inextricably linked with data objects that previously had to be calculated by oneself. Now you can simply select the grouping with a Memory Object, and observe which objects specifically account for most of the hits, cache misses, etc .:
At the same time, if you double-click on a function on an object, you will be taken to the line of code that performed the memory operation of interest to us:
And if you grouped by the Memory Object Allocation Source and double-click on the object itself, you can determine the place of its creation:
VTune Amplifier recognizes dynamically generated C and C ++ objects and static C, C ++ and Fortran objects.
NUMA problems
On NUMA machines, accessing local RAM is faster than remote memory, because The other socket's RAM has to be accessed via the QPI bus, which is slower than the local RAM access bus. A large number of accesses to the RAM or cache of another socket, together with high values of Average Latency, may indicate an inefficient localization of application data. If, for example, a global data object is created in the main thread, and other threads, possibly running on another socket, actively access it, processor downtime due to remote access to the data is possible. Such problems can be solved by localizing hot data in the stream, “pinning” (pinning) streams, using different NUMA-aware libraries.
Detecting NUMA problems in VTune Amplifier is now quite simple. To begin with, we look at all the metrics with the word Remote, for example, the Remote / Local DRAM ratio - the relative number of remote hits:
You can filter features and objects with high QPI traffic. On the Summary tab in Bandwidth Utilization Histogram we move the sliders, defining which values we consider Low, Medium and High:
In Bottom-up we group by Bandwidth Domain, and see which objects were used (or which code was executed) during times of high QPI load:
Well, traditionally for Bandwidth analysis, bursts of traffic are clearly visible on the timeline. Select this area and filter (right-click, Filter In by selection). The list of functions in the table below will reflect only the code that was executed in the selected time interval:
Below is the result of the profile of another benchmark - Intel Memory Latency Checker :
The selected fragment has a large read traffic and a low write traffic from the socket's local RAM 1. Ie socket 1 is actively reading something. Also socket 1 has large outgoing QPI traffic, i.e. it actively sends something to socket 0 (there is no one more, there are only two of them. If there are 4 sockets and more, you can also determine the direction by UNIT, specific QPI links). At the same time, socket 0 has a high processor activity. All this suggests that the socket 0 actively accesses data that is located in the RAM of socket 1, which is supported by data on the number of remote calls in the table. Then you can break the table to the level of functions and find specific places in the code responsible for the identified access pattern.
Summary
A new type of analysis Memory Access helps to see how the execution of the application code correlates with the physical memory topology of the machine. What memory levels are involved (caches, DRAM, remote DRAM), how memory traffic is distributed. And, most importantly, what code was executed during long memory accesses, and to which data objects these accesses occurred.
Yes, and if anyone has not heard - Intel Parallel Studio can be downloaded for free for various non-commercial needs - details here .
Source: https://habr.com/ru/post/266687/
All Articles