How to create interactive maps
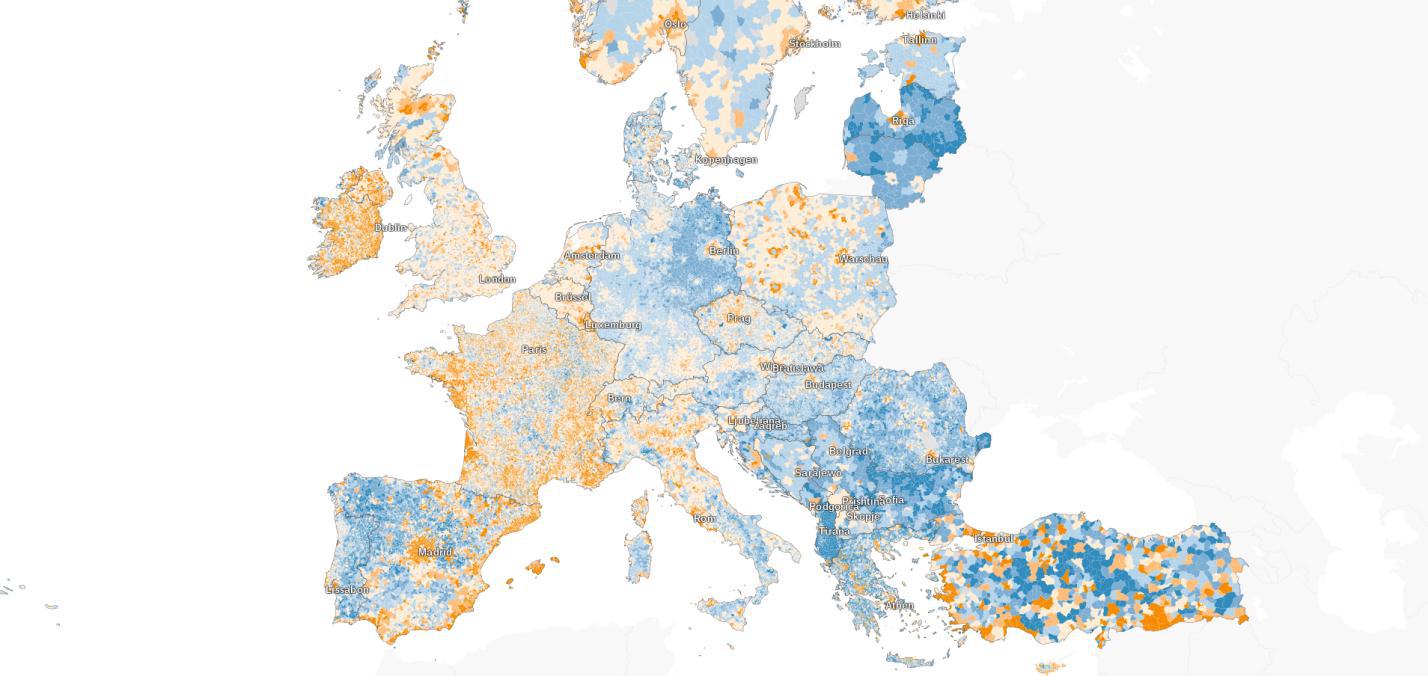
An interactive map was recently published showing the demographic changes in Europe from 2001 to 2011 — a period for which the most detailed statistics from each municipality are available. Using the color scale indicates the degree of loss or population growth in virtually every point in Europe (with the exception of Russia and the CIS countries) and Turkey .
One of the developers of the Airbnb team took part in the work to create this demographic map. Want to know how to create such a project yourself? Then welcome under cat.
Prerequisites
For our example, we use the Berlin data set , which contains information about the buildings and the number of their floors.
')
To begin, prepare the working environment:
Install Tilemill is a mapping application that allows you to quickly and easily create maps using different data sources.
Download ready shape — a file that already contains the necessary data. If you have your own data set, then you need to combine them with shape — the file. There are many ways to do this, for example, using the Quantum GIS .
Get an account on Mapbox - there is a free tariff with a limit of 50,000 map views.
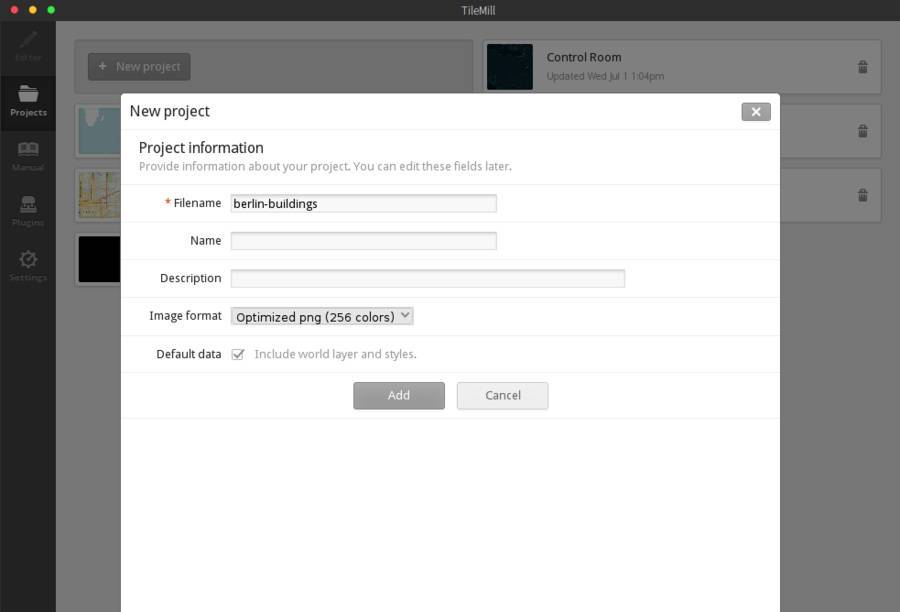
Create a new project
We start by adding a layer on which our map data will be displayed. Run Tilemill and create a new project.
Now on the left you can see a map of the world, and on the right are some of the rules of Carto CSS (the carding language used in TileMill). Thus, the preview of your map is reflected in the left part of the screen, and in the right part you define styles for its different parts.
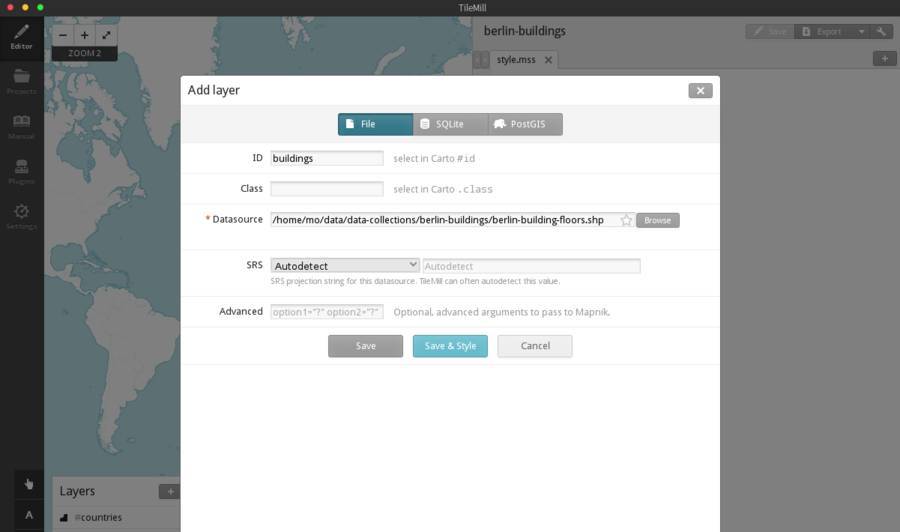
Data injection
Add our shape — a file as a new layer (the layer icon in the lower left corner, Add Layer). ID is a unique identifier for a layer in a project. Select shape — file as the data source and click Save.
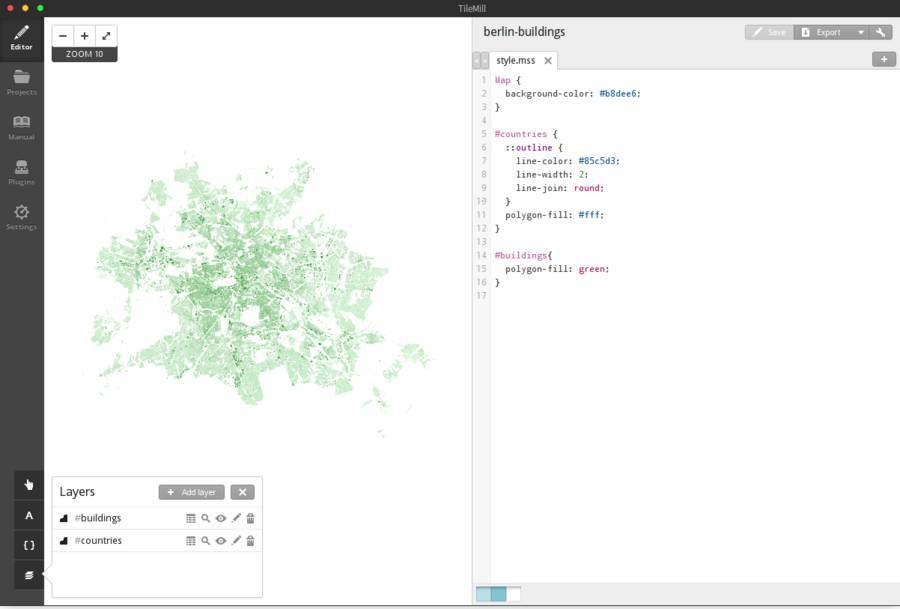
Check that everything works fine. Let's color our shape — a file by adding the following lines:
#buildings{ polygon—fill: green; } Using the “buildings” identifier assigned when adding a layer, we can set the style. Your card should look like this:
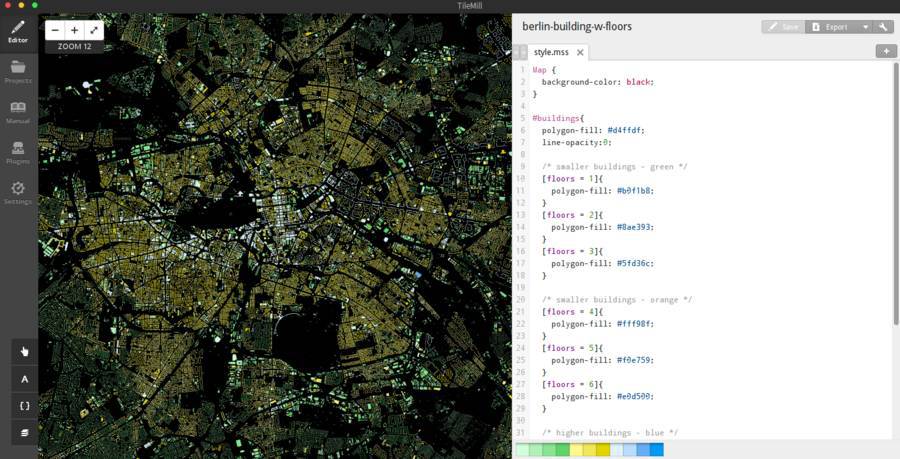
In our example, we want to visualize the floors of buildings. We remove the style of the countries and set the black background of the map.
Map { background—color: black; } For the style of the floors of buildings, we can paint only certain objects suitable to us. In this example, small buildings are painted green, medium-sized ones are orange, and higher ones are painted blue. You can use any colors you like (in this example, Chroma.js Color Scale Helper was used to select colors).
#buildings{ polygon—fill: #d4ffdf; line—opacity:0; /* smaller buildings — green */ [floors = 1]{ polygon—fill: #b0f1b8; } [floors = 2]{ polygon—fill: #8ae393; } [floors = 3]{ polygon—fill: #5fd36c; } /* smaller buildings — orange */ [floors = 4]{ polygon—fill: #fff98f; } [floors = 5]{ polygon—fill: #f0e759; } [floors = 6]{ polygon—fill: #e0d500; } /* higher buildings — blue */ [floors >= 7]{ polygon—fill: #def3ff; } [floors > 15]{ polygon—fill: #bbdcfc; } [floors > 30]{ polygon—fill: #65aef4; } [floors > 60]{ polygon—fill: #0098f0; } } Now you should see something like this:
Add interactivity
You can extract data from the attribute table and display it on the map using prompts / pop-ups. In our example, we want to display a pop-up window with a hint on the number of floors of the building. To enable this feature, you need to click on the hand icon in the lower left corner and select “Teaser”. Now we need to define the layer (“buildings”) on which we want to maintain interactivity, and add “floors” in the section “Content to be shown on hover”.
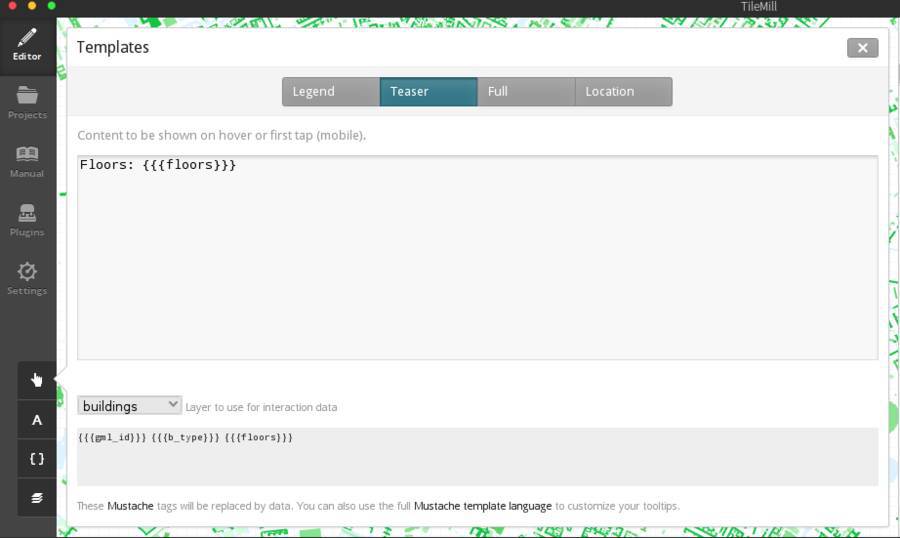
After saving the project, when you hover the cursor on the building will pop up a window with information.
Export mbtiles
Interactivity can be exported to the MBTiles format, specifically designed for storing maps and the ability to access them online and offline.
But before we export our layer, set a transparent background.
Map { background—color: transparent; } In the end, the code should look like this:
Map { background—color: transparent; } #buildings{ polygon—fill: #d4ffdf; line—opacity:0; /* smaller buildings — green */ [floors = 1]{ polygon—fill: #b0f1b8; } [floors = 2]{ polygon—fill: #8ae393; } [floors = 3]{ polygon—fill: #5fd36c; } /* smaller buildings — orange */ [floors = 4]{ polygon—fill: #fff98f; } [floors = 5]{ polygon—fill: #f0e759; } [floors = 6]{ polygon—fill: #e0d500; } /* higher buildings — blue */ [floors >= 7]{ polygon—fill: #def3ff; } [floors > 15]{ polygon—fill: #bbdcfc; } [floors > 30]{ polygon—fill: #65aef4; } [floors > 60]{ polygon—fill: #0098f0; } } To export the layer to mbtiles, you need to click “Export” in the upper right corner and select “MBTiles”. You will have to wait for the data to be rendered. If you cannot define a layer, use the following settings to export the map:
- Zoom: 9 - 13
- Center: 13.3944,52.5141,10
- Bounds: 13.0621,52.3475,13.7089,52.6734
At the end of the process, save * .mbtiles.
Download on MapBox
Take the .mbtiles file and upload it to your Mapbox account . After loading a new layer, find it on the “Data” tab in your account. Now create a new project with this layer:
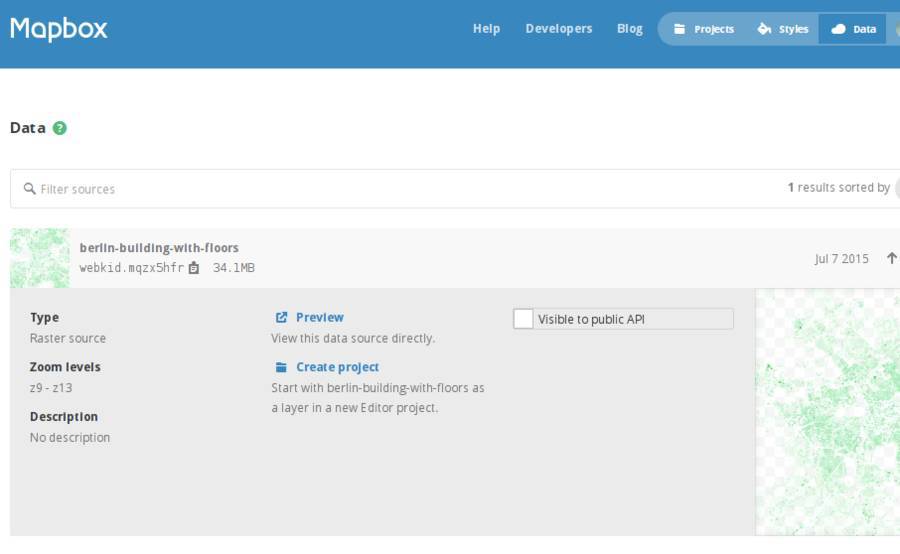
If you do not see the map, use the search bar. Save the map and a copy of the ID (you can find it in the section “Project” -> “Info”).
Web — application
To display the map in the browser, we use Mapbox.js , because it already includes the “grid” layer to describe the interaction of the data, in which we need to display the number of floors. You can also use Leaflet in combination with the utfgrid Plugin .
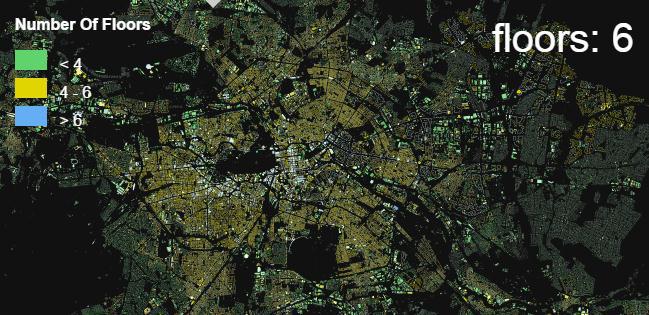
For starters, you can use this template code. It loads the map and shows the number of floors in the console when you hover over the buildings. Just change the passkey and ID card.
<!DOCTYPE html> <html> <head> <meta charset=utf—8 /> <title>Map example</title> <meta name='viewport' content='initial—scale=1,maximum—scale=1,user—scalable=no' /> <script src='https://api.tiles.mapbox.com/mapbox.js/v2.2.1/mapbox.js'></script> <link href='https://api.tiles.mapbox.com/mapbox.js/v2.2.1/mapbox.css' rel='stylesheet' /> <style> * { margin:0; padding:0; } html, body{ height: 100%; } #map { height:100%; width:100%; background: #111; } .building—info { position: absolute; left: .5em; top: .5em; color: white; font—size: 2.5em; font—family: Arial, sans—serif; } </style> </head> <body> <div id='map'></div> <div class='building—info'></div> <script> L.mapbox.accessToken = 'your—access—token'; var mapid = 'your—map—id'; var infoElm = document.querySelector('.building—info'); var map = L.mapbox.map('map', mapid, {gridLayer : false, zoomControl : false }).setView([52.5141,13.3944,10], 11); map.attributionControl.addAttribution('Source: Senatsverwaltung für Stadtentwicklung und Umwelt Berlin'); var dataLayer = L.mapbox.gridLayer(mapid).addTo(map); dataLayer.on('mouseover', function(evt){ if(typeof evt.data === 'undefined'){ return infoElm.innerHTML = ''; } infoElm.innerHTML = 'floors: ' + evt.data.floors; }); </script> </body> </html> As you can see, the above method can quickly and easily create interesting cartographic projects. Of course, if you already have ready data, this is a key component.
Source: https://habr.com/ru/post/266575/
All Articles