Making a Real Forex Robot Idea
It is well known that it is impossible to make money on forex. Changes in currency rates are random, and the broker's commission reduces the likelihood of positive final earnings, often making it completely unattractive, lower than in a casino, for example. Nevertheless, I support myself and my projects exclusively at the expense of forex for three years, I have been going to this for about 7 years and, recalling this path, I decided to write a note for those who are attracted by this anti-scientific earning opportunity.
This is not about the wonderful Grails sold on the Internet, not about high-frequency trading and not about “risk-free” investments in the mythical TOP-20 best traders. Only hardcore: we carry out numerous trading operations, someone manually, someone automatically, and as a result of these operations we get a positive account increase with a statistically significant number of transactions.
People act reflexively, and reflexes are the same for everyone. Acquired reflexes are also recorded in all the same. Any merchant, he trades on forex or on a commodity or futures exchange, learns from his own experience, and more often worse, tries to additionally learn something from smart books, thus quickly adopting the "best practices" of the world of speculators.
Having received a certain trading experience, the trader tries to project it onto his future deals, and a kind of “pattern” is formed in his head, according to which he tries to act. It does not matter what time periods, trading tools and types of analysis he uses. This piece takes into account only two main outcomes: “guessed” and “did not guess”. Depending on each specific test of trader's luck, the pattern varies slightly, improved with this outcome.
')
Technically savvy speculators use various means of automation - neural networks, decision-making algorithms, or even just bare money management methods, such as martingale, for example. Regardless of the chosen method of building trade rules, all developers of trading algorithms (strategies) are united by one goal - to earn money. But this goal is distorted when setting a task: to make bets that will be guessed as often as possible. Therein lies the hopeless mistake of the builders of the trade rakes - it is impossible to guess.
Many traders will fiercely argue with me, but I dare to express the opinion that trying to “guess” in more than 50% of cases on the basis of any amount of historical data (previous experience), insight or technical or fundamental analysis is doomed to failure. Just due to the fact that the price chart displays a random process with a corresponding distribution of outcomes.
You can not guess the result of a random process. It may be lucky or not, but the result will be the same - with reasonable capital management, each transaction will, on average, carry an amount equal to the transaction overhead (spread, commission, slippage, etc.). This refers to a statistically significant number of transactions - stories about two years of profitable trading with hundred – another – third transactions can only speak of luck. Yes, for millions of traders, there are always dozens of lucky ones with success stories. Watch what happens to them through the same number of deals, and see how harmony returns to life.
It may seem that I am trying to put an end to the idea of earning forex in principle, but - no! However, one should abandon the desire to “guess” in favor of the desire to “earn”.
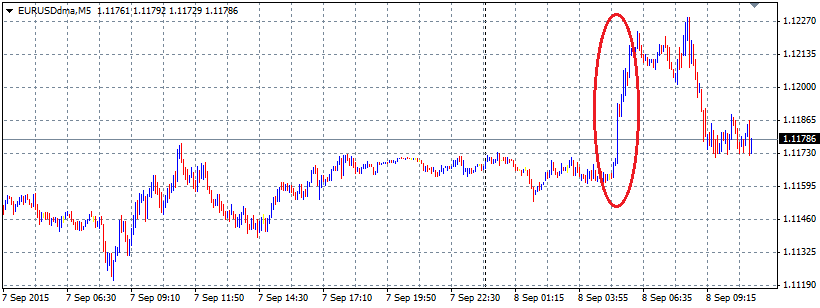
The price movement chart shows us some obvious anomalies in the probability distribution, they manifest themselves, for example, in long recoilless price movements in one direction. Such movements happen when strong economic news comes out, and in the trading world these anomalies are called “tails” on the probability distribution graph. Here, for example, is the indicative case observed on the day of the article preparation:
But it is - the result of external influence. Much more interesting is another thing: even with the presence of “tails,” the probability distribution is so close to normal that it is impossible to make money on knowledge of tails. That is, it is not possible to cover even the overhead costs declared by the broker, not to mention the real costs, including spread expansion, execution at a worse price, etc. The hidden text below experimentally confirms the futility of tails.
Yes, there is a certain imbalance, but the cumulative mind of speculators by their actions, as it were, leads to a normal distribution. Here is the opportunity to earn!
If you take all the patterns that traders use, and summarize them into a certain average set of patterns for making trading decisions, you will find an amazing thing: the entire huge mass of traders act in the same way, making the same mistakes with brutal perseverance.
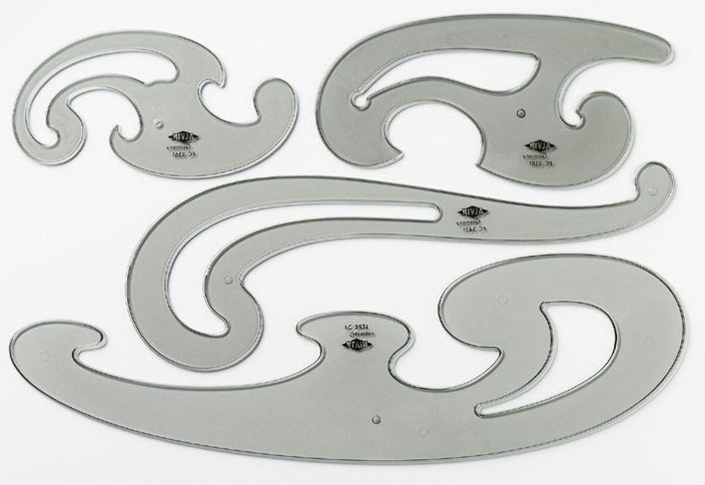
Each of us had a set of such things at school. With all the irregularities and irrationality of their forms, it is very easy and pleasant to trace these figures with a pencil. It will be more difficult to adjust and accurately copy the unique squiggles of an arbitrary pattern. To create new meaningful forms, they are practically unsuitable. The patterns of professional traders are much simpler than the figures presented above, they are straightforward and have only two or three bends - the trader quickly gets used to them and never changes them.
The beauty of patterns of speculators is that they have only one degree of freedom - a vertical movement from one price level to another. Levels have a "magical" property - they give a person the illusion of understanding what is happening at the moment, provoking him to specific actions. The remaining parameters of the real market (time, trading volume, etc.) do not provide such clear guidelines as levels, therefore, they have a relatively weak learning influence on patterns of behavior.
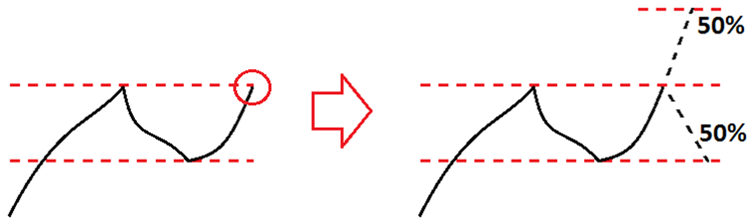
The chart on the left side of the figure shows a typical market situation. The price comes to the level of the previous maximum (top dashed line), and traders around the world are faced with a choice: to buy or sell at this moment? The moment in the picture is marked with a red circle.
The statistical probability of the price reaching the previous minimum is equal to the probability of reaching a symmetric level above the current point (see the right side of the figure).
However, a trader, opening a position in one direction or another, when making further decisions will take into account primarily the direction of his entry. Simply put, the one who bought, guided specifically by this picture, then sells (on average) at a price known in advance; the one who sold will buy at a different price, also known in advance.
It seems to a person that he makes decisions about closing a position, guided by the operational situation, but in fact, knowing the point and direction of his entry into the market, one can predict his exit points at the moment of entry.
More specifically, two exit prices are known in advance: for a profitable and unprofitable transaction. In Forex, most traders close a profitable deal fairly quickly, without accumulating profit, but are willing to suffer losses and not close the position until the total loss of the deposit.
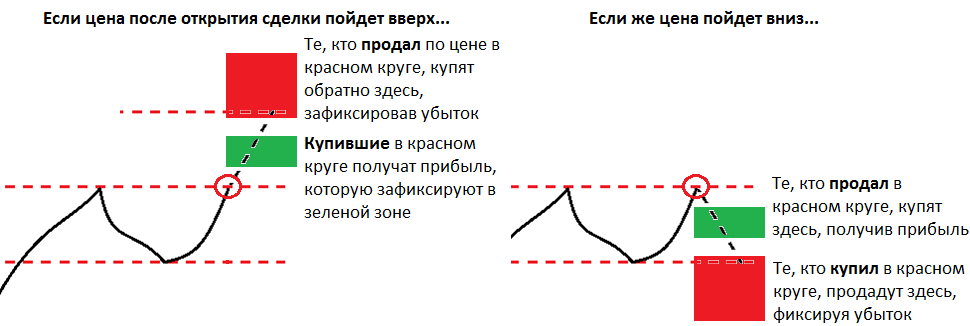
Graphically, this is illustrated in the following figure: traders who have guessed the direction of opening a deal (buying or selling) will take profits in the green zone. Those who do not guess will fix the loss later in time - in the red zone.
The earning idea is that between these two zones a certain non-empty zone often occurs (hereinafter referred to as the Neutral Zone), having got into that, the price will inevitably pass it all. This will happen because the pending orders, which fix the loss in the red zone, "attracted" to his price. Remember, above, I stated that the actions of traders adjust the probability distribution? This is a hypothesis that I tested in practice - it really works, and you can immediately use it! (I spent 5 years on finding and proving this.)
Based on the foregoing, if we fix a profit or loss between the green and red zones, then we work a little better than the average speculator, and since the speculator works at 0 (without taking into account the broker’s commission), then we work as a plus.
It does not matter whether we guessed with the direction of the transaction or not, we closed at a plus or a minus. As soon as the price was in the Neutral zone, everything, the template worked, and you can close the deal without hesitation. Even with a large number of unprofitable transactions in a row, they will be followed by a number of profitable ones, and the result of trading will be positive. Of course, in order for a positive expectation to be clearly manifested, the number of transactions must be statistically significant.
Now back to the patterns of speculators' behavior that will allow us to better distinguish the lower boundary of the green zone (where we will fix the loss) and the upper boundary of the red zone (there should be fixed profits). The market is constantly changing, working with different amplitudes, different liquidity, different intensity of its participants, etc. But the decision-making mechanism of the market participant does not change, whether it is a person or a trading robot, which only allows a person to pay the commission to his broker more quickly. This also applies to high-frequency trading, too (we do not take into account front-runners and other scammers).
So, the market participant corrects his vision of the situation, based on previous experience, and more recent episodes have a greater influence on his decisions. The pattern of behavior is one, but its parameters are constantly floating in small limits, are adjusted in the light of recent events. It is necessary to adjust to this process, taking into account the minimum sufficient set of historical data. If we analyze a lot of data, we will get a large amount of calculations with an insignificant utility of a significant part of them.
The most important point when working with templates is that they have a cumulative effect, therefore, choosing a specific time interval for work (for example, a period of 50 bars on a five-minute chart), it is necessary to work out every match of the template clearly, without missing a single opportunity.
The physical meaning of the previous paragraph, if very simplistic, is this: each adjustment of the pattern in the speculator's head takes into account several past adjustments, and sometimes the pattern changes radically. Anger or euphoria on opposite sides of the barricades (in those who bought and sold) accumulate, and at times the general psychosis very advantageously expands the Neutral Zone. Such cases should not be missed!
By the way, the huge mass of traders considers the market on different scales, so what we see in our picture is only a minor episode on a larger scale, which, in turn, is also a fragment of the big picture ... And so on. Therefore, it is very important to consider a strictly limited part of the schedule, as well as to simplify it to the limit (there is no time, no volumes, no bends, etc., but there are only a few levels indicated by local extremums).
The template that works on the site we have chosen will also work on any other scale, and then all that remains is to do many, many transactions and earn.
In general, this article already has enough information so that the reader can independently work out templates and in another year or another adapt to actually earn from so-called forex brokers. The animal grin of forex is what awaits you on this thorny path, and I'm not joking. We have to do a lot of work.
In the next article, if it appears, I will talk about the realities and prejudices of forex (and not only him); why you will not immediately become a dollar millionaire, even with a profitable trading system; what to take into account if you dare to try to make money in this entertainment industry, and something else. Thanks for attention!
This is not about the wonderful Grails sold on the Internet, not about high-frequency trading and not about “risk-free” investments in the mythical TOP-20 best traders. Only hardcore: we carry out numerous trading operations, someone manually, someone automatically, and as a result of these operations we get a positive account increase with a statistically significant number of transactions.
People act reflexively, and reflexes are the same for everyone. Acquired reflexes are also recorded in all the same. Any merchant, he trades on forex or on a commodity or futures exchange, learns from his own experience, and more often worse, tries to additionally learn something from smart books, thus quickly adopting the "best practices" of the world of speculators.
Having received a certain trading experience, the trader tries to project it onto his future deals, and a kind of “pattern” is formed in his head, according to which he tries to act. It does not matter what time periods, trading tools and types of analysis he uses. This piece takes into account only two main outcomes: “guessed” and “did not guess”. Depending on each specific test of trader's luck, the pattern varies slightly, improved with this outcome.
')
Technically savvy speculators use various means of automation - neural networks, decision-making algorithms, or even just bare money management methods, such as martingale, for example. Regardless of the chosen method of building trade rules, all developers of trading algorithms (strategies) are united by one goal - to earn money. But this goal is distorted when setting a task: to make bets that will be guessed as often as possible. Therein lies the hopeless mistake of the builders of the trade rakes - it is impossible to guess.
Many traders will fiercely argue with me, but I dare to express the opinion that trying to “guess” in more than 50% of cases on the basis of any amount of historical data (previous experience), insight or technical or fundamental analysis is doomed to failure. Just due to the fact that the price chart displays a random process with a corresponding distribution of outcomes.
You can not guess the result of a random process. It may be lucky or not, but the result will be the same - with reasonable capital management, each transaction will, on average, carry an amount equal to the transaction overhead (spread, commission, slippage, etc.). This refers to a statistically significant number of transactions - stories about two years of profitable trading with hundred – another – third transactions can only speak of luck. Yes, for millions of traders, there are always dozens of lucky ones with success stories. Watch what happens to them through the same number of deals, and see how harmony returns to life.
It may seem that I am trying to put an end to the idea of earning forex in principle, but - no! However, one should abandon the desire to “guess” in favor of the desire to “earn”.
The price movement chart shows us some obvious anomalies in the probability distribution, they manifest themselves, for example, in long recoilless price movements in one direction. Such movements happen when strong economic news comes out, and in the trading world these anomalies are called “tails” on the probability distribution graph. Here, for example, is the indicative case observed on the day of the article preparation:
But it is - the result of external influence. Much more interesting is another thing: even with the presence of “tails,” the probability distribution is so close to normal that it is impossible to make money on knowledge of tails. That is, it is not possible to cover even the overhead costs declared by the broker, not to mention the real costs, including spread expansion, execution at a worse price, etc. The hidden text below experimentally confirms the futility of tails.
Yes, there is a certain imbalance, but the cumulative mind of speculators by their actions, as it were, leads to a normal distribution. Here is the opportunity to earn!
If you take all the patterns that traders use, and summarize them into a certain average set of patterns for making trading decisions, you will find an amazing thing: the entire huge mass of traders act in the same way, making the same mistakes with brutal perseverance.
Each of us had a set of such things at school. With all the irregularities and irrationality of their forms, it is very easy and pleasant to trace these figures with a pencil. It will be more difficult to adjust and accurately copy the unique squiggles of an arbitrary pattern. To create new meaningful forms, they are practically unsuitable. The patterns of professional traders are much simpler than the figures presented above, they are straightforward and have only two or three bends - the trader quickly gets used to them and never changes them.
The beauty of patterns of speculators is that they have only one degree of freedom - a vertical movement from one price level to another. Levels have a "magical" property - they give a person the illusion of understanding what is happening at the moment, provoking him to specific actions. The remaining parameters of the real market (time, trading volume, etc.) do not provide such clear guidelines as levels, therefore, they have a relatively weak learning influence on patterns of behavior.
The chart on the left side of the figure shows a typical market situation. The price comes to the level of the previous maximum (top dashed line), and traders around the world are faced with a choice: to buy or sell at this moment? The moment in the picture is marked with a red circle.
The statistical probability of the price reaching the previous minimum is equal to the probability of reaching a symmetric level above the current point (see the right side of the figure).
Verification of the equiprobability of achieving symmetrical levels and the futility of tails.
To test on historical data, we will write the simplest robot that will open trades when the “channel” is broken through: the price range bounded by the dashed lines in the picture above. The robot will close trades when it reaches one of the symmetrical levels - opposite the channel border or the line equidistant from it from above.
If the probabilities of reaching the levels are not 50/50, then we will get some specific financial result on a tangible set of transactions - positive or negative. In particular, if the above-mentioned "tails" really do not fit into the normal distribution, then the opening on the breakdown of the channel to the outside will bring steady profits.
Below are the results of a series of tests on historical data for two variants of the conditional commission of a broker: 1 point (left) and 7 points (right). For reference: 7 points is the minimum, stated in the advertisement, the commission of the forex broker for the most liquid pair EURUSD; the real values differ by at least 2 times and range from 14 to 27 points.
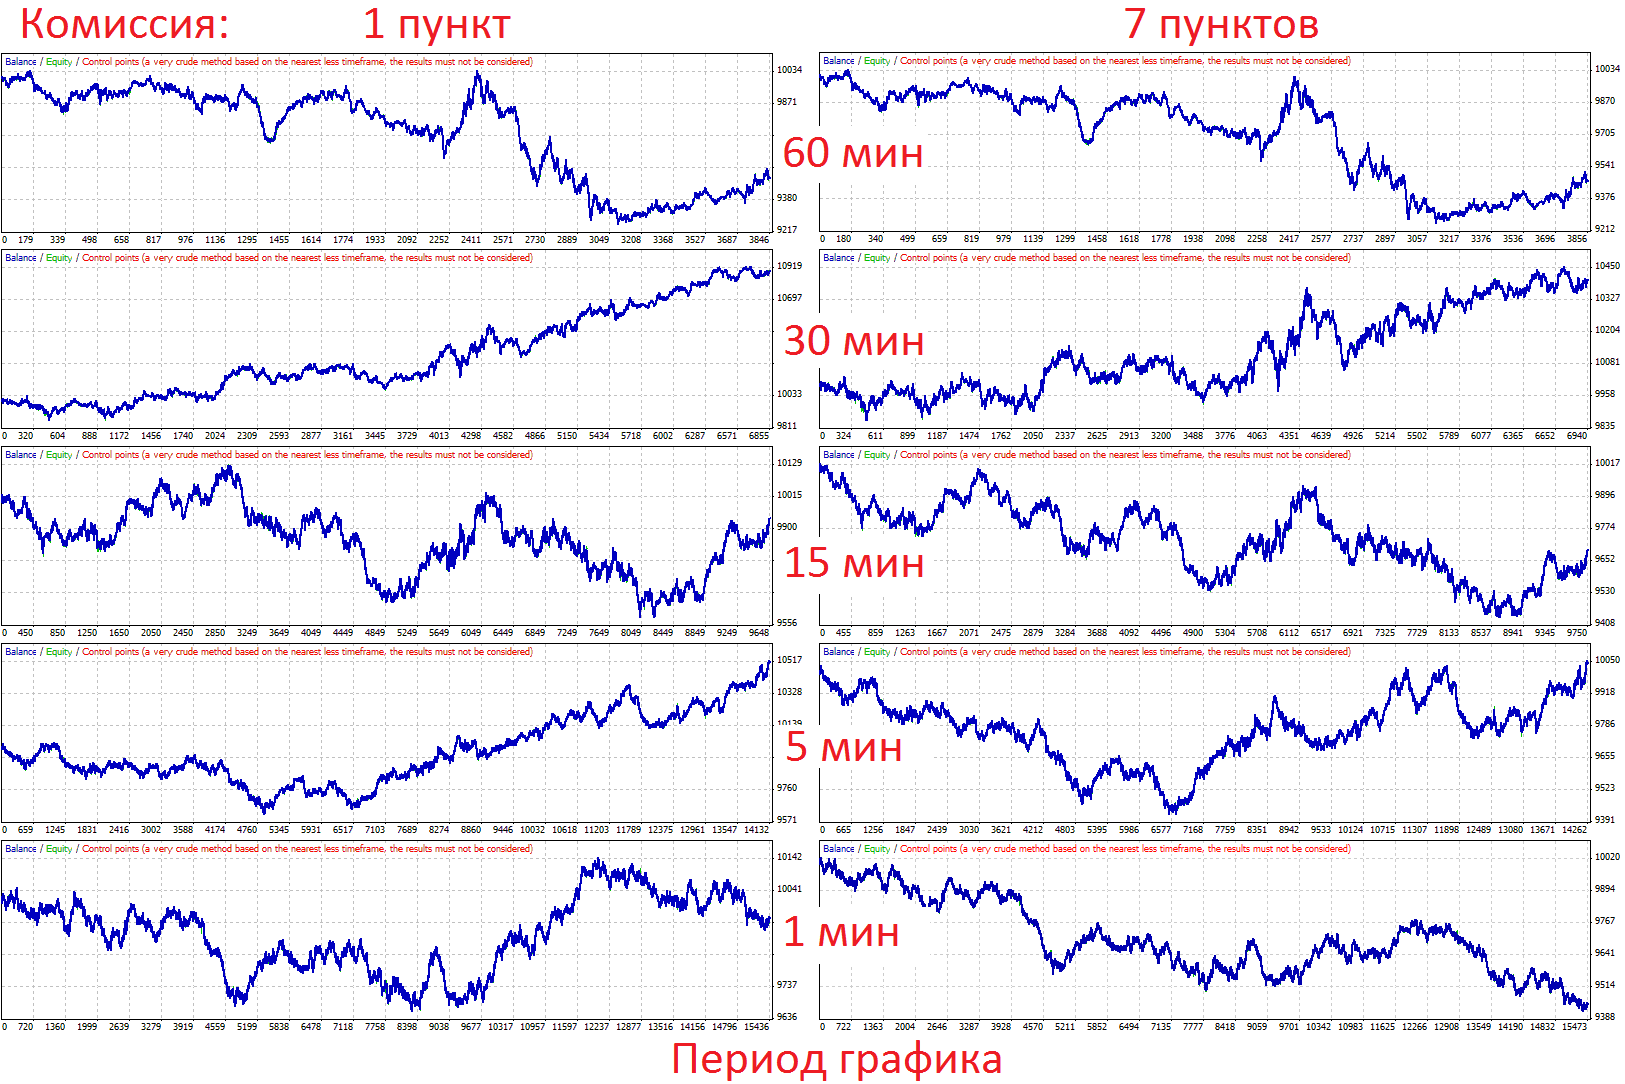
The robot was launched on various periods of price charts in order to receive a series of independent tests on the history of quotations for 15 years. During each test, between 4000 and 15500 transactions were calculated (the longer the chart period, the fewer transactions the robot has time to open).
For tests with a commission of 1 point, we have an average profit factor (Profit factor) of 1.008. In one of the pictures, the balance chart has a pronounced trend, and the general microscopic bias is in the direction of profit. Tests in terms of the ideal broker give a profit ratio of 0.992. That is, the influence of the deviation of the probability distribution from the normal is so small that it is impossible to make money only on the knowledge of its existence.
Please note that the more trades made by the robot, the stronger the balance curve is nailed down, especially in the lower right chart - 15,500 transactions with a commission of 7 points changed the result unrecognizably compared to the conventionally zero commission (lower left chart).
The robot with its source codes is very simple and accessible to anyone who wants to independently verify this test with different parameters - the result on a large number of transactions will be the same.
If the probabilities of reaching the levels are not 50/50, then we will get some specific financial result on a tangible set of transactions - positive or negative. In particular, if the above-mentioned "tails" really do not fit into the normal distribution, then the opening on the breakdown of the channel to the outside will bring steady profits.
Below are the results of a series of tests on historical data for two variants of the conditional commission of a broker: 1 point (left) and 7 points (right). For reference: 7 points is the minimum, stated in the advertisement, the commission of the forex broker for the most liquid pair EURUSD; the real values differ by at least 2 times and range from 14 to 27 points.
The robot was launched on various periods of price charts in order to receive a series of independent tests on the history of quotations for 15 years. During each test, between 4000 and 15500 transactions were calculated (the longer the chart period, the fewer transactions the robot has time to open).
For tests with a commission of 1 point, we have an average profit factor (Profit factor) of 1.008. In one of the pictures, the balance chart has a pronounced trend, and the general microscopic bias is in the direction of profit. Tests in terms of the ideal broker give a profit ratio of 0.992. That is, the influence of the deviation of the probability distribution from the normal is so small that it is impossible to make money only on the knowledge of its existence.
Please note that the more trades made by the robot, the stronger the balance curve is nailed down, especially in the lower right chart - 15,500 transactions with a commission of 7 points changed the result unrecognizably compared to the conventionally zero commission (lower left chart).
The robot with its source codes is very simple and accessible to anyone who wants to independently verify this test with different parameters - the result on a large number of transactions will be the same.
However, a trader, opening a position in one direction or another, when making further decisions will take into account primarily the direction of his entry. Simply put, the one who bought, guided specifically by this picture, then sells (on average) at a price known in advance; the one who sold will buy at a different price, also known in advance.
It seems to a person that he makes decisions about closing a position, guided by the operational situation, but in fact, knowing the point and direction of his entry into the market, one can predict his exit points at the moment of entry.
More specifically, two exit prices are known in advance: for a profitable and unprofitable transaction. In Forex, most traders close a profitable deal fairly quickly, without accumulating profit, but are willing to suffer losses and not close the position until the total loss of the deposit.
Proof of asymmetry of the amounts of profitable and unprofitable transactions.
The figure shows the number and total profit of transactions for different winnings. Winnings are measured in points. The horizontal axis shows the winnings: from 0 to 5 points, over 5 to 10 points, over 10 to 20, etc. The same for losses.
In the sample there were a variety of trading tools, taken a statistically significant number of transactions over a long period, and this sample in any forex company will be almost the same.
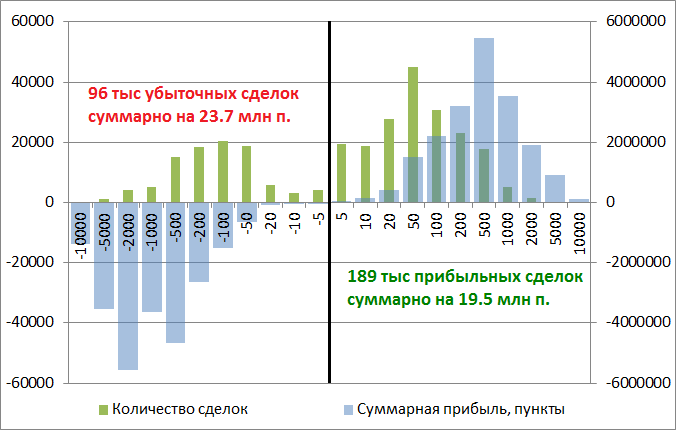
The figure shows that losing trades are two times less profitable, but their amounts are quite balanced. The difference is due to overhead, which is about 15 points per transaction. The peaks of the number of transactions and, especially, of the win / loss amounts are noticeably asymmetrical: unprofitable transactions are much longer, which was to be proved.
In the sample there were a variety of trading tools, taken a statistically significant number of transactions over a long period, and this sample in any forex company will be almost the same.
The figure shows that losing trades are two times less profitable, but their amounts are quite balanced. The difference is due to overhead, which is about 15 points per transaction. The peaks of the number of transactions and, especially, of the win / loss amounts are noticeably asymmetrical: unprofitable transactions are much longer, which was to be proved.
Graphically, this is illustrated in the following figure: traders who have guessed the direction of opening a deal (buying or selling) will take profits in the green zone. Those who do not guess will fix the loss later in time - in the red zone.
The earning idea is that between these two zones a certain non-empty zone often occurs (hereinafter referred to as the Neutral Zone), having got into that, the price will inevitably pass it all. This will happen because the pending orders, which fix the loss in the red zone, "attracted" to his price. Remember, above, I stated that the actions of traders adjust the probability distribution? This is a hypothesis that I tested in practice - it really works, and you can immediately use it! (I spent 5 years on finding and proving this.)
Based on the foregoing, if we fix a profit or loss between the green and red zones, then we work a little better than the average speculator, and since the speculator works at 0 (without taking into account the broker’s commission), then we work as a plus.
It does not matter whether we guessed with the direction of the transaction or not, we closed at a plus or a minus. As soon as the price was in the Neutral zone, everything, the template worked, and you can close the deal without hesitation. Even with a large number of unprofitable transactions in a row, they will be followed by a number of profitable ones, and the result of trading will be positive. Of course, in order for a positive expectation to be clearly manifested, the number of transactions must be statistically significant.
"Show the statement!"
This mocking greeting was accepted among traders when the interlocutor requires real confirmation of certain statements. Here is an example of statistics for a single real account that has been working in public for just under three years. I don’t quote a link to an account here, so as not to advertise a particular broker (they are all fundamentally the same), but anyone can check the accuracy of the data by contacting me personally.
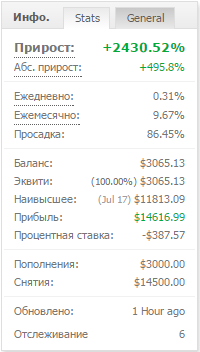
The account was initially replenished with 3000 USD, after which it was gradually withdrawn from it, withdrawing a total of 14,500 USD. The maximum temporary loss was 86% of the account balance - this is the result of the longest band of “unresolved transactions”, after which a positive mat. the expectation brought the score to the new heights of profitability. By the way, the calculated maximum loss, at which the normal operation of the system is still possible, is 95%.
The averaged picture of transactions (6920 pieces at the time of this writing) is shown below:
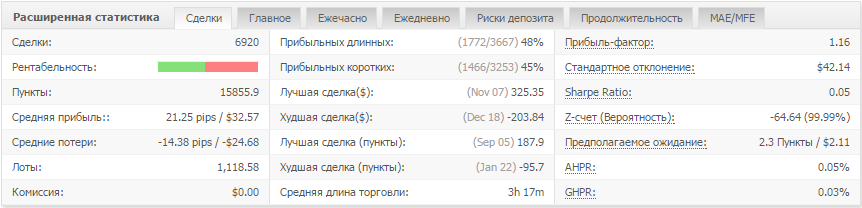
The winning deals are only 46.8%, but the average profit exceeds the average loss by almost one and a half times, reflecting how much this trading system works better than the average forex trader.
The account was initially replenished with 3000 USD, after which it was gradually withdrawn from it, withdrawing a total of 14,500 USD. The maximum temporary loss was 86% of the account balance - this is the result of the longest band of “unresolved transactions”, after which a positive mat. the expectation brought the score to the new heights of profitability. By the way, the calculated maximum loss, at which the normal operation of the system is still possible, is 95%.
The averaged picture of transactions (6920 pieces at the time of this writing) is shown below:
The winning deals are only 46.8%, but the average profit exceeds the average loss by almost one and a half times, reflecting how much this trading system works better than the average forex trader.
Now back to the patterns of speculators' behavior that will allow us to better distinguish the lower boundary of the green zone (where we will fix the loss) and the upper boundary of the red zone (there should be fixed profits). The market is constantly changing, working with different amplitudes, different liquidity, different intensity of its participants, etc. But the decision-making mechanism of the market participant does not change, whether it is a person or a trading robot, which only allows a person to pay the commission to his broker more quickly. This also applies to high-frequency trading, too (we do not take into account front-runners and other scammers).
So, the market participant corrects his vision of the situation, based on previous experience, and more recent episodes have a greater influence on his decisions. The pattern of behavior is one, but its parameters are constantly floating in small limits, are adjusted in the light of recent events. It is necessary to adjust to this process, taking into account the minimum sufficient set of historical data. If we analyze a lot of data, we will get a large amount of calculations with an insignificant utility of a significant part of them.
The most important point when working with templates is that they have a cumulative effect, therefore, choosing a specific time interval for work (for example, a period of 50 bars on a five-minute chart), it is necessary to work out every match of the template clearly, without missing a single opportunity.
The physical meaning of the previous paragraph, if very simplistic, is this: each adjustment of the pattern in the speculator's head takes into account several past adjustments, and sometimes the pattern changes radically. Anger or euphoria on opposite sides of the barricades (in those who bought and sold) accumulate, and at times the general psychosis very advantageously expands the Neutral Zone. Such cases should not be missed!
By the way, the huge mass of traders considers the market on different scales, so what we see in our picture is only a minor episode on a larger scale, which, in turn, is also a fragment of the big picture ... And so on. Therefore, it is very important to consider a strictly limited part of the schedule, as well as to simplify it to the limit (there is no time, no volumes, no bends, etc., but there are only a few levels indicated by local extremums).
The template that works on the site we have chosen will also work on any other scale, and then all that remains is to do many, many transactions and earn.
In general, this article already has enough information so that the reader can independently work out templates and in another year or another adapt to actually earn from so-called forex brokers. The animal grin of forex is what awaits you on this thorny path, and I'm not joking. We have to do a lot of work.
In the next article, if it appears, I will talk about the realities and prejudices of forex (and not only him); why you will not immediately become a dollar millionaire, even with a profitable trading system; what to take into account if you dare to try to make money in this entertainment industry, and something else. Thanks for attention!
Source: https://habr.com/ru/post/266457/
All Articles