As I wrote the rainy map
In the wake of a recent publication about working with meteorological maps, I decided to write about my own similar experience.
Somewhere at the end of May, once again figuring out whether a thunderstorm from the clouds outside the window gathered, I thought: even if they put on meteorological radar, which they bypass thunderstorms, are there really no similar stationary radar? And if they are, aren't images available on the Internet?
Not the fastest search on the Internet has shown that such radars exist, they are called DMRL (Doppler meteorological radar), and pictures from them are really exposed on the Internet. There is a Russian site meteorad.ru , Belarusian meteoinfo.by (although it is not available from Russia, not from Russia, see the drop-down menu on the left), and there is also a site orm.mipt.ru. At the same time, the most pleasant pictures are on meteorad.
')
I soon realized that the meteorological radius lacked three things: a good cartographic substrate, history over the past few hours, and combining images from several radars. On some other site I found a map with this functionality, but there wasn’t the Nizhny Novgorod radar I was most interested in. Well, it means that you need to make such a card yourself.
Well, let's get started. GitHab for those who (suddenly?) Want to keep track of the story in more detail than what I am describing here.
A typical picture from the meteorological attack looked like this at the time:
To begin with, let's just take this type of image from the meteoric radius, cut it off and, without deleting the background, try to apply OSM to the map substrate. Fortunately, I most likely know exactly where the Nizhny Novgorod radar is located. I took OpenLayers as a framework, set it up, selected the size of the image so that the cities marked on the radar more or less coincided ... but still the cities, roads and rivers marked on the radar map do not match well with the OSM substrate.
Well, maybe the radar background map is not very good? Here is the Kostroma radar
If you look closely at the fine details of the background map, you can see that, most likely, on both radars there is a map from the same source: all the bends of all the lines are the same, etc. Let's try to align two pictures from the radar?
Well, somehow I tried to align the Kostroma and Nizhny Novgorod radars relative to each other. Here is the status of the project at that time :
It can be seen that, although the Vladimir – Vyazniki section leveled more or less well (two radars relative to each other, rather than the OSM substrate), the alignment of the remaining sections leaves much to be desired. Of course, it is possible to align and a little better, but all the same - in different places the alignment error vector is clearly different, so perfect alignment will not work. Moreover, it can be seen that the alignment error is substantially larger than the pixel size of the rain, so you really want to align better.
Actually, the cause of the problems is obvious: hardly on meteorad use the same projection of the Web Mercator, as in OSM and OpenLayers, but what kind of projection on meteorad is not very clear. Of course, the first thing that comes to mind is an equidistant azimuthal projection — it is in this projection that the radar “sees” the terrain (the radar knows the direction and distance from which the signal came — if we draw a point corresponding to this signal in polar coordinates, it is at this polar angle and at a proportional distance, this will be an equidistant azimuthal projection.)
I didn’t have exact confidence in this (especially in equilibrium ), but comrade advised a simple test: to compare the sections along the straight line NN — Kostroma cut from Nizhny Novgorod and Kostroma radars. HH — Kostroma lines were almost equal in length, and all the objects lying on this line (intersections with rivers and borders) were also in the same place on both radars; all this clearly spoke in favor of equidistantness. A little later on the meteorad website I found a separate document describing the operation of radars, and there it was also said that the projection of the final images is an equidistant azimuth.
Well, we will assume that we found out. At the same time, the same comrade advised me to use hugin to stitch pictures from different radars. I tried. Yes, it stitches well, but it’s unclear how to lay OSM on the substrate. Therefore, I decided that it would be better to sort out the projections and convert honestly.
Well, you need to be able to translate a picture from one projection to another. A quick search in Google, to some of my surprise, did not provide any ready-made tools for conversion. (Later, in the comments to the post from alexkuku, GDAL was advised to me - although not to say that it’s easy to understand from their website how to convert images between projections.) Ok, it’s not so difficult to translate pictures manually, since the library can translate individual coordinates quite to themselves are. Picked up the scale, determining the coordinates of a number of cities on the Nizhny Novgorod radar (although I could not perfectly reproduce these coordinates using the same scale.) I wrote a simple python conversion script using pyproj, converted it, everything became noticeably better.
True, the question of the location of the radar in Kostroma has now become significantly more important, especially since it is necessary to know this not only for the final placement of the picture on the map, but also for conversion (although in the latter case, the error due to the wrong center is probably less). A quick Google on “DRL Kostroma” reports that the radar is actually called Sokerkino, and this is a small village at the southern end of Kostroma airport. (And yes, of course, the airport itself is also called Sokerkino, and the radar is rather named after the airport, not the village, but I realized this only much later. At OSM there is a village name, but there is no airport name, so I found only one object with this name - the village.) I substituted the coordinates of the village as the coordinates of the radar, did the conversion, slightly corrected the coordinates and at the same time the scale - oh, everything became much better!
Version of the project at that time and
It can be seen that the coincidence of the images from the two radars is very good, the errors are clearly smaller than the size of the pixel of the rain, so the errors can be neglected. The coincidence with the background substrate is also very good, although it leaves much to be desired in places (especially noticeable on Vyazniki, Ivanovo and Semenov).
In fact, the discrepancy is even brighter in Vologda:
... and the reason is immediately visible: the roads coincide relatively well, only Vologda itself does not coincide. But at the same time, on OSM, Vologda is located south of the M-8 highway, and on the map from the radar - to the north! Clear card error with radar. Therefore, apparently, all the remaining errors will have to be attributed to the errors of the maps from the radar, and to conclude that it is not possible to superimpose the maps from the radars to OSM because of the inaccuracy of the first ones. It is possible that on the map from the radar there are not cities, but, for example, meteorological stations, which may be a little apart. (Actually, maybe because some cities are marked with triangles, and some - by circles?)
Great, let's add the Moscow radar as well to check that everything is aligned well with us. The radar is called “Profsoyuznaya”, and I even seemed to find on the Internet information about exactly which house on ul. The trade union is worth the radar, but still had to slightly move the center to get a reasonable alignment with other radars.
New version and
The match is very good, further confirms that we are doing everything correctly.
That's just a converter on python works for a long time. 30 seconds to convert one image is too much. At first I was very surprised, I thought that the main bottleneck is directly recalculating the coordinates, a few cosines-sines-what-else-there to a point, and it’s unlikely the speed of this depends on the programming language. But ok, I rewrote everything in C ++ (with OpenCV for working with pictures), now converting one picture takes a couple of seconds.
... It would seem that little remains: to remove the background from the pictures - and you can use. It seemed so until the moment when I suddenly discovered that my alignment of Moscow had suddenly moved.
How so? Here you saw on the pictures displayed on meteorad (see examples at the beginning of the post), scroll bars. And then one day I discovered that the image from the Moscow radar had shifted vertically. As if the pictures on meteorad are real screenshots from some computer, and someone came up to this computer and moved the scroll bar.
Well, we will detect the center of the picture. Naturally, I did not want to be attached to any features of the background map; I wanted to come up with a method that will easily work for all radars at once. I implemented the following approach: the image has gray grid bars. The vertical center is on one of these horizontal stripes, it remains to determine which one. To do this, we have a dark gray background outside the radar's visibility range. The closer to the present center, the less this dark gray on each particular horizontal. Therefore, from all the strips of the grid, choose the one around which the horizontal (plus or minus 50 pixels in height) is the least dark external background. Hooray, it works. Since there is a horizontal scroll bar on the picture, we will implement the same approach for detecting the vertical on which the center is located.
Go ahead. Now you can write a script that regularly pulls out new images from the meteorological radar. Every minute we will poll the site, download the picture and, if it has changed, then convert it. As experience has shown, new pictures appear around: 07,: 17,: 27, ...,: 57 minutes of each hour - well, plus or minus a minute. (On the pictures themselves, in the right upper corner, the time is indicated, I even thought that it was possible to parse it to determine at what time this or that picture exactly belongs, but my hands never reached this point. So, this time is always a multiple of 10 minutes and 6-7 minutes less than the time of putting pictures.)
Now, so that it can somehow be used, we will remove the background from the pictures. To begin with, I wrote a very simple method: all light gray pixels of the internal background and all dark gray pixels of the external background are changed to transparent ones; at the same time we add the bounds of the radar field of view - to those pixels in the vicinity of which there is both an internal and external background. The grid and the names of the cities remain, but in principle, what turned out can already be used.
All is well, but green clouds are lost on MapQuest's green background. The idea: make a black and white OSM layer. I don’t want to raise my own tile-server (although still the project is already tied to proj and opencv for working with pictures, so it will only work on vps). Looking for some standard black and white layer, I find nothing. Apparently, earlier there was a black-and-white Mapnik, but now it does not work. I find a number of options with OpenMapSurfer or CartoDB, but they do not really suit me.
At the same time I discover that with OpenLayers you can set the layer's value to saturation. I set to zero - nothing changes. By experimenting, I establish that saturation only works if OpenLayers is switched to webgl mode, and this does not work in many browsers, and in many others it slows down. Sorry. In general, I played with different options and so far I returned the color MapQuest.
Somewhere here I buy a simple vps and post the project to the network. While available only through direct ip, I didn’t want to buy a domain right away. At the same time I am writing a letter to the administrators of the site meteorad.ru (according to the only email found on the site) asking if their pictures can be used as follows. I never received an answer, but now my conscience is constantly bothering me: was this letter the cause of all subsequent events, namely, the closure of access to real-time data? I thought whether they should write or not, understanding that if they write, they can be banned, and if they don’t write, they may not notice, but decency still overpowered and I wrote.
I make a more advanced version of removing the background - namely, now I replace all pixels with transparent pixels that are not in the list of symbols for rains. This is a fairly obvious option, but there is one problem: black. Black is used for two things at once: for signatures of cities and for designating winds. The winds are shown both as small black “ticks” in the clouds, and as large black lines protruding from the centers of the radar. Information about the wind really want to save, without it it is not clear where to expect the movement of clouds. (I plan to animate the story, but I still want to leave the wind direction.)
Here is a simple approach so easy to imagine. I decided to do this: I take several images from the same radar, but from different days, and leave those pixels that are the same on all the images (the benefit of the city names are applied on top of the precipitation) - I get what I called the “template”. This will be primarily the names of cities, because the winds will have time to change. Accordingly, now, when I process the next image and stumble upon a black pixel, I can look at the template and, if there is also a black pixel, then I need to remove this black pixel from the image, otherwise it is the wind - it should be left.
I had to tinker a little more to defeat anti-aliasing effects in city signatures (not all pixels are actually black there). I have no final pictures left, but below will be a rough idea of what happened at this stage.
In the meantime, I am still not satisfied with any variants of the OSM substrate, which I find. I decide to make a “proxying” tile-server: at the request of a specific box, it will download the same box from some public server, convert it to black and white, and give it to the user. From a variety of publicly accessible servers, I chose chepetsk.net for the fact that the map is sufficiently detailed even on a small scale. I wrote a simple proxying script, plus it turned out that simply translating to black and white is bad, you need to lower the contrast and lighten it. As a result, I stopped at a simple formula: the color of the new pixel is
The current result (artifacts from anti-aliasing city signatures have not been completely cleaned here):
Next is easier. Let's do an auto-update: the download script writes information about new pictures to a json file, the javascript on the client side checks every 10 seconds if new pictures appear in this file. So far, for simplicity, I did not bind to any database. In the same json now there is information about all the pictures ever downloaded, so there is no problem to make the story play. A little fiddling with JS, did. True, the loading of pictures slows down, so I had to make the client cache them first.
(Yes, at this point in json I had information about all the pictures I had ever downloaded, and all those pictures were stored on the disk. I was afraid that the place would quickly end, and json would grow to incredible sizes, but in a couple of months everything was still reasonable. Then, of course, it would be necessary to switch to the database and delete old records and pictures.)
There was one more problem: from time to time the individual pictures on the meteorade ceased to be updated. The update was restored after a few hours, sometimes up to a day, during all this time my download script saw that the picture had not changed, and I thought that everything was in order. As a result, the last available picture was displayed on the map. I thought to do something about it - not to display pictures of age more than an hour or the like. - but so the hands did not reach.
The entertainment continued. On another day, I found that the pictures on my site are not updated, although everything works on the meteo-weather. It turned out that they decided to change the format of the images on the meteorade: from 32-bit PNG to 8-bit palette. And for some reason, the standard imread () from OpenCV refused to open such pictures. Googled a bit how to load palette pictures in OpenCV, didn’t find anything sensible and decided: since I have everything on vps, you can simply find some command line utility in Linux that translates from 8-bit palette png to 32-bit , and run it before running the actual conversion. He did. At the same time, another problem emerged: now, firstly, the colors on the meteorating floated on the pictures and the colors had to be compared not for an exact match, but for a small difference of components; secondly, in places where roads overlap with the names of cities, due to anti-aliasing (and, apparently, due to the forced formation of a palette), the color sometimes coincided with one of the colors for hail, so the method “throw out all colors, Not coinciding with the colors for precipitation "began to give errors. I added a special check: if a pixel of a picture has such a “bad” color of hail, and in a “template” there is a similar color, then we consider this as a pixel of the road and also throw it out.
Around the same days, I discovered that on the Moscow radar, not only does the scroll bar move someone, but sometimes it changes the zoom. (For some reason, this was not observed on other radars.) At first, the Moscow radar was heavily speculated, and then it was a few days later. The hypothetical variant spoiled everything in general, even the detection of the center did not work, since there was no dark gray external background in the picture, but on the stunned version the center was detected more or less, but it is still clear that the binding did not work correctly. I quickly corrected the dumbfounded version: I already detected grid lines to determine the center, it remains to look at the distance between these bands and compare it with the reference one. With the primed version, the problem of detecting the center remained, and I did not do anything with it; but, in principle, not so scary, because all the same, on the primed version, a substantial part of the information is lost without getting into the field of visibility, so there is little use in processing the primed image.
The converter code has already grown pretty big, I had to break it into several files and three classes: for detecting the center and trimming, for removing the background and for translating the projection. Already even thinking about creating testsuite for the converter.
And only I did it, as everything stopped working again. It turned out that at the meteo-radar they once again redid the format of the pictures, and now the substrate map and the actual precipitation image were spread with different files, and only on the html-page directly did one picture be displayed on top of another.
A bunch of code immediately became unnecessary. Detect the center and zoom is no longer necessary: apparently, they began to upload images directly generated by the program, and not screenshots. Removing the background was the simplest - there was no grid or city names anymore, all that was needed was to remove the light gray internal background and remove everything outside the circumference of a fixed radius (there was a dark gray external background and additional signatures). The conversion of the projection has remained; in fact, even a bit complicated, because I wanted to make the code universal for two options: so that it was possible to convert both the rain picture (for real work) and the substrate map (to check the correctness of the binding), but these two pictures were of different sizes - I had to add a simple accounting for the size of the original picture.
It all worked, just too suspicious: not a single cloud on all three radars, not only in the converted pictures, but also on the initial meteorological radar. But at that time there was really sunny weather in Nizhny without a single rain, and I was ready to believe that there really were no rains within these three radars. Especially since on some other radars on the meteo-rain the rains drew normally.
But one friend wrote to me that there are constant rains in Moscow, but they are not on the radar. And on the original images on the meteorates either. We looked at it in more detail and found that part of the radar is clearly not working: the wind speed of 0 m / s is written on them. At the same time, they suddenly found out that on the site of the meteorological inscription appeared an inscription that the cards are provided with a delay of 24 hours.
Hmm. Non-working radar recovered during the day - apparently, they were transferred to a 24-hour delay. But the data is really very similar that they go with a delay of 24 hours, and this is not very interesting; I immediately got rid of the link to the discussion of this delay on vkontakte. I wrote an appeal to Roshydromet, and at the same time I began to think from where I would receive the pictures, if not from the meteorological equipment. In the vkontakte discussion, there was a link to the Kazan radar on the Kazan hydromet website, but this is not so interesting to me - I was primarily interested in the Nizhny Novgorod and Kostroma radars. No similar picture was found on the site of the Nizhny Novgorod hydromet.
Then I remembered the second site, which had long been found - meteoinfo.by . There, of course, the spatial resolution of the images was clearly worse, but at least something. And they also explicitly authorized the use of information on other sites on the site in the "Regulations on the procedure for the use of information", provided that they were referred to. So I just redid the code to work with the Belarusian site. Of course, their pictures are blocked for Russia, but my vps is not in Russia, so everything opens from it. True, it was not so easy to bind, but in the end I decided that their background map was even worse than on the meteoric; for example, the relative position of Nizhny Novgorod relative to the Volga on the maps of the Nizhny Novgorod and Kostroma radars was different.
Everything worked for several days, after which Belarusians began sending my redirect to meteoinfo.by/radar/no_radar.gif specifically to my download script. In the picture there was an inscription “We considered that we should limit access to our radar maps” - and the email of the site administrator. Well, I wrote to them, indicating that I comply with the requirements of the "Regulations on the procedure for the use of information." Got a response:
Well, here, apparently, and all at the moment. From Roshydromet I received an answer completely analogous to the fact that other people posted in the comments to the previous entry, in short: “we are not obliged to publish this data, therefore only for individual consumers and for a fee”. (Although it is worth noting Rosgidromet's unexpected promptness: the answer came two weeks after the appeal, I expected it to be over a month.) I wrote on data.gov.ru, but so far there is no result.
Therefore, I suggest that anyone who is interested in these pictures write both in Roshydromet and on data.gov.ru - all this can be done (if someone suddenly doesn’t know) via the Internet, maybe some kind of result will be obtained.
And yes, the penultimate version of the site, using data from the meteorological report, but with a delay of 24 hours: radarmap.info . Pictures continue to be pumped out, i.e. now there is real data 24 hours ago. In the upper right corner there is a button for playing the story.
PS In the discussion of the previous publication, and even earlier, when I told people about this project, I was confronted with the opinion “why all this is necessary, because there are so many services that provide a cloud and rain map?” My answer to this question is as follows. These services are based on the forecast and therefore have a number of
Somewhere at the end of May, once again figuring out whether a thunderstorm from the clouds outside the window gathered, I thought: even if they put on meteorological radar, which they bypass thunderstorms, are there really no similar stationary radar? And if they are, aren't images available on the Internet?
Not the fastest search on the Internet has shown that such radars exist, they are called DMRL (Doppler meteorological radar), and pictures from them are really exposed on the Internet. There is a Russian site meteorad.ru , Belarusian meteoinfo.by (although it is not available from Russia, not from Russia, see the drop-down menu on the left), and there is also a site orm.mipt.ru. At the same time, the most pleasant pictures are on meteorad.
')
I soon realized that the meteorological radius lacked three things: a good cartographic substrate, history over the past few hours, and combining images from several radars. On some other site I found a map with this functionality, but there wasn’t the Nizhny Novgorod radar I was most interested in. Well, it means that you need to make such a card yourself.
Well, let's get started. GitHab for those who (suddenly?) Want to keep track of the story in more detail than what I am describing here.
A typical picture from the meteorological attack looked like this at the time:
Big pictures under the spoiler, so as not to break the text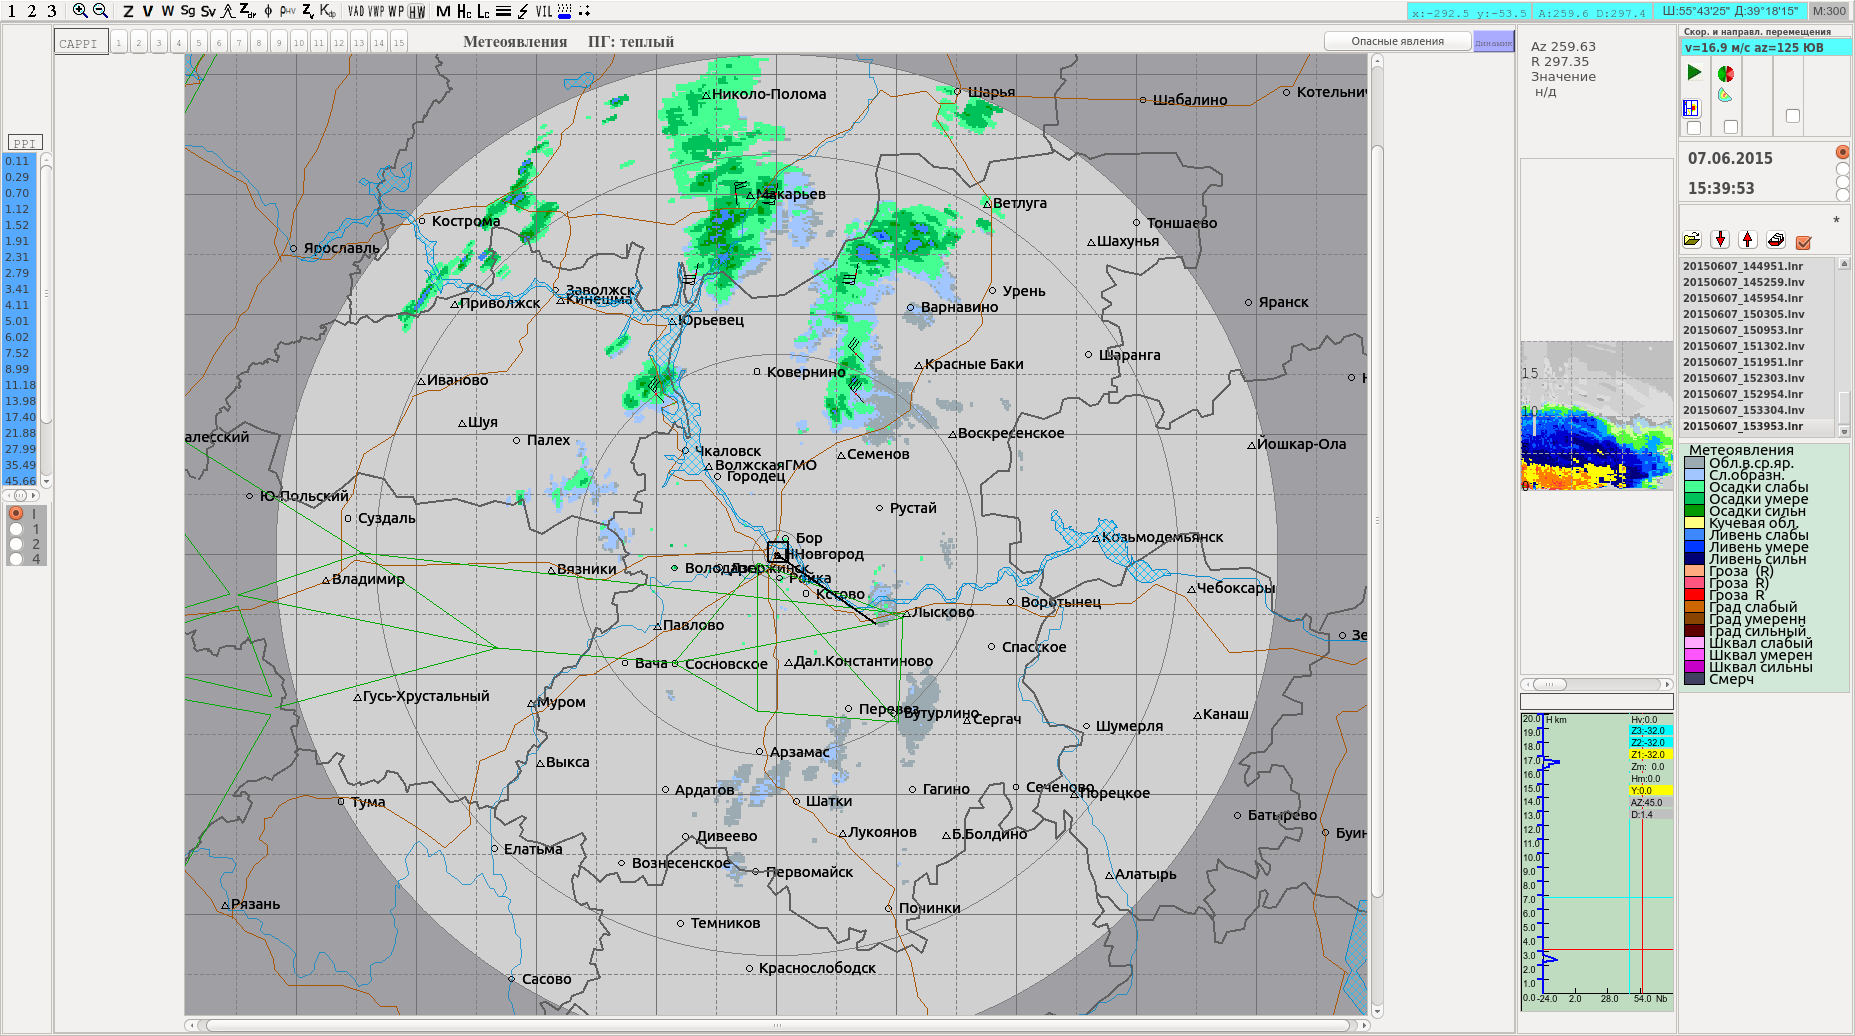
To begin with, let's just take this type of image from the meteoric radius, cut it off and, without deleting the background, try to apply OSM to the map substrate. Fortunately, I most likely know exactly where the Nizhny Novgorod radar is located. I took OpenLayers as a framework, set it up, selected the size of the image so that the cities marked on the radar more or less coincided ... but still the cities, roads and rivers marked on the radar map do not match well with the OSM substrate.
Well, maybe the radar background map is not very good? Here is the Kostroma radar
picture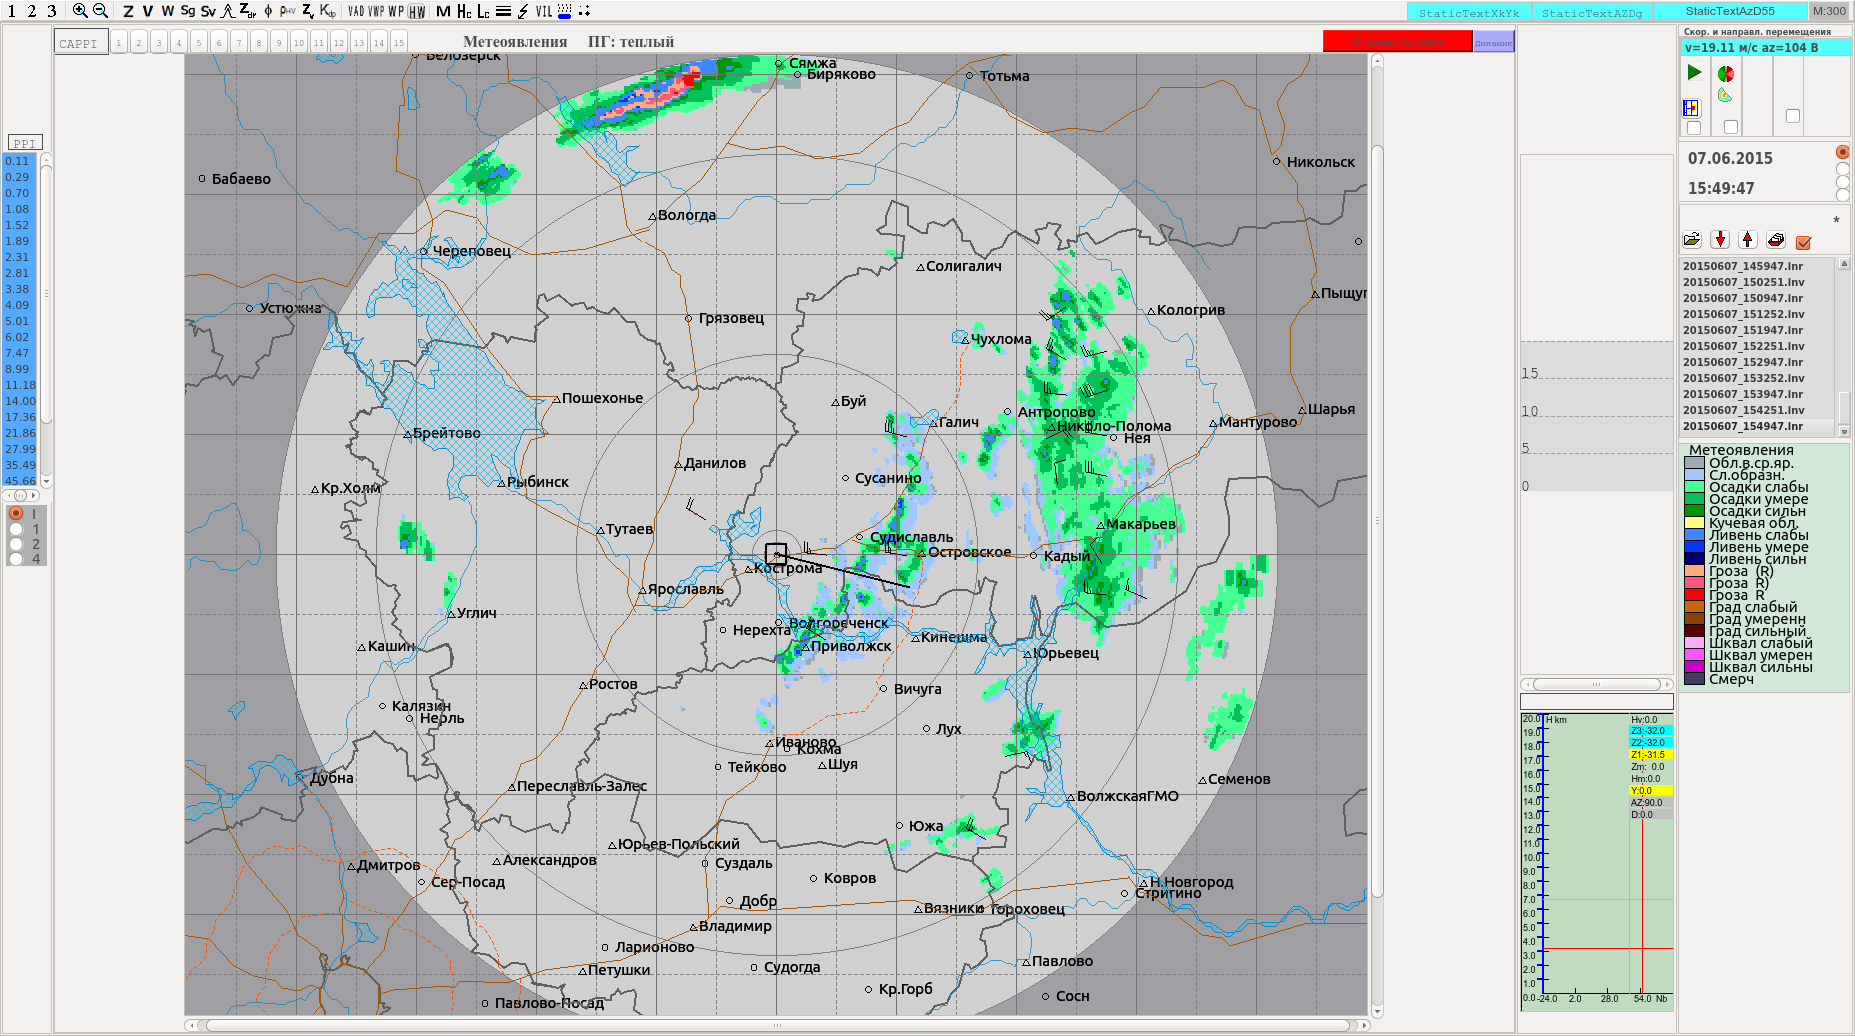
If you look closely at the fine details of the background map, you can see that, most likely, on both radars there is a map from the same source: all the bends of all the lines are the same, etc. Let's try to align two pictures from the radar?
Well, somehow I tried to align the Kostroma and Nizhny Novgorod radars relative to each other. Here is the status of the project at that time :
screenshot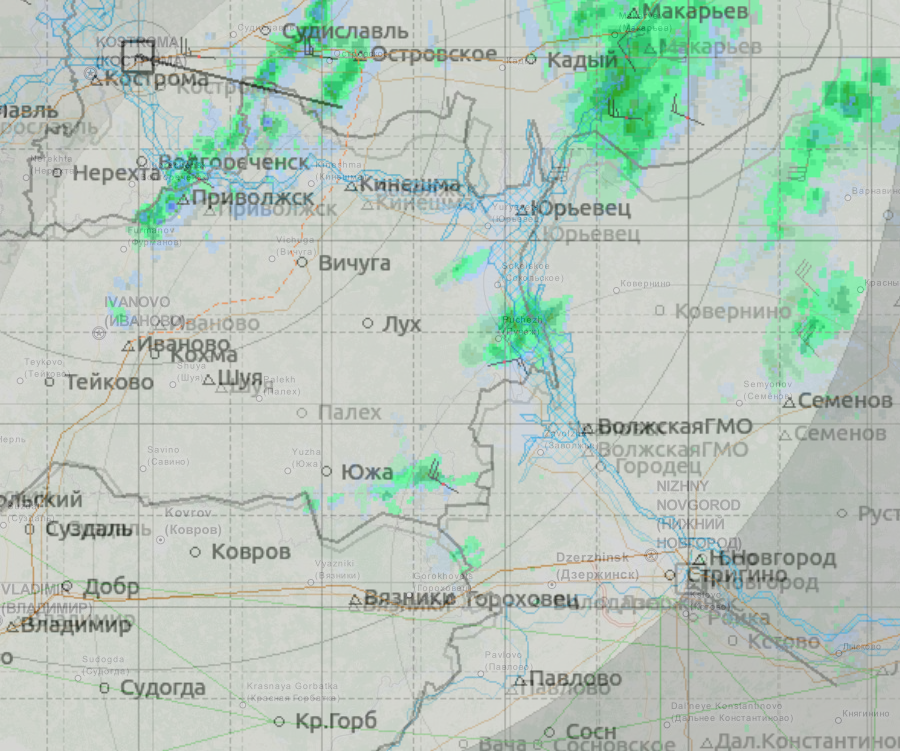
It can be seen that, although the Vladimir – Vyazniki section leveled more or less well (two radars relative to each other, rather than the OSM substrate), the alignment of the remaining sections leaves much to be desired. Of course, it is possible to align and a little better, but all the same - in different places the alignment error vector is clearly different, so perfect alignment will not work. Moreover, it can be seen that the alignment error is substantially larger than the pixel size of the rain, so you really want to align better.
Actually, the cause of the problems is obvious: hardly on meteorad use the same projection of the Web Mercator, as in OSM and OpenLayers, but what kind of projection on meteorad is not very clear. Of course, the first thing that comes to mind is an equidistant azimuthal projection — it is in this projection that the radar “sees” the terrain (the radar knows the direction and distance from which the signal came — if we draw a point corresponding to this signal in polar coordinates, it is at this polar angle and at a proportional distance, this will be an equidistant azimuthal projection.)
I didn’t have exact confidence in this (especially in equilibrium ), but comrade advised a simple test: to compare the sections along the straight line NN — Kostroma cut from Nizhny Novgorod and Kostroma radars. HH — Kostroma lines were almost equal in length, and all the objects lying on this line (intersections with rivers and borders) were also in the same place on both radars; all this clearly spoke in favor of equidistantness. A little later on the meteorad website I found a separate document describing the operation of radars, and there it was also said that the projection of the final images is an equidistant azimuth.
Well, we will assume that we found out. At the same time, the same comrade advised me to use hugin to stitch pictures from different radars. I tried. Yes, it stitches well, but it’s unclear how to lay OSM on the substrate. Therefore, I decided that it would be better to sort out the projections and convert honestly.
Well, you need to be able to translate a picture from one projection to another. A quick search in Google, to some of my surprise, did not provide any ready-made tools for conversion. (Later, in the comments to the post from alexkuku, GDAL was advised to me - although not to say that it’s easy to understand from their website how to convert images between projections.) Ok, it’s not so difficult to translate pictures manually, since the library can translate individual coordinates quite to themselves are. Picked up the scale, determining the coordinates of a number of cities on the Nizhny Novgorod radar (although I could not perfectly reproduce these coordinates using the same scale.) I wrote a simple python conversion script using pyproj, converted it, everything became noticeably better.
True, the question of the location of the radar in Kostroma has now become significantly more important, especially since it is necessary to know this not only for the final placement of the picture on the map, but also for conversion (although in the latter case, the error due to the wrong center is probably less). A quick Google on “DRL Kostroma” reports that the radar is actually called Sokerkino, and this is a small village at the southern end of Kostroma airport. (And yes, of course, the airport itself is also called Sokerkino, and the radar is rather named after the airport, not the village, but I realized this only much later. At OSM there is a village name, but there is no airport name, so I found only one object with this name - the village.) I substituted the coordinates of the village as the coordinates of the radar, did the conversion, slightly corrected the coordinates and at the same time the scale - oh, everything became much better!
Version of the project at that time and
screenshot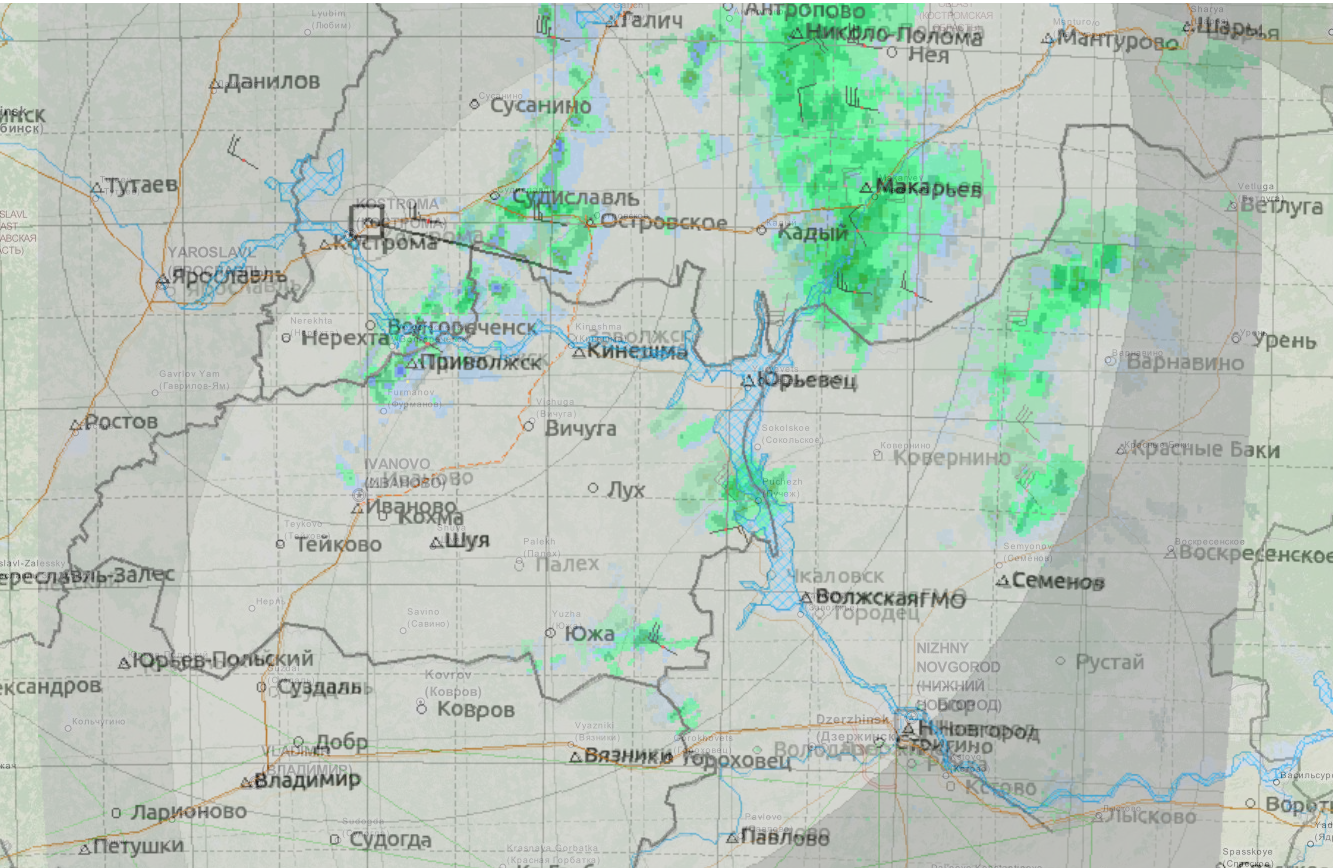
It can be seen that the coincidence of the images from the two radars is very good, the errors are clearly smaller than the size of the pixel of the rain, so the errors can be neglected. The coincidence with the background substrate is also very good, although it leaves much to be desired in places (especially noticeable on Vyazniki, Ivanovo and Semenov).
In fact, the discrepancy is even brighter in Vologda:
Vologda district on a very large scale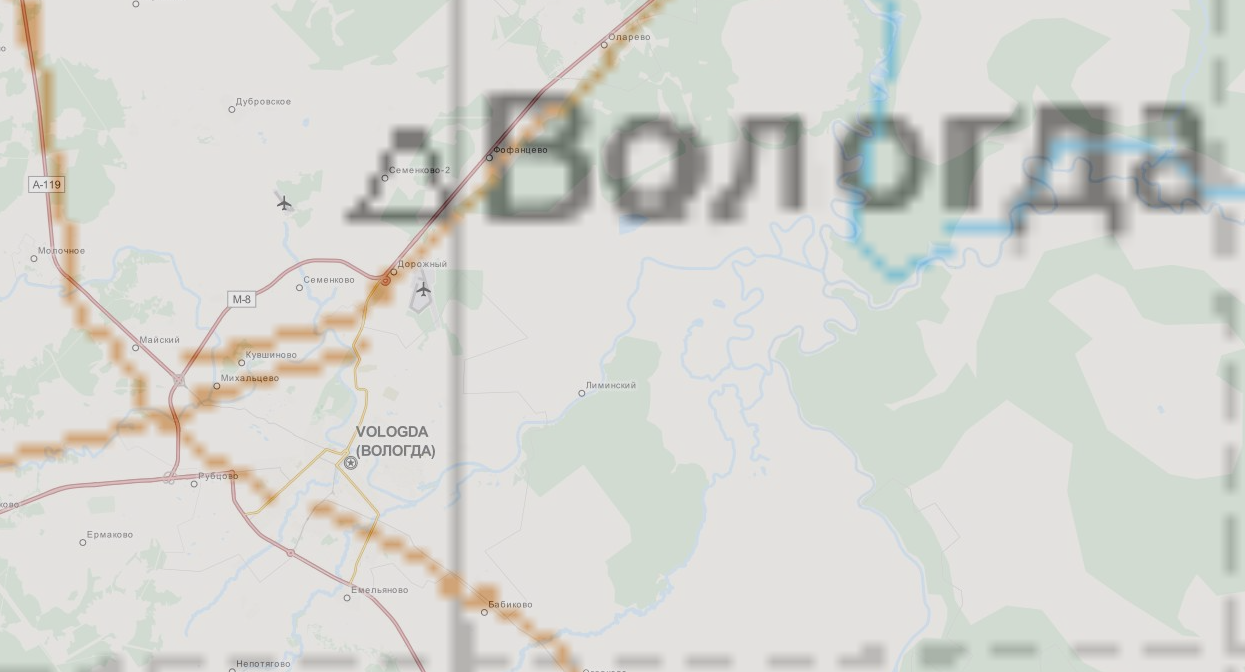
... and the reason is immediately visible: the roads coincide relatively well, only Vologda itself does not coincide. But at the same time, on OSM, Vologda is located south of the M-8 highway, and on the map from the radar - to the north! Clear card error with radar. Therefore, apparently, all the remaining errors will have to be attributed to the errors of the maps from the radar, and to conclude that it is not possible to superimpose the maps from the radars to OSM because of the inaccuracy of the first ones. It is possible that on the map from the radar there are not cities, but, for example, meteorological stations, which may be a little apart. (Actually, maybe because some cities are marked with triangles, and some - by circles?)
Great, let's add the Moscow radar as well to check that everything is aligned well with us. The radar is called “Profsoyuznaya”, and I even seemed to find on the Internet information about exactly which house on ul. The trade union is worth the radar, but still had to slightly move the center to get a reasonable alignment with other radars.
New version and
screenshot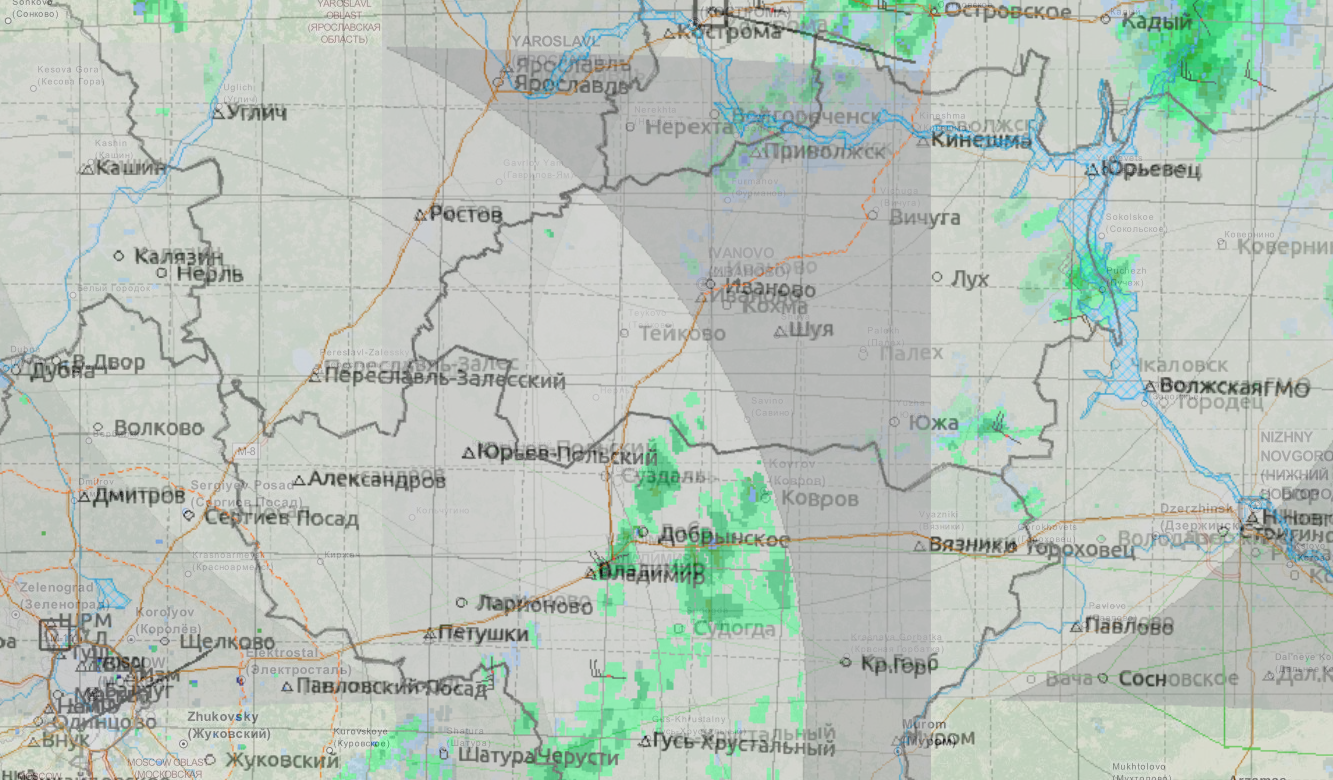
The match is very good, further confirms that we are doing everything correctly.
That's just a converter on python works for a long time. 30 seconds to convert one image is too much. At first I was very surprised, I thought that the main bottleneck is directly recalculating the coordinates, a few cosines-sines-what-else-there to a point, and it’s unlikely the speed of this depends on the programming language. But ok, I rewrote everything in C ++ (with OpenCV for working with pictures), now converting one picture takes a couple of seconds.
... It would seem that little remains: to remove the background from the pictures - and you can use. It seemed so until the moment when I suddenly discovered that my alignment of Moscow had suddenly moved.
How so? Here you saw on the pictures displayed on meteorad (see examples at the beginning of the post), scroll bars. And then one day I discovered that the image from the Moscow radar had shifted vertically. As if the pictures on meteorad are real screenshots from some computer, and someone came up to this computer and moved the scroll bar.
Well, we will detect the center of the picture. Naturally, I did not want to be attached to any features of the background map; I wanted to come up with a method that will easily work for all radars at once. I implemented the following approach: the image has gray grid bars. The vertical center is on one of these horizontal stripes, it remains to determine which one. To do this, we have a dark gray background outside the radar's visibility range. The closer to the present center, the less this dark gray on each particular horizontal. Therefore, from all the strips of the grid, choose the one around which the horizontal (plus or minus 50 pixels in height) is the least dark external background. Hooray, it works. Since there is a horizontal scroll bar on the picture, we will implement the same approach for detecting the vertical on which the center is located.
Go ahead. Now you can write a script that regularly pulls out new images from the meteorological radar. Every minute we will poll the site, download the picture and, if it has changed, then convert it. As experience has shown, new pictures appear around: 07,: 17,: 27, ...,: 57 minutes of each hour - well, plus or minus a minute. (On the pictures themselves, in the right upper corner, the time is indicated, I even thought that it was possible to parse it to determine at what time this or that picture exactly belongs, but my hands never reached this point. So, this time is always a multiple of 10 minutes and 6-7 minutes less than the time of putting pictures.)
Now, so that it can somehow be used, we will remove the background from the pictures. To begin with, I wrote a very simple method: all light gray pixels of the internal background and all dark gray pixels of the external background are changed to transparent ones; at the same time we add the bounds of the radar field of view - to those pixels in the vicinity of which there is both an internal and external background. The grid and the names of the cities remain, but in principle, what turned out can already be used.
All is well, but green clouds are lost on MapQuest's green background. The idea: make a black and white OSM layer. I don’t want to raise my own tile-server (although still the project is already tied to proj and opencv for working with pictures, so it will only work on vps). Looking for some standard black and white layer, I find nothing. Apparently, earlier there was a black-and-white Mapnik, but now it does not work. I find a number of options with OpenMapSurfer or CartoDB, but they do not really suit me.
At the same time I discover that with OpenLayers you can set the layer's value to saturation. I set to zero - nothing changes. By experimenting, I establish that saturation only works if OpenLayers is switched to webgl mode, and this does not work in many browsers, and in many others it slows down. Sorry. In general, I played with different options and so far I returned the color MapQuest.
Somewhere here I buy a simple vps and post the project to the network. While available only through direct ip, I didn’t want to buy a domain right away. At the same time I am writing a letter to the administrators of the site meteorad.ru (according to the only email found on the site) asking if their pictures can be used as follows. I never received an answer, but now my conscience is constantly bothering me: was this letter the cause of all subsequent events, namely, the closure of access to real-time data? I thought whether they should write or not, understanding that if they write, they can be banned, and if they don’t write, they may not notice, but decency still overpowered and I wrote.
I make a more advanced version of removing the background - namely, now I replace all pixels with transparent pixels that are not in the list of symbols for rains. This is a fairly obvious option, but there is one problem: black. Black is used for two things at once: for signatures of cities and for designating winds. The winds are shown both as small black “ticks” in the clouds, and as large black lines protruding from the centers of the radar. Information about the wind really want to save, without it it is not clear where to expect the movement of clouds. (I plan to animate the story, but I still want to leave the wind direction.)
Here is a simple approach so easy to imagine. I decided to do this: I take several images from the same radar, but from different days, and leave those pixels that are the same on all the images (the benefit of the city names are applied on top of the precipitation) - I get what I called the “template”. This will be primarily the names of cities, because the winds will have time to change. Accordingly, now, when I process the next image and stumble upon a black pixel, I can look at the template and, if there is also a black pixel, then I need to remove this black pixel from the image, otherwise it is the wind - it should be left.
I had to tinker a little more to defeat anti-aliasing effects in city signatures (not all pixels are actually black there). I have no final pictures left, but below will be a rough idea of what happened at this stage.
In the meantime, I am still not satisfied with any variants of the OSM substrate, which I find. I decide to make a “proxying” tile-server: at the request of a specific box, it will download the same box from some public server, convert it to black and white, and give it to the user. From a variety of publicly accessible servers, I chose chepetsk.net for the fact that the map is sufficiently detailed even on a small scale. I wrote a simple proxying script, plus it turned out that simply translating to black and white is bad, you need to lower the contrast and lighten it. As a result, I stopped at a simple formula: the color of the new pixel is
(255*2+(r+g+b)/3)/3 (r, g, b) - the color of the old pixel.The current result (artifacts from anti-aliasing city signatures have not been completely cleaned here):
screenshot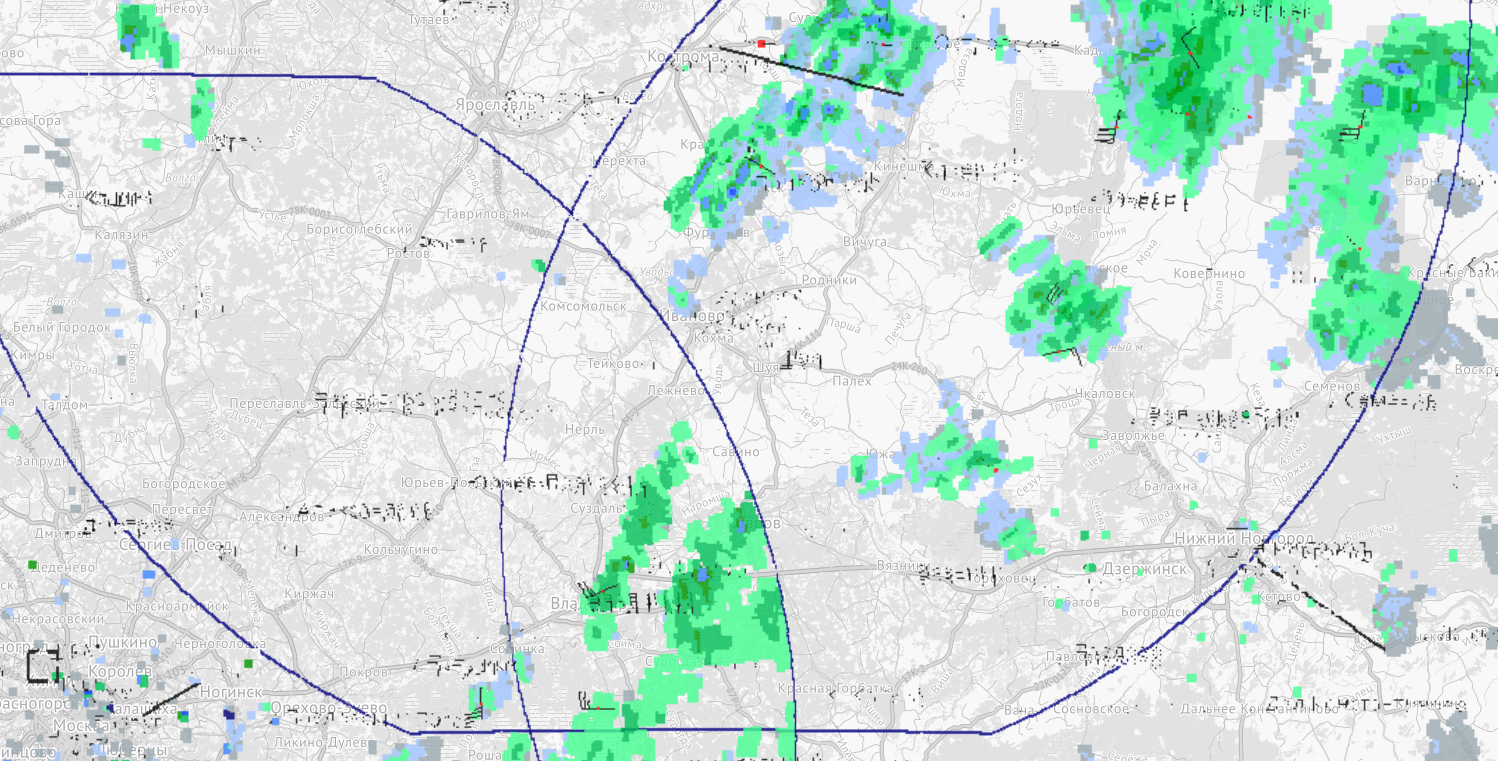
Next is easier. Let's do an auto-update: the download script writes information about new pictures to a json file, the javascript on the client side checks every 10 seconds if new pictures appear in this file. So far, for simplicity, I did not bind to any database. In the same json now there is information about all the pictures ever downloaded, so there is no problem to make the story play. A little fiddling with JS, did. True, the loading of pictures slows down, so I had to make the client cache them first.
(Yes, at this point in json I had information about all the pictures I had ever downloaded, and all those pictures were stored on the disk. I was afraid that the place would quickly end, and json would grow to incredible sizes, but in a couple of months everything was still reasonable. Then, of course, it would be necessary to switch to the database and delete old records and pictures.)
There was one more problem: from time to time the individual pictures on the meteorade ceased to be updated. The update was restored after a few hours, sometimes up to a day, during all this time my download script saw that the picture had not changed, and I thought that everything was in order. As a result, the last available picture was displayed on the map. I thought to do something about it - not to display pictures of age more than an hour or the like. - but so the hands did not reach.
The entertainment continued. On another day, I found that the pictures on my site are not updated, although everything works on the meteo-weather. It turned out that they decided to change the format of the images on the meteorade: from 32-bit PNG to 8-bit palette. And for some reason, the standard imread () from OpenCV refused to open such pictures. Googled a bit how to load palette pictures in OpenCV, didn’t find anything sensible and decided: since I have everything on vps, you can simply find some command line utility in Linux that translates from 8-bit palette png to 32-bit , and run it before running the actual conversion. He did. At the same time, another problem emerged: now, firstly, the colors on the meteorating floated on the pictures and the colors had to be compared not for an exact match, but for a small difference of components; secondly, in places where roads overlap with the names of cities, due to anti-aliasing (and, apparently, due to the forced formation of a palette), the color sometimes coincided with one of the colors for hail, so the method “throw out all colors, Not coinciding with the colors for precipitation "began to give errors. I added a special check: if a pixel of a picture has such a “bad” color of hail, and in a “template” there is a similar color, then we consider this as a pixel of the road and also throw it out.
Around the same days, I discovered that on the Moscow radar, not only does the scroll bar move someone, but sometimes it changes the zoom. (For some reason, this was not observed on other radars.) At first, the Moscow radar was heavily speculated, and then it was a few days later. The hypothetical variant spoiled everything in general, even the detection of the center did not work, since there was no dark gray external background in the picture, but on the stunned version the center was detected more or less, but it is still clear that the binding did not work correctly. I quickly corrected the dumbfounded version: I already detected grid lines to determine the center, it remains to look at the distance between these bands and compare it with the reference one. With the primed version, the problem of detecting the center remained, and I did not do anything with it; but, in principle, not so scary, because all the same, on the primed version, a substantial part of the information is lost without getting into the field of visibility, so there is little use in processing the primed image.
The converter code has already grown pretty big, I had to break it into several files and three classes: for detecting the center and trimming, for removing the background and for translating the projection. Already even thinking about creating testsuite for the converter.
And only I did it, as everything stopped working again. It turned out that at the meteo-radar they once again redid the format of the pictures, and now the substrate map and the actual precipitation image were spread with different files, and only on the html-page directly did one picture be displayed on top of another.
A bunch of code immediately became unnecessary. Detect the center and zoom is no longer necessary: apparently, they began to upload images directly generated by the program, and not screenshots. Removing the background was the simplest - there was no grid or city names anymore, all that was needed was to remove the light gray internal background and remove everything outside the circumference of a fixed radius (there was a dark gray external background and additional signatures). The conversion of the projection has remained; in fact, even a bit complicated, because I wanted to make the code universal for two options: so that it was possible to convert both the rain picture (for real work) and the substrate map (to check the correctness of the binding), but these two pictures were of different sizes - I had to add a simple accounting for the size of the original picture.
It all worked, just too suspicious: not a single cloud on all three radars, not only in the converted pictures, but also on the initial meteorological radar. But at that time there was really sunny weather in Nizhny without a single rain, and I was ready to believe that there really were no rains within these three radars. Especially since on some other radars on the meteo-rain the rains drew normally.
But one friend wrote to me that there are constant rains in Moscow, but they are not on the radar. And on the original images on the meteorates either. We looked at it in more detail and found that part of the radar is clearly not working: the wind speed of 0 m / s is written on them. At the same time, they suddenly found out that on the site of the meteorological inscription appeared an inscription that the cards are provided with a delay of 24 hours.
Hmm. Non-working radar recovered during the day - apparently, they were transferred to a 24-hour delay. But the data is really very similar that they go with a delay of 24 hours, and this is not very interesting; I immediately got rid of the link to the discussion of this delay on vkontakte. I wrote an appeal to Roshydromet, and at the same time I began to think from where I would receive the pictures, if not from the meteorological equipment. In the vkontakte discussion, there was a link to the Kazan radar on the Kazan hydromet website, but this is not so interesting to me - I was primarily interested in the Nizhny Novgorod and Kostroma radars. No similar picture was found on the site of the Nizhny Novgorod hydromet.
Then I remembered the second site, which had long been found - meteoinfo.by . There, of course, the spatial resolution of the images was clearly worse, but at least something. And they also explicitly authorized the use of information on other sites on the site in the "Regulations on the procedure for the use of information", provided that they were referred to. So I just redid the code to work with the Belarusian site. Of course, their pictures are blocked for Russia, but my vps is not in Russia, so everything opens from it. True, it was not so easy to bind, but in the end I decided that their background map was even worse than on the meteoric; for example, the relative position of Nizhny Novgorod relative to the Volga on the maps of the Nizhny Novgorod and Kostroma radars was different.
Everything worked for several days, after which Belarusians began sending my redirect to meteoinfo.by/radar/no_radar.gif specifically to my download script. In the picture there was an inscription “We considered that we should limit access to our radar maps” - and the email of the site administrator. Well, I wrote to them, indicating that I comply with the requirements of the "Regulations on the procedure for the use of information." Got a response:
For information from the Russian radar you need to contact Roshydromet.
Belarusian radars use without restrictions.
Disconnected due to the fact that not to wipe relations with Roshydromet.
Well, here, apparently, and all at the moment. From Roshydromet I received an answer completely analogous to the fact that other people posted in the comments to the previous entry, in short: “we are not obliged to publish this data, therefore only for individual consumers and for a fee”. (Although it is worth noting Rosgidromet's unexpected promptness: the answer came two weeks after the appeal, I expected it to be over a month.) I wrote on data.gov.ru, but so far there is no result.
Therefore, I suggest that anyone who is interested in these pictures write both in Roshydromet and on data.gov.ru - all this can be done (if someone suddenly doesn’t know) via the Internet, maybe some kind of result will be obtained.
And yes, the penultimate version of the site, using data from the meteorological report, but with a delay of 24 hours: radarmap.info . Pictures continue to be pumped out, i.e. now there is real data 24 hours ago. In the upper right corner there is a button for playing the story.
screenshot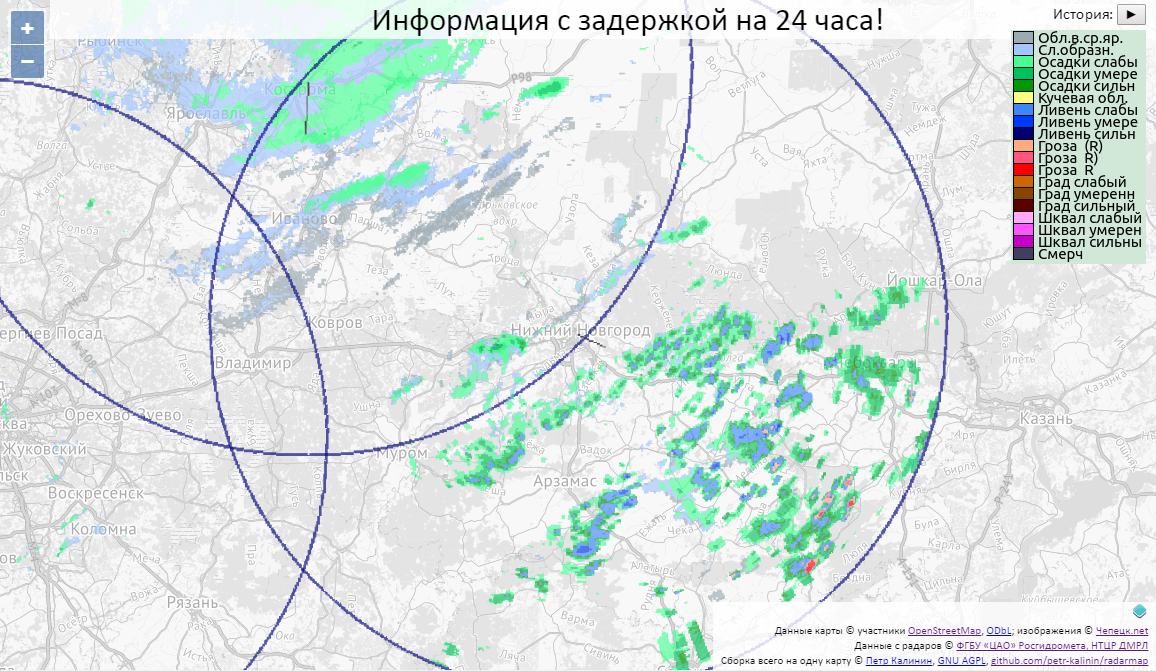
PS In the discussion of the previous publication, and even earlier, when I told people about this project, I was confronted with the opinion “why all this is necessary, because there are so many services that provide a cloud and rain map?” My answer to this question is as follows. These services are based on the forecast and therefore have a number of
fundamental flaws
First of all, these services do not distinguish the rain from a rainstorm, from a thunderstorm, or hail with a squall. Of course, the amount of precipitation allows us to understand the intensity of rain, but not nearly so accurately.
Secondly, these services have a rather low spatial resolution (tens of kilometers), while radars give a resolution of a few kilometers. (My personal understanding of the reason, I can be mistaken - now there is simply no power for forecasting for the entire planet with high resolution.) As a result, images from the radar allow you to see which part of the Lower is covered with rain, and forecasts are not.
Thirdly, although the forecasts give a good time resolution, but the model itself is usually recalculated units once a day, i.e. even if you look at the data for the current time, on average, 3-6 hours old data were used as the initial data for the forecast. Thunderstorms in summer develop on comparable time scales.
Finally, due to the low spatial resolution and high temporal resolution; in my opinion, the benefit from such cards is not much higher than from the standard “hourly” (actually, 3-hour) forecast for gismeteo. Well, yes, in the morning rain, to 12 o'clock dispel. But not in more detail.
Source: https://habr.com/ru/post/266453/
All Articles