LinkedIn's brief history of scaling
Translator's note : We at Latera are engaged in creating billing for telecom operators . We will write about the features of the system and the details of its development in our blog on Habré (for example, to ensure fault tolerance), but you can also learn something interesting from the experience of other companies. Today we bring to your attention an adapted translation of a note by LinkedIn chief engineer Josh Klemm on the process of scaling social network infrastructure.
LinkedIn was launched in 2003 with the goal of creating and maintaining a network of business contacts and expanding job search opportunities. In the first week, 2,700 people registered on the network. After a few years, the number of products, customer base and server load have increased significantly.
')
Today, LinkedIn has more than 350 million users worldwide. We check tens of thousands of web pages every second, every day. Mobile devices now account for more than 50% of our traffic worldwide. Users request data from our backend systems, which, in turn, process several million requests per second. How did we achieve this?
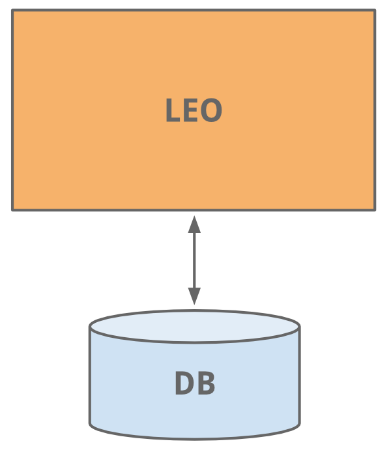
We began to create a LinkedIn site in the same way as many other sites are being created today - in the form of a monolithic application that handles all tasks. This application is called Leo. It hosted web servlets that served all the web pages, took into account business logic, and connected to several LinkedIn databases.
Good old-fashioned website development is so easy and simple.
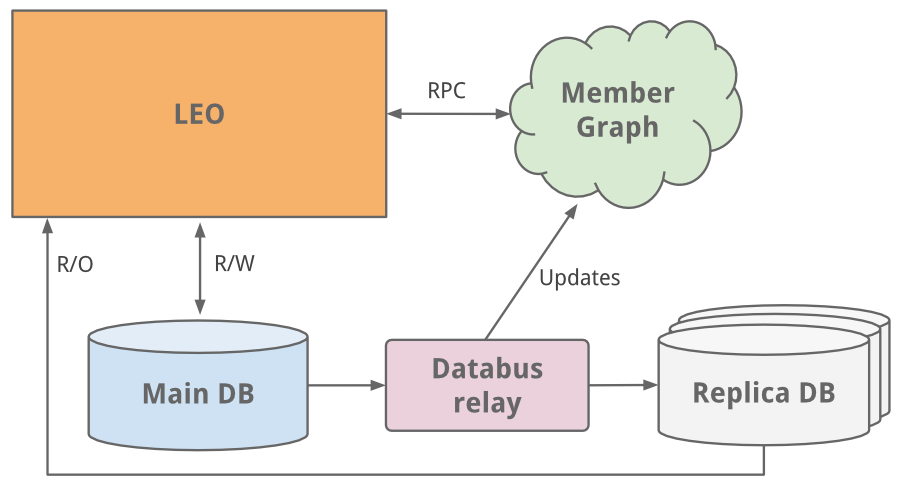
In a social network, first of all, it is necessary to establish communication between its users. To improve efficiency and productivity, we needed to create a system that would request data about the connections in the existing graph, while it itself was stored in the network memory. With this new approach to the use of profiles, the system needed to be scaled independently of Leo. So we had a separate system for our user graph, which we called Cloud: it became the first LinkedIn service. We connected this separate service and the Leo application using RPC (Remote Procedure Call) technology implemented in Java.
Around the same time, we thought about the need to create a search engine. Our graph-based user service has begun to transmit information to a new search service based on Lucene .
As the site grew, Leo also grew: along with its significance and influence, the complexity of the application also increased. To reduce the complexity led to the load distribution, as in the work there were several instances of Leo. Nevertheless, the increased load influenced the work of the most important LinkedIn system - its user profile database.
The simplest solution was the usual vertical scaling: we added more processors and memory to the system. So we won a little time, but it was necessary to carry out further scaling. The profiles database was responsible for both reading and writing data, so several child copies (Slave) of the database were created, which were synchronized with the main database (Master) using the very first version of Databus (now open source) . These copies were designed to read all the data, and we built logic to determine when it is safer and more expedient to read data from a replica than from the main database.
* Due to the fact that the Master-Slave model was a medium-term solution, we decided to partition the databases
Our site attracted more and more traffic, in connection with which our monolithic Leo application began to hang frequently. Finding and eliminating the cause, as well as debugging the application with the new code was not so easy. High resiliency is very important for LinkedIn. Therefore, it was clear that we need to “kill Leo” and break it into many small services that have a number of functions and at the same time do not store information about the previous state.
“Kill Leo” was the motto of our company for several years ...
In the course of development, microservices began to be allocated for the communication of API-interfaces and business logic - an example is our platform for searching, communicating and creating profiles and groups. Later, presentation areas were identified for areas such as recruitment and general profile. Outside the Leo application, completely new services were created for new products. Over time, in each functional area of its own vertical stack.
We installed front-end servers so that we could extract data from different domains, take into account the presentation logic and create HTML pages using JSP technology (JavaSever Pages). In addition, we have developed services at the intermediate level, in order to use them to provide access to data through the API, and backend services for storing user data in order to provide reliable access to the database / databases. By 2010, we already had more than 150 separate services. Today their number exceeds 750.
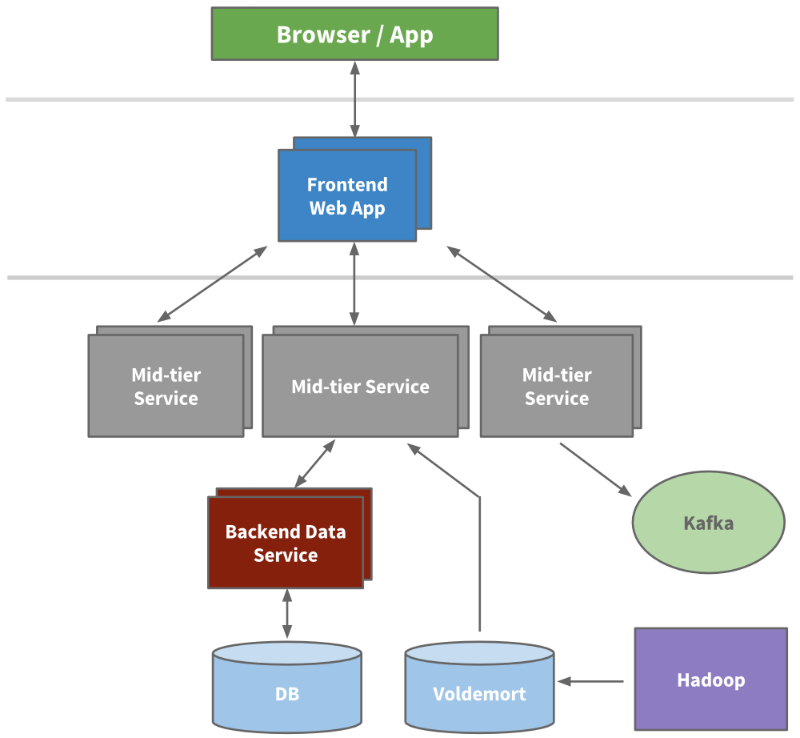
LinkedIn example service oriented architecture
Since the states are not saved, scaling can be done by running new instances of any of the services and using a load balancer. We began to actively monitor the load that each of the services can withstand, having previously allocated all the necessary resources and prepared means of monitoring performance.
The company experienced rapid growth and planned to expand further. We knew that we could reduce the overall load by increasing the number of cache levels. In many applications, intermediate cache levels have been introduced, such as in the cases of Memcached and Couchbase . We also increased the cache of our databases and began to use the Voldemort repository with pre-calculated results when necessary.
Over time, we have deleted many intermediate cache levels. They stored data retrieved from different domains. At first glance, caching seems to be an obvious way to reduce the load, but the complexity of the invalidation and the structure of the call graph is prohibitively high. The closest location of the cache to the data stores reduces waiting time, allows horizontal scaling and reduces cognitive load.
To bring growing data volumes together, LinkedIn has developed several types of pipelines for transferring data flow and organizing them in a queue. For example, we needed to transfer data to the repository, send data packets between Hadoop workflows for analysis, collect logs of each service and various statistical indicators, such as the number of page views, create a queue system in its inMail messaging system, and issue relevant information about users immediately after updating their profiles.
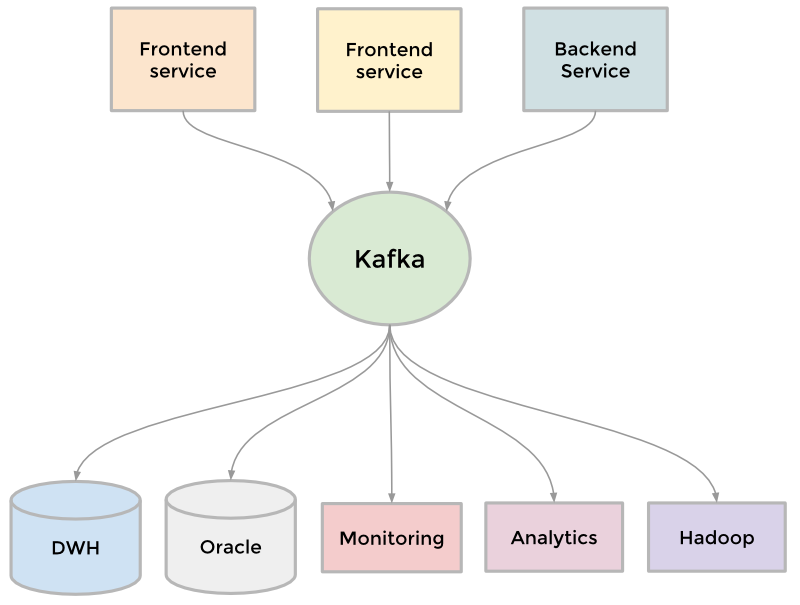
As the site expanded, more and more pipelines appeared. The site needed scaling, therefore, each individual pipeline also needed scaling. Something needed to be sacrificed. As a result, we developed a distributed messaging system called Kafka . It has become a universal conveyor based on the principle of storing the operations performed and taking into account the possibility of increasing speed and scalability. Kafka provided almost instant access to any data warehouse, helped in working with vacancies with Hadoop, allowed us to carry out real-time analysis, significantly improved monitoring of our site and the alert system , and also made it possible to visually display call graphs and monitor their changes . Today, Kafka processes more than 500 billion requests per day.
Kafka as a universal data transmission tool
Scaling can be viewed from different points of view, including the organizational one. In late 2011, LinkedIn launched an internal project called InVersion . Thanks to him, we have suspended the development of individual functions: it allowed the entire company to focus on equipment, infrastructure, implementation and productivity of developers. As a result, we have achieved a certain level of flexibility needed to develop new scalable products that we have today.
After we switched from Leo to a service-oriented architecture, the APIs of our teams, which were accessed via RPC in Java, turned out to be incompatible and closely related to the presentation layer. Over time, the situation only worsened. To solve the problem, we created a new API model and called it Rest.li. Rest.li was a step towards the data model-oriented architecture. It was built on a single, stateless RESTful API model: the whole company could now use this model.
As a result, our new APIs on JSON, which was used instead of HTTP, made it easier to work with non-Java client applications. Today, most LinkedIn developers program in Java, but the company has a ton of clients in Python, Ruby, Node.js, and C ++, developed by both full-time employees and programmers from companies absorbed by LinkedIn.
The refusal of RPC made us less dependent on presentation levels and saved us from compatibility issues with previous versions. Plus, using Dynamic Device Discovery (D2) together with Rest.li allowed us to automate load balancing, device discovery and scaling of the client API of each service.
Currently LinkedIn has more than 975 resources based on the Rest.li model, and our data centers handle more than 100 billion Rest.li requests per day.
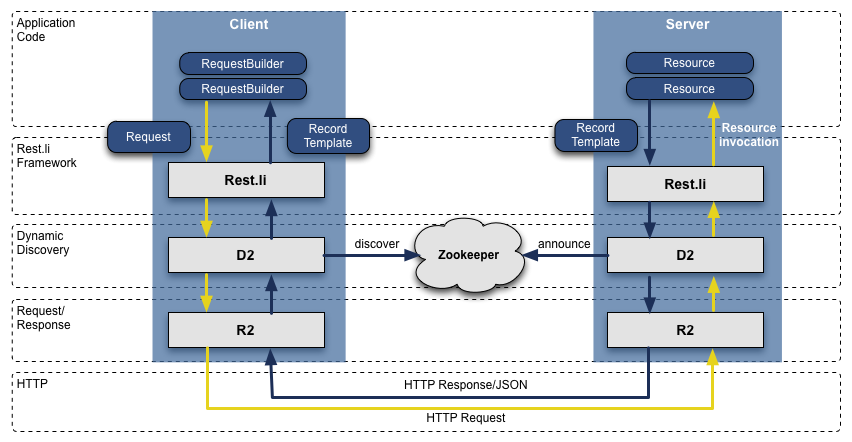
Stack Rest.li R2 / D2
Service-oriented architectures are ideal for separating domains and scaling services independently. But there is a negative aspect. Many of our applications process data of various types, thus making several hundred calls to the client side. All of these appeals are usually reduced to the concepts of "call graph" and "branching." For example, each access to a profile page causes not only profile data: these are photographs, contacts, groups, information about subscriptions, blog posts and the connectivity levels of our graph, recommendations and much more. This graph was quite difficult to manage, and its complexity gradually increased.
We used the superblock principle, which is to form a group of backend services with a single access to the API. Due to this principle, the team of our specialists is engaged in block optimization, at the same time following the call graph of each client.
Being an international company with a growing customer base, we need to scale up, involving more than one data center in processing traffic. We began to solve this problem several years ago: at first, two data centers began to deal with general customer profiles - in Los Angeles and Chicago.
After testing them, we decided to work on improving our services in order to establish data replication, feedback from various sources, events of one-way data replication and connection of the user to a data center closer to him / her.
Most of our databases are stored in Espresso - a modern multi-user data warehouse of our company. It was built to meet the requirements of multi-user data centers. Espresso provides Master-Master support and is responsible for more complex replication technologies.
Having multiple data centers is extremely important for maintaining site operation and high resiliency. We have to avoid the presence of even the slightest problems not only in each individual service, but also throughout the site. Today, LinkedIn has three main data centers and several additional points of presence around the world.
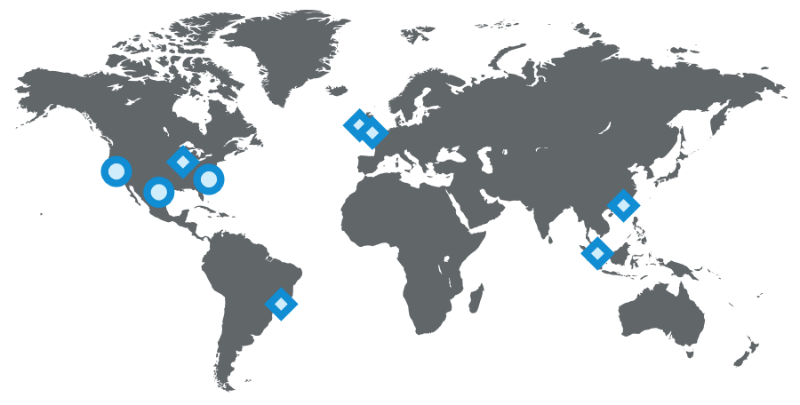
The location of various types of equipment LinkedIn as of 2015 (circles denote data centers, diamonds - points of presence)
As you understand, in practice, scaling is much more difficult. During these few years, our development and engineering teams have done a titanic work, from which it is worthwhile to single out several separate projects.
Many especially important systems of our company have their rich history of development in the process of scaling. Separately, it is worth to highlight the graph of users (our first service outside the Leo application), search (our second service), news feed, communication platform and server application for displaying user profiles.
We have developed an information infrastructure for long-term growth. We first felt this after the creation of Databus and Kafka. Then came Samza for streaming, Espresso and Voldemort as storage tools, Pinot for analyzing our systems and other user solutions. Among other things, our equipment has become much better, so that developers can now independently use this infrastructure.
We have developed an offline business process management system using Hadoop and Voldemort data warehouses in advance to provide information such as People You May Know, Similar Profiles, Successful Graduates, and Profile Location.
We revised our approach to the frontend by adding client-side templates (“ Profile Page ”, “ University Pages ”). They add interactivity to applications by requesting from the server only those objects that are partially or fully written in JSON. In addition, the templates are in the cache network CDN (content delivery network) and the browser. We also started using BigPipe and the Play framework, changing our model from a streaming web server to non-blocking and asynchronous .
Over the application code, we introduced several levels of proxy servers using Apache Traffic Server and HAProxy for load balancing, data center connections, security, smart routing, server-side rendering, and much more.
And on top of that, we continue to increase the performance of our servers, optimizing hardware, setting up an improved memory system, and using the latest Java runtime environment.
LinkedIn was launched in 2003 with the goal of creating and maintaining a network of business contacts and expanding job search opportunities. In the first week, 2,700 people registered on the network. After a few years, the number of products, customer base and server load have increased significantly.
')
Today, LinkedIn has more than 350 million users worldwide. We check tens of thousands of web pages every second, every day. Mobile devices now account for more than 50% of our traffic worldwide. Users request data from our backend systems, which, in turn, process several million requests per second. How did we achieve this?
Early years: Leo
We began to create a LinkedIn site in the same way as many other sites are being created today - in the form of a monolithic application that handles all tasks. This application is called Leo. It hosted web servlets that served all the web pages, took into account business logic, and connected to several LinkedIn databases.
Good old-fashioned website development is so easy and simple.
User graph
In a social network, first of all, it is necessary to establish communication between its users. To improve efficiency and productivity, we needed to create a system that would request data about the connections in the existing graph, while it itself was stored in the network memory. With this new approach to the use of profiles, the system needed to be scaled independently of Leo. So we had a separate system for our user graph, which we called Cloud: it became the first LinkedIn service. We connected this separate service and the Leo application using RPC (Remote Procedure Call) technology implemented in Java.
Around the same time, we thought about the need to create a search engine. Our graph-based user service has begun to transmit information to a new search service based on Lucene .
Database copies
As the site grew, Leo also grew: along with its significance and influence, the complexity of the application also increased. To reduce the complexity led to the load distribution, as in the work there were several instances of Leo. Nevertheless, the increased load influenced the work of the most important LinkedIn system - its user profile database.
The simplest solution was the usual vertical scaling: we added more processors and memory to the system. So we won a little time, but it was necessary to carry out further scaling. The profiles database was responsible for both reading and writing data, so several child copies (Slave) of the database were created, which were synchronized with the main database (Master) using the very first version of Databus (now open source) . These copies were designed to read all the data, and we built logic to determine when it is safer and more expedient to read data from a replica than from the main database.
* Due to the fact that the Master-Slave model was a medium-term solution, we decided to partition the databases
Our site attracted more and more traffic, in connection with which our monolithic Leo application began to hang frequently. Finding and eliminating the cause, as well as debugging the application with the new code was not so easy. High resiliency is very important for LinkedIn. Therefore, it was clear that we need to “kill Leo” and break it into many small services that have a number of functions and at the same time do not store information about the previous state.
“Kill Leo” was the motto of our company for several years ...
Service Oriented Architecture
In the course of development, microservices began to be allocated for the communication of API-interfaces and business logic - an example is our platform for searching, communicating and creating profiles and groups. Later, presentation areas were identified for areas such as recruitment and general profile. Outside the Leo application, completely new services were created for new products. Over time, in each functional area of its own vertical stack.
We installed front-end servers so that we could extract data from different domains, take into account the presentation logic and create HTML pages using JSP technology (JavaSever Pages). In addition, we have developed services at the intermediate level, in order to use them to provide access to data through the API, and backend services for storing user data in order to provide reliable access to the database / databases. By 2010, we already had more than 150 separate services. Today their number exceeds 750.
LinkedIn example service oriented architecture
Since the states are not saved, scaling can be done by running new instances of any of the services and using a load balancer. We began to actively monitor the load that each of the services can withstand, having previously allocated all the necessary resources and prepared means of monitoring performance.
Caching
The company experienced rapid growth and planned to expand further. We knew that we could reduce the overall load by increasing the number of cache levels. In many applications, intermediate cache levels have been introduced, such as in the cases of Memcached and Couchbase . We also increased the cache of our databases and began to use the Voldemort repository with pre-calculated results when necessary.
Over time, we have deleted many intermediate cache levels. They stored data retrieved from different domains. At first glance, caching seems to be an obvious way to reduce the load, but the complexity of the invalidation and the structure of the call graph is prohibitively high. The closest location of the cache to the data stores reduces waiting time, allows horizontal scaling and reduces cognitive load.
Kafka
To bring growing data volumes together, LinkedIn has developed several types of pipelines for transferring data flow and organizing them in a queue. For example, we needed to transfer data to the repository, send data packets between Hadoop workflows for analysis, collect logs of each service and various statistical indicators, such as the number of page views, create a queue system in its inMail messaging system, and issue relevant information about users immediately after updating their profiles.
As the site expanded, more and more pipelines appeared. The site needed scaling, therefore, each individual pipeline also needed scaling. Something needed to be sacrificed. As a result, we developed a distributed messaging system called Kafka . It has become a universal conveyor based on the principle of storing the operations performed and taking into account the possibility of increasing speed and scalability. Kafka provided almost instant access to any data warehouse, helped in working with vacancies with Hadoop, allowed us to carry out real-time analysis, significantly improved monitoring of our site and the alert system , and also made it possible to visually display call graphs and monitor their changes . Today, Kafka processes more than 500 billion requests per day.
Kafka as a universal data transmission tool
Inversion
Scaling can be viewed from different points of view, including the organizational one. In late 2011, LinkedIn launched an internal project called InVersion . Thanks to him, we have suspended the development of individual functions: it allowed the entire company to focus on equipment, infrastructure, implementation and productivity of developers. As a result, we have achieved a certain level of flexibility needed to develop new scalable products that we have today.
Our days: Rest.li
After we switched from Leo to a service-oriented architecture, the APIs of our teams, which were accessed via RPC in Java, turned out to be incompatible and closely related to the presentation layer. Over time, the situation only worsened. To solve the problem, we created a new API model and called it Rest.li. Rest.li was a step towards the data model-oriented architecture. It was built on a single, stateless RESTful API model: the whole company could now use this model.
As a result, our new APIs on JSON, which was used instead of HTTP, made it easier to work with non-Java client applications. Today, most LinkedIn developers program in Java, but the company has a ton of clients in Python, Ruby, Node.js, and C ++, developed by both full-time employees and programmers from companies absorbed by LinkedIn.
The refusal of RPC made us less dependent on presentation levels and saved us from compatibility issues with previous versions. Plus, using Dynamic Device Discovery (D2) together with Rest.li allowed us to automate load balancing, device discovery and scaling of the client API of each service.
Currently LinkedIn has more than 975 resources based on the Rest.li model, and our data centers handle more than 100 billion Rest.li requests per day.
Stack Rest.li R2 / D2
Superblocks
Service-oriented architectures are ideal for separating domains and scaling services independently. But there is a negative aspect. Many of our applications process data of various types, thus making several hundred calls to the client side. All of these appeals are usually reduced to the concepts of "call graph" and "branching." For example, each access to a profile page causes not only profile data: these are photographs, contacts, groups, information about subscriptions, blog posts and the connectivity levels of our graph, recommendations and much more. This graph was quite difficult to manage, and its complexity gradually increased.
We used the superblock principle, which is to form a group of backend services with a single access to the API. Due to this principle, the team of our specialists is engaged in block optimization, at the same time following the call graph of each client.
Multi-user data centers
Being an international company with a growing customer base, we need to scale up, involving more than one data center in processing traffic. We began to solve this problem several years ago: at first, two data centers began to deal with general customer profiles - in Los Angeles and Chicago.
After testing them, we decided to work on improving our services in order to establish data replication, feedback from various sources, events of one-way data replication and connection of the user to a data center closer to him / her.
Most of our databases are stored in Espresso - a modern multi-user data warehouse of our company. It was built to meet the requirements of multi-user data centers. Espresso provides Master-Master support and is responsible for more complex replication technologies.
Having multiple data centers is extremely important for maintaining site operation and high resiliency. We have to avoid the presence of even the slightest problems not only in each individual service, but also throughout the site. Today, LinkedIn has three main data centers and several additional points of presence around the world.
The location of various types of equipment LinkedIn as of 2015 (circles denote data centers, diamonds - points of presence)
What else have we achieved?
As you understand, in practice, scaling is much more difficult. During these few years, our development and engineering teams have done a titanic work, from which it is worthwhile to single out several separate projects.
Many especially important systems of our company have their rich history of development in the process of scaling. Separately, it is worth to highlight the graph of users (our first service outside the Leo application), search (our second service), news feed, communication platform and server application for displaying user profiles.
We have developed an information infrastructure for long-term growth. We first felt this after the creation of Databus and Kafka. Then came Samza for streaming, Espresso and Voldemort as storage tools, Pinot for analyzing our systems and other user solutions. Among other things, our equipment has become much better, so that developers can now independently use this infrastructure.
We have developed an offline business process management system using Hadoop and Voldemort data warehouses in advance to provide information such as People You May Know, Similar Profiles, Successful Graduates, and Profile Location.
We revised our approach to the frontend by adding client-side templates (“ Profile Page ”, “ University Pages ”). They add interactivity to applications by requesting from the server only those objects that are partially or fully written in JSON. In addition, the templates are in the cache network CDN (content delivery network) and the browser. We also started using BigPipe and the Play framework, changing our model from a streaming web server to non-blocking and asynchronous .
Over the application code, we introduced several levels of proxy servers using Apache Traffic Server and HAProxy for load balancing, data center connections, security, smart routing, server-side rendering, and much more.
And on top of that, we continue to increase the performance of our servers, optimizing hardware, setting up an improved memory system, and using the latest Java runtime environment.
Source: https://habr.com/ru/post/266447/
All Articles