Installing Zabbix 2.4 on RedHat Openshift
Recently, I needed my own “cloud” monitoring server with a budget of 0 rubles. As a solution, zabbix was chosen on the openshift platform. This option is suitable for backup basic monitoring or monitoring a small portal with the help of web-scenarios and custom scripts via UserParameter.
I decided to share this experiment with the community, including with the aim of receiving constructive criticism.
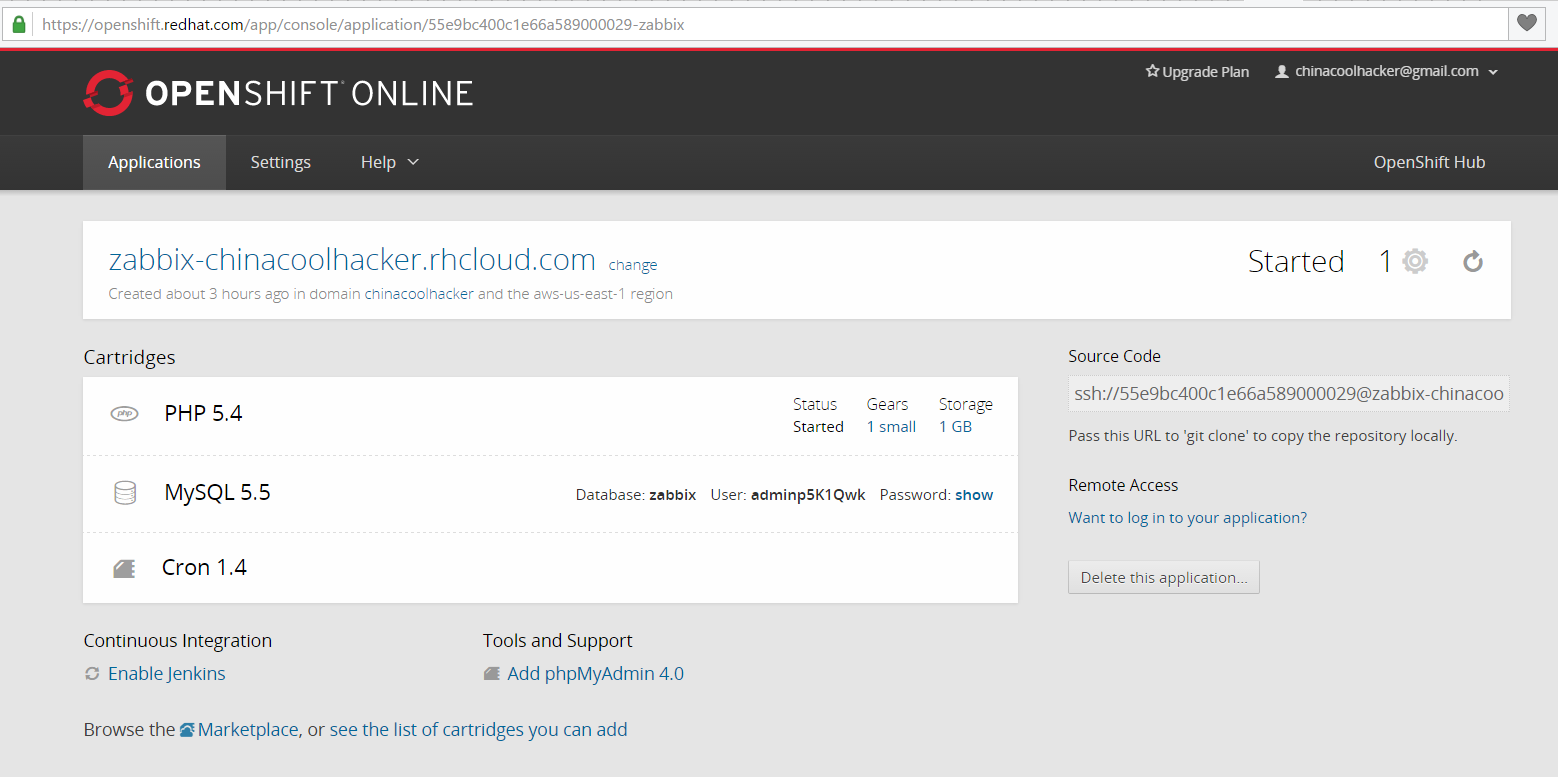
First of all, of course, you need to register for openshift . For zabbix to work, you need an application with a set of mysql and crontab cartridges. It looks something like this:
')
You can also take a line to connect to the openshift server by clicking on “Want to log in your application?”. You need to place your public ssh key in the openshift public key storage.
Download the latest version of zabbix from the official site . On the openshift server, we create a directory for assembling zabbix executable files, upload the sources, unpack and compile:
We configure the server and the agent for work in the openshift environment. Here it will be necessary in the configuration file to replace $ OPENSHIFT_APP_UUID and $ OPENSHIFT_PHP_IP with the corresponding application:
Run to check:
Look in the logs:
The executable code works, you can go to the front end.
Then I decided to use the openshift built-in functionality - deploy via git. I cloned myself on the local site “blank” site:
There are 2 options for setting the front end of zabbix-by editing the config and through a convenient gui. Both options are working, but at restart we risk losing changes made in addition to the gita - so I’m doing through the config, it’s not difficult. Copied the contents of the front-end from the archive zabbix. I delete setup.php so that the attackers could not make changes to my installation and edit the config to suit my needs:
Create .htaccess in the root of the site:
All in git!
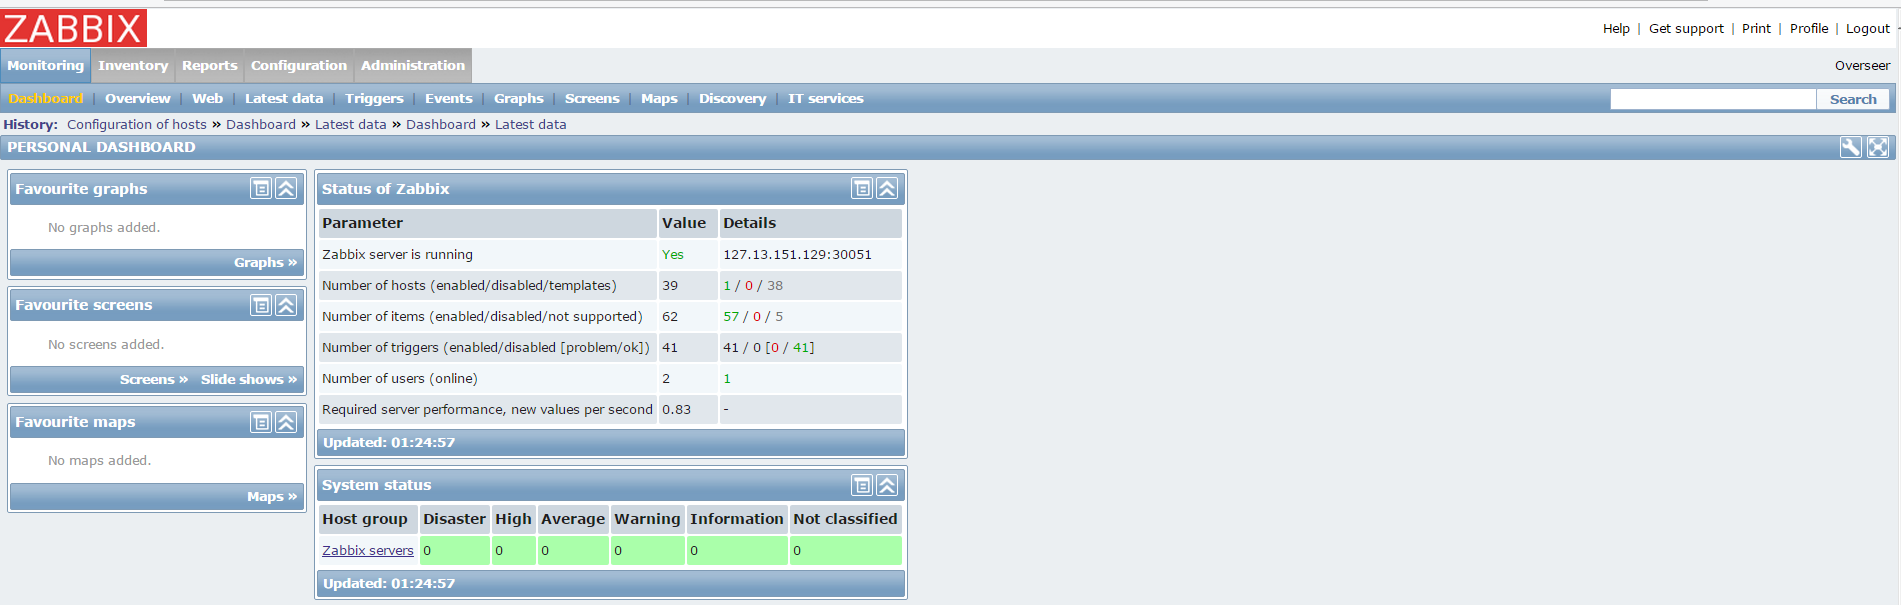
After a successful push, you can enter the web interface (login \ password is admin \ zabbix, do not forget to change it!) And set up monitoring:
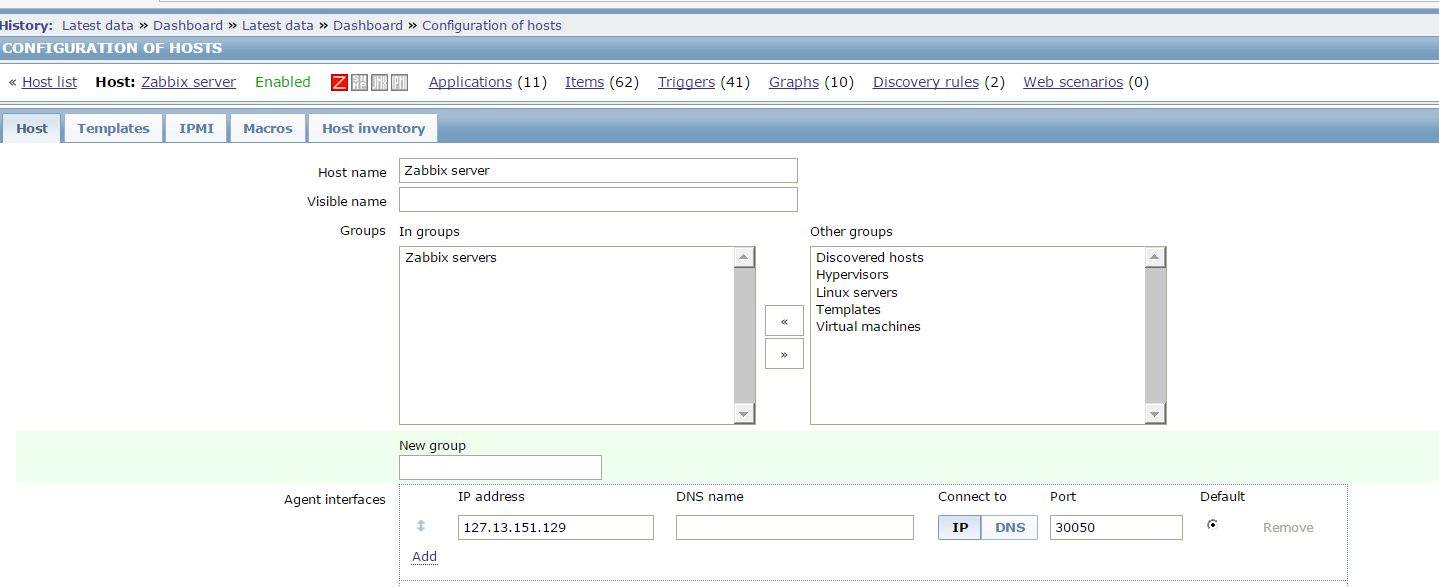
In order for the agent to work and metrics to start gathering, you need to change the ip and port settings:
Now you need to add several tasks to cron - to restart the server and agent applications if they fail. Crontab is located at /var/lib/openshift/55e9bc400c1e66a589000029/app-root/runtime/repo/.openshift/cron. Create files:
Now, if there are no zabbix processes in the system, they will automatically start at the crown.
PS
This installation is well suited for web-scenarios and custom checks based on UserParamater, launched from an agent directly installed on the OpenShift server.
As Disen correctly noted, for security reasons, it is not recommended to put the zabbix-agent ports of your servers on the Internet!
I decided to share this experiment with the community, including with the aim of receiving constructive criticism.
First of all, of course, you need to register for openshift . For zabbix to work, you need an application with a set of mysql and crontab cartridges. It looks something like this:
')
You can also take a line to connect to the openshift server by clicking on “Want to log in your application?”. You need to place your public ssh key in the openshift public key storage.
Download the latest version of zabbix from the official site . On the openshift server, we create a directory for assembling zabbix executable files, upload the sources, unpack and compile:
]\>mkdir -p /tmp/BUILD ; cd /tmp/BUILD ; wget http://downloads.sourceforge.net/project/zabbix/ZABBIX%20Latest%20Stable/2.4.6/zabbix-2.4.6.tar.gz ; tar xf zabbix-2.4.6.tar.gz ; cd zabbix-2.4.6 ; > mkdir /var/lib/openshift/$OPENSHIFT_APP_UUID/app-root/data/zabbix ]\>./configure --enable-server --enable-java --with-mysql --with-libcurl --enable-agent --with-ssh2 --prefix=/var/lib/openshift/$OPENSHIFT_APP_UUID/app-root/data/zabbix ]\> make ]\> make install We configure the server and the agent for work in the openshift environment. Here it will be necessary in the configuration file to replace $ OPENSHIFT_APP_UUID and $ OPENSHIFT_PHP_IP with the corresponding application:
]\> export | grep OPENSHIFT_PHP_IP declare -x OPENSHIFT_PHP_IP="127.13.151.129" ]\> export | grep OPENSHIFT_APP_UUID declare -x OPENSHIFT_APP_UUID="55e9bc400c1e66a589000029" ]\>vi /var/lib/openshift/$OPENSHIFT_APP_UUID/app-root/data/zabbix/etc/zabbix_server.conf ListenIP=$OPENSHIFT_PHP_IP ListenPort=30051 LogFile=/tmp/zabbix_server.log LogFileSize=5 DebugLevel=3 PidFile=/tmp/zabbix_server.pid DBHost=localhost DBName=zabbix #DBSchema=zabbix DBUser=zabbix DBPassword=<> DBSocket=/var/lib/openshift/$OPENSHIFT_APP_UUID/mysql/socket/mysql.sock ]\>vi /var/lib/openshift/$OPENSHIFT_APP_UUID/app-root/data/zabbix/etc/zabbix_agentd.conf PidFile=/tmp/zabbix_agentd.pid LogFile=/tmp/zabbix_agentd.log LogFileSize=5 DebugLevel=3 Server=127.13.151.129 ServerActive=127.13.151.129:30051 ListenPort=30050 ListenIP=127.13.151.129 StartAgents=3 Hostname=Zabbix server Run to check:
/var/lib/openshift/$OPENSHIFT_APP_UUID/app-root/data/zabbix/sbin/zabbix_server -c /var/lib/openshift/$OPENSHIFT_APP_UUID/app-root/data/zabbix/etc/zabbix_server.conf /var/lib/openshift/$OPENSHIFT_APP_UUID/app-root/data/zabbix/sbin/zabbix_agentd -c /var/lib/openshift/$OPENSHIFT_APP_UUID/app-root/data/zabbix/etc/zabbix_agentd.conf Look in the logs:
[zabbix-chinacoolhacker.rhcloud.com zabbix]\> tail -3 /tmp/zabbix_server.log 82320:20150904:153339.334 server #24 started [escalator #1] 82321:20150904:153339.334 server #25 started [proxy poller #1] 82323:20150904:153339.335 server #26 started [self-monitoring #1] [zabbix-chinacoolhacker.rhcloud.com zabbix]\> tail -2 /tmp/zabbix_agentd.log 111422:20150904:154248.644 agent #4 started [listener #3] 111423:20150904:154248.644 agent #5 started [active checks #1] The executable code works, you can go to the front end.
Then I decided to use the openshift built-in functionality - deploy via git. I cloned myself on the local site “blank” site:
% git clone ssh://55e9bc400c1e66a589000029@zabbix-chinacoolhacker.rhcloud.com/~/git/zabbix.git/ There are 2 options for setting the front end of zabbix-by editing the config and through a convenient gui. Both options are working, but at restart we risk losing changes made in addition to the gita - so I’m doing through the config, it’s not difficult. Copied the contents of the front-end from the archive zabbix. I delete setup.php so that the attackers could not make changes to my installation and edit the config to suit my needs:
c@pentahon:~/ZABBIX/zabbix % rm -f setup.php c@pentahon:~/ZABBIX/zabbix % cd conf c@pentahon:~/ZABBIX/zabbix/conf % mv zabbix.conf.php.example zabbix.conf.php c@pentahon:~/ZABBIX/zabbix/conf % vi zabbix.conf.php // Zabbix GUI configuration file. global $DB; $DB["TYPE"] = 'MYSQL'; $DB["SERVER"] = 'localhost'; $DB["PORT"] = '0'; $DB["DATABASE"] = 'zabbix'; $DB["USER"] = 'zabbix'; $DB["PASSWORD"] = 'oDWp7akWrxWiMAIRCoYJ'; // Schema name. Used for IBM DB2 and PostgreSQL. $DB["SCHEMA"] = ''; $ZBX_SERVER = '127.13.151.129'; $ZBX_SERVER_PORT = '30051'; $ZBX_SERVER_NAME = 'Overseer'; $IMAGE_FORMAT_DEFAULT = IMAGE_FORMAT_PNG; ?> Create .htaccess in the root of the site:
c@pentahon:~/ZABBIX/zabbix/conf % cd .. c@pentahon:~/ZABBIX/zabbix % vi .htaccess php_value upload_max_filesize 20M php_value date.timezone Europe/Moscow php_value post_max_size 20M php_value max_execution_time 300 php_value max_input_time 300 php_value max_input_time 300 php_value mysql.default_socket "/var/lib/stickshift/$OPENSHIFT_APP_UUID/mysql-5.1/socket/mysql.sock" All in git!
git add * git add .htaccess git commit -m "zabb" git push After a successful push, you can enter the web interface (login \ password is admin \ zabbix, do not forget to change it!) And set up monitoring:
In order for the agent to work and metrics to start gathering, you need to change the ip and port settings:
Now you need to add several tasks to cron - to restart the server and agent applications if they fail. Crontab is located at /var/lib/openshift/55e9bc400c1e66a589000029/app-root/runtime/repo/.openshift/cron. Create files:
mkdir /tmp/status ]\> vi minutely/zabbixwatchog.sh #!/bin/bash ### config pidof_prog="/sbin/pidof" ### zabbix_agentd_prog=/var/lib/openshift/$OPENSHIFT_APP_UUID/app-root/data/zabbix/sbin/zabbix_agentd zabbix_agentd_conf=/var/lib/openshift/$OPENSHIFT_APP_UUID/app-root/data/zabbix/etc/zabbix_agentd.conf zabbix_server_prog=/var/lib/openshift/$OPENSHIFT_APP_UUID/app-root/data/zabbix/sbin/zabbix_server zabbix_server_conf=/var/lib/openshift/$OPENSHIFT_APP_UUID/app-root/data/zabbix/etc/zabbix_server.conf ### agentstatlog=/tmp/status/agentstat.log serverstatlog=/tmp/status/serverstat.log ### ### server lifekeeper ### serverststat=`$pidof_prog $zabbix_server_prog` if [ "$serverststat" ] then echo "`date` : server pids: $serverststat" >> $serverstatlog; else echo "restarting server at `date`" >> $serverstatlog; $zabbix_server_prog -c $zabbix_server_conf; sleep 3 echo "`date` SERVER started with pids: `$pidof_prog $zabbix_server_prog` " >> $serverstatlog; fi ### agent lifekeeper ### agentstat=`$pidof_prog $zabbix_agentd_prog` if [ "$agentstat" ] then echo "`date` : agent pids: $agentstat" >> $agentstatlog; else echo "restarting agent at `date`" >> $agentstatlog; $zabbix_agentd_prog -c $zabbix_agentd_conf; sleep 3 echo "`date` agent started with pids: `$pidof_prog $zabbix_agentd_prog` " >> $agentstatlog; fi # ]\> vi daily/zabbix.sh #!/bin/bash cp /tmp/status/agentstat.log /tmp/status/agentstat.log.`date +%Y-%m-%d` && echo '' > /tmp/status/agentstat.log cp /tmp/status/serverstat.log /tmp/status/serverstat.log.`date +%Y-%m-%d` && echo '' > /tmp/status/serverstat.log find /tmp/status/ -mtime +7 -exec rm {} \; Now, if there are no zabbix processes in the system, they will automatically start at the crown.
PS
This installation is well suited for web-scenarios and custom checks based on UserParamater, launched from an agent directly installed on the OpenShift server.
As Disen correctly noted, for security reasons, it is not recommended to put the zabbix-agent ports of your servers on the Internet!
Source: https://habr.com/ru/post/266327/
All Articles