To help the marketer: write automatic download of data from Adfox with visualization
In the last article , we reviewed an example of setting up automatic download of data from Yandex Metrics. This facilitates regular unloading, but the method turns out to be semi-automatic: you need to run the script, copy the results of the unloading to yourself and continue to deal with their design. Let's see how you can make the process fully automatic. For example, we will use the upload data from their Adfox advertising system.
Adfox has many ready-made reports, but even simple complications of reporting requirements cause problems. There is an option to set up regular reports, but in most cases you have to set up combinations of uploads yourself.
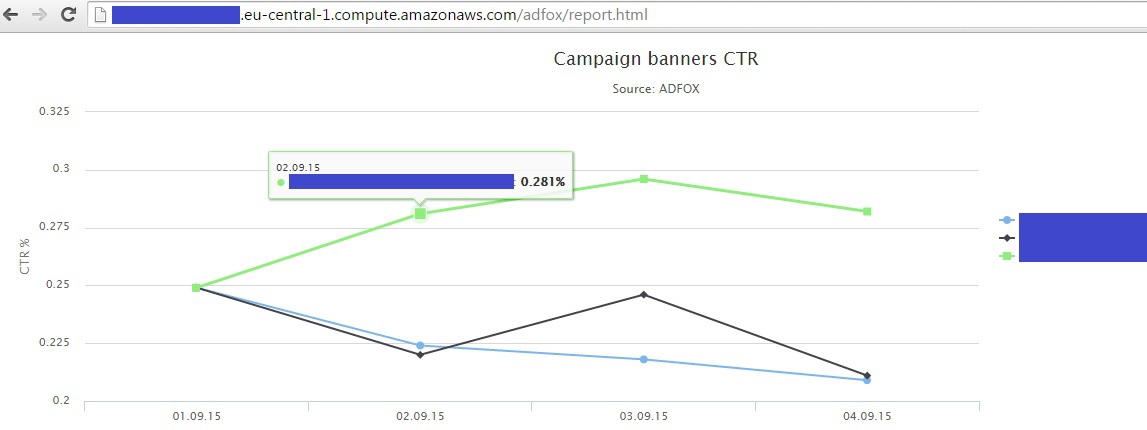
This article shows how to make a script that unloads the CTR of all banners that are available to the account (it’s impossible to do this manually by time). As well as how to display it on a graphic as a simple HTML page. That is, we will consistently review all campaigns and flights, take impressions and clicks on all banners and draw a CTR chart. As in the last article, we will work on the Amazon Web Services instances, so that it is universal and, most importantly, free. Uploading data to PHP, drawing graphics in Highcharts. The code implements the easiest way to upload and process data without any improvements. As a result, we get a page of the form that is updated daily for yesterday:
')
We start by creating an account on AWS (if not already). This procedure is described in detail in the documentation: docs.aws.amazon.com/AWSEC2/latest/UserGuide/ec2-ug.pdf (up to the item Getting started). Next, we will go through the stage described in the same documentation in the chapter “Tutorial: Installing a LAMP Web Server on Amazon Linux”: we will install the ones we need to upload and store PHP and MySQL data (later it’s better to work with MySQL than with text files). You can certainly do without it, using the built-in Python. Launch the Amazon Linux instance (see the previous article for details on where we selected the Ubuntu Server instance). Here we need exactly Linux, not Ubuntu. To run the LAMP web server on Ubuntu, see the documentation: help.ubuntu.com/community/ApacheMySQLPHP . So, choose an Amazon Linux instance, check the Security Group and make sure that we have a private key. After a couple of minutes we get the public DNS of our instance and connect to it via Putty (for Windows) or Terminal for MAC:

We put LAMP web server. Run the command to verify that we have the latest updates:
$ sudo yum update -y
We put PHP with the appropriate version:
$ sudo yum install -y httpd24 php56 mysql55-server php56-mysqlnd
Run the Apache web server:
$ sudo service httpd start
We want the Apache web server to start each time the system starts:
$ sudo chkconfig httpd on
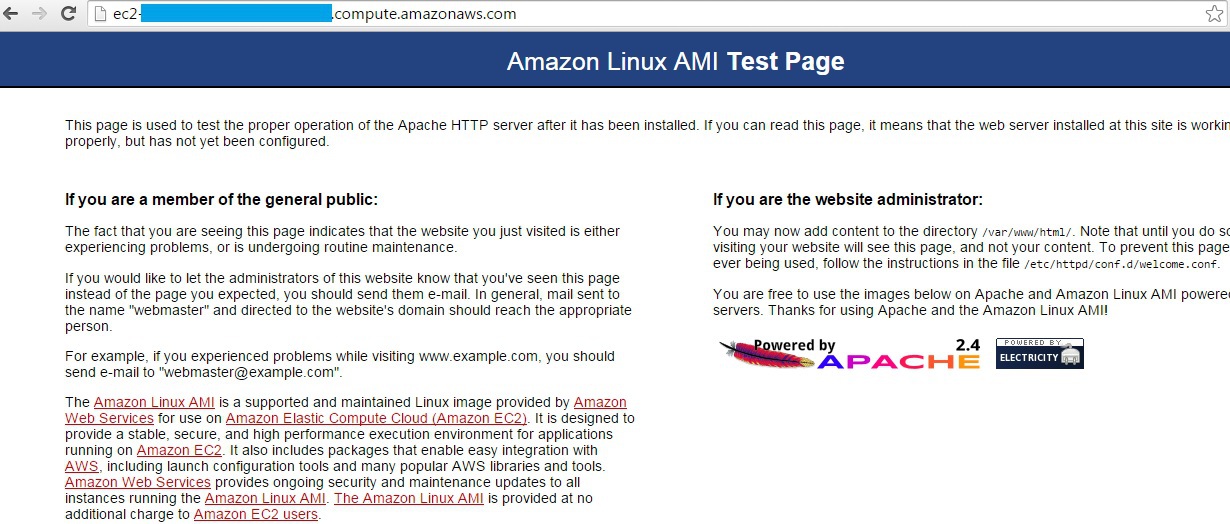
We test that everything went well: copy-paste into the public DNS browser of our instance and get the following page:
Now the root directory / var / www / is “owned” by the root user. Let's make ec2-user access there:
Create a group of "www":
$ sudo groupadd www
Add the user ec2-user to the www group:
$ sudo usermod -a -G www ec2-user
For the changes to take effect, close Putty or Terminal (exit command) and connect to the instance again. Check that the user ec2-user is registered in the www group:
$ groups
ec2-user wheel www
Change the owner of the folder / var / www:
$ sudo chown -R root: www / var / www
Add the ability for the user ec2-user and other users from the www group to change the / var / www folder:
$ sudo chmod 2775 / var / www
$ find / var / www-type d -exec sudo chmod 2775 {} +
$ find / var / www-type f -exec sudo chmod 0664 {} +
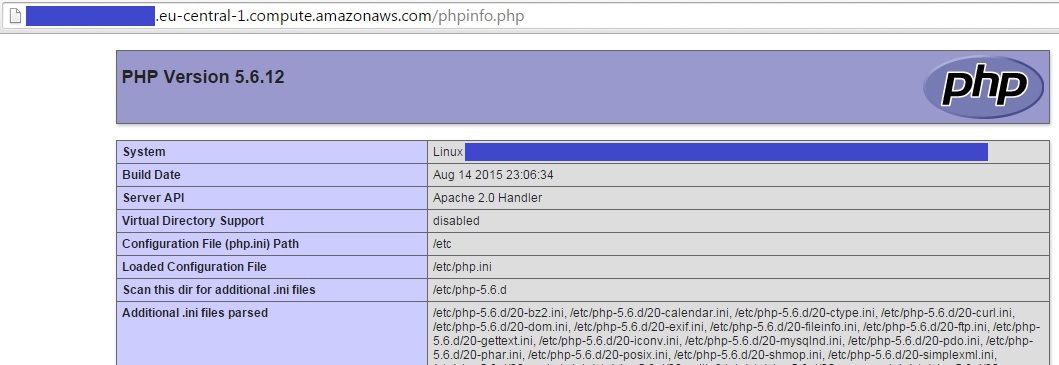
We are testing that now we can create PHP files in the / var / www directory. To do this, create a file phpinfo.php and write to it <? Php phpinfo (); ?>:
$ echo "<? php phpinfo ();?>"> /var/www/html/phpinfo.php
Again in the address bar of the copypastim browser Public DNS of our instance and add "/phpinfo.php". We should get the following PHP configuration page:
For security reasons, we delete the file created by us phpinfo.php:
$ rm /var/www/html/phpinfo.php
Great, we are ready to upload data from Adfox!
Downloading Adfox statistics
Documentation for the Adfox API can be found at help.adfox.ru (download link at the very bottom of the page). In general, the documentation is not very clear, so in general you can use the following rule: if you need to get a link for a report in the API, then copy the link from the browser and substitute the username and password + '& isXML = 1' into it for getting data in XML. If you need search features or campaign settings, you'll have to look in the API documentation.
In general, requests for the Adfox API are accompanied by a login (as you log in) and a SHA-256 hash of your password. You can generate a hash for a password on any site using the search query “sha-256 online”. For example, here: www.xorbin.com/tools/sha256-hash-calculator
If your password is “12345”, then for calls to the API, you should use the value “5994471abb01112afcc18159f6cc74b4f511b99806da59b3caf5a9c173cacfc5 as a password:

Our algorithm will consist of two steps:
Step 1 . Get a list of all available campaigns.
Take a list of available campaigns. If there are many campaigns, then we can confine ourselves to those that were instituted, for example, from August 1:
login.adfox.ru/API.php?object=account&action=list&actionObject=superCampaign&dateAddedFrom=2015-08-01&loginAccount=login&loginPassword=password-sha-256&isXML=1
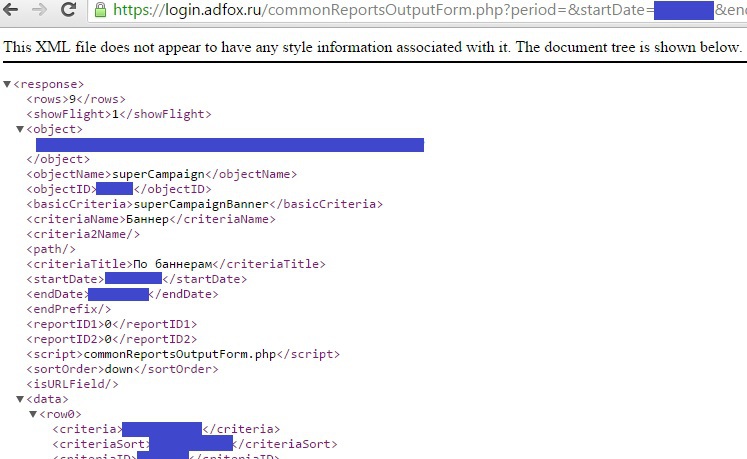
In the browser, we get the following XML file:

Step 2 . For each campaign we have its name (tag) and ID (). Now for each ID we get a report on banners (for example, for a campaign with ID = 55555):
login.adfox.ru/commonReportsOutputForm.php?period= & startDate
Make a script that will do this procedure every day and write data to a file. The easiest way is to go into the / var / www / html folder, create an adfox folder there and create a daily.php file in it with the following code:
We run the code in a few days (for example, September 1-4), substituting dates from 01/09/15 to 09/04/15 for startDate and endDate. As a result, statistics for each banner for each day from September 1 to September 4 should be accumulated in the data.txt file.
It remains to display our data on the chart and put the script to automatically update. To draw graphs use www.highcharts.com/demo/line-basic . You can download the library to the instances or access the libraries on the Highcharts website. The example uses the second option. The code of all the examples can be viewed at www.highcharts.com/demo/line-basic by clicking the “EDIT IN JSFIDDLE” button below the graph.
For the library to work correctly, we need jQuery . Download it from the site or directly in the console in the / var / www / html / adfox folder:
$ wget code.jquery.com/jquery-1.11.3.js
Add the chart code to the report.html file:
Open the report.html page in the browser, not forgetting that the file is in the adfox folder:
It remains to put our script on a daily update (for example, at 8:00 in the system time of the instance, which can be checked with the date command in the console). To do this, perform the console:
$ crontab -e
By default, the vim editor will open. To edit a file, click on 'i' (edit mode) and add the following line (paste it into the editor using Shift + Ins):
00 08 * * * / usr / bin / php /var/www/html/adfox/daily.php> / var / www / html / adfox / out
Then press esc (exit edit mode) and type ': wq' - save and exit. The console should display the line:
crontab: installing new crontab
To check the schedule setting:
$ crontab -l
00 08 * * * / usr / bin / php /var/www/html/adfox/daily.php> / var / www / html / adfox / out
In the out file, you can track the results of Cron tasks. For example, if errors occur during the execution of the script.
Read more about AWS Cron: docs.aws.amazon.com/opsworks/latest/userguide/workingcookbook-extend-cron.html
All is ready. In total, we have a script that daily updates data on impressions and clicks of all the banners available to us for yesterday. As well as an HTML page on which at any time you can see the dynamics of CTR banners over the past few days. AWS has many options for setting up secure data access. Also, while improving this approach, you can write data to the MySQL database, which is much easier to work with than with text files. I hope this approach will help you save time with regular work with Adfox.
Adfox has many ready-made reports, but even simple complications of reporting requirements cause problems. There is an option to set up regular reports, but in most cases you have to set up combinations of uploads yourself.
This article shows how to make a script that unloads the CTR of all banners that are available to the account (it’s impossible to do this manually by time). As well as how to display it on a graphic as a simple HTML page. That is, we will consistently review all campaigns and flights, take impressions and clicks on all banners and draw a CTR chart. As in the last article, we will work on the Amazon Web Services instances, so that it is universal and, most importantly, free. Uploading data to PHP, drawing graphics in Highcharts. The code implements the easiest way to upload and process data without any improvements. As a result, we get a page of the form that is updated daily for yesterday:
')
We start by creating an account on AWS (if not already). This procedure is described in detail in the documentation: docs.aws.amazon.com/AWSEC2/latest/UserGuide/ec2-ug.pdf (up to the item Getting started). Next, we will go through the stage described in the same documentation in the chapter “Tutorial: Installing a LAMP Web Server on Amazon Linux”: we will install the ones we need to upload and store PHP and MySQL data (later it’s better to work with MySQL than with text files). You can certainly do without it, using the built-in Python. Launch the Amazon Linux instance (see the previous article for details on where we selected the Ubuntu Server instance). Here we need exactly Linux, not Ubuntu. To run the LAMP web server on Ubuntu, see the documentation: help.ubuntu.com/community/ApacheMySQLPHP . So, choose an Amazon Linux instance, check the Security Group and make sure that we have a private key. After a couple of minutes we get the public DNS of our instance and connect to it via Putty (for Windows) or Terminal for MAC:
We put LAMP web server. Run the command to verify that we have the latest updates:
$ sudo yum update -y
We put PHP with the appropriate version:
$ sudo yum install -y httpd24 php56 mysql55-server php56-mysqlnd
Run the Apache web server:
$ sudo service httpd start
We want the Apache web server to start each time the system starts:
$ sudo chkconfig httpd on
We test that everything went well: copy-paste into the public DNS browser of our instance and get the following page:
Now the root directory / var / www / is “owned” by the root user. Let's make ec2-user access there:
Create a group of "www":
$ sudo groupadd www
Add the user ec2-user to the www group:
$ sudo usermod -a -G www ec2-user
For the changes to take effect, close Putty or Terminal (exit command) and connect to the instance again. Check that the user ec2-user is registered in the www group:
$ groups
ec2-user wheel www
Change the owner of the folder / var / www:
$ sudo chown -R root: www / var / www
Add the ability for the user ec2-user and other users from the www group to change the / var / www folder:
$ sudo chmod 2775 / var / www
$ find / var / www-type d -exec sudo chmod 2775 {} +
$ find / var / www-type f -exec sudo chmod 0664 {} +
We are testing that now we can create PHP files in the / var / www directory. To do this, create a file phpinfo.php and write to it <? Php phpinfo (); ?>:
$ echo "<? php phpinfo ();?>"> /var/www/html/phpinfo.php
Again in the address bar of the copypastim browser Public DNS of our instance and add "/phpinfo.php". We should get the following PHP configuration page:
For security reasons, we delete the file created by us phpinfo.php:
$ rm /var/www/html/phpinfo.php
Great, we are ready to upload data from Adfox!
Downloading Adfox statistics
Documentation for the Adfox API can be found at help.adfox.ru (download link at the very bottom of the page). In general, the documentation is not very clear, so in general you can use the following rule: if you need to get a link for a report in the API, then copy the link from the browser and substitute the username and password + '& isXML = 1' into it for getting data in XML. If you need search features or campaign settings, you'll have to look in the API documentation.
In general, requests for the Adfox API are accompanied by a login (as you log in) and a SHA-256 hash of your password. You can generate a hash for a password on any site using the search query “sha-256 online”. For example, here: www.xorbin.com/tools/sha256-hash-calculator
If your password is “12345”, then for calls to the API, you should use the value “5994471abb01112afcc18159f6cc74b4f511b99806da59b3caf5a9c173cacfc5 as a password:
Our algorithm will consist of two steps:
Step 1 . Get a list of all available campaigns.
Take a list of available campaigns. If there are many campaigns, then we can confine ourselves to those that were instituted, for example, from August 1:
login.adfox.ru/API.php?object=account&action=list&actionObject=superCampaign&dateAddedFrom=2015-08-01&loginAccount=login&loginPassword=password-sha-256&isXML=1
In the browser, we get the following XML file:
Step 2 . For each campaign we have its name (tag) and ID (). Now for each ID we get a report on banners (for example, for a campaign with ID = 55555):
login.adfox.ru/commonReportsOutputForm.php?period= & startDate
Make a script that will do this procedure every day and write data to a file. The easiest way is to go into the / var / www / html folder, create an adfox folder there and create a daily.php file in it with the following code:
Adfox Data Upload Code
<?php // , : startDate endDate // Adfox .. date_default_timezone_set("Europe/Moscow"); //$startDate = '04.09.15'; //$endDate = '04.09.15'; // $startDate = date('dmy', strtotime('-1 day')); $endDate = $startDate; // getCampaigns // $campIDs ID // dateAddedFrom , function getCampaigns() { $ch = curl_init(); $options = array( CURLOPT_URL => 'https://login.adfox.ru/API.php?object=account&action=list&actionObject=superCampaign&dateAddedFrom=2015-08-01&loginAccount=&loginPassword=-sha-256&isXML=1', CURLOPT_HEADER => "Content-Type:application/xml", CURLOPT_HTTPAUTH => CURLAUTH_BASIC, CURLOPT_SSL_VERIFYPEER => FALSE, CURLOPT_RETURNTRANSFER => TRUE ); curl_setopt_array($ch, $options); $data = curl_exec($ch); curl_close($ch); // Adfox , // file_put_contents('request.txt', $data, FILE_APPEND); // Adfox XML vals $parser=xml_parser_create('UTF-8'); xml_parse_into_struct($parser, $data, $vals, $index); $campIDs = array(); $j = 0; // vals, ID campIDs for ($i = 0; $i < count($vals); ++$i) { if ($vals[$i]["tag"]=="ID") { $ID = $vals[$i]["value"]; } if ($vals[$i]["tag"]=="NAME") { $name = $vals[$i]["value"]; $campIDs[$j]['id'] = $ID; $campIDs[$j]['name'] = $name; $j += 1; } } return $campIDs; } // getBanners ID // campReport ID + - - - function getBanners($id, $startDate, $endDate) { $ch = curl_init(); $options = array( CURLOPT_URL => 'https://login.adfox.ru/commonReportsOutputForm.php?period=&startDate='.$startDate.'&endDate='.$endDate.'&criteria=superCampaignBanner&isNewSearch=on&objectName=superCampaign&objectID='.$id.'&ignoreStartDate=off&loginAccount=&loginPassword=-sha-256&isXML=1', CURLOPT_HEADER => "Content-Type:application/xml", CURLOPT_HTTPAUTH => CURLAUTH_BASIC, CURLOPT_SSL_VERIFYPEER => FALSE, CURLOPT_RETURNTRANSFER => TRUE ); curl_setopt_array($ch, $options); $data = curl_exec($ch); curl_close($ch); // Adfox , //file_put_contents('request.txt', $data, FILE_APPEND); $parser=xml_parser_create('UTF-8'); xml_parse_into_struct($parser, $data, $vals, $index); $campReport = array(); $j = 0; for ($i = 0; $i < count($vals); ++$i) { if ($vals[$i]["tag"]=="CRITERIA") { $bannername = $vals[$i]["value"]; } if ($vals[$i]["tag"]=="FLIGHTNAME") { $flightname = $vals[$i]["value"]; } if ($vals[$i]["tag"]=="IMPRESSIONS") { $impressions = $vals[$i]["value"]; } if ($vals[$i]["tag"]=="CLICKS") { $clicks = $vals[$i]["value"]; $campReport[$j]['campaign'] = $id; $campReport[$j]['flightname'] = $flightname; $campReport[$j]['bannername'] = $bannername; $campReport[$j]['impressions'] = $impressions; $campReport[$j]['clicks'] = $clicks; $j += 1; } } return $campReport; } // $campIDs = getCampaigns(); // for ($i = 0; $i < count($campIDs); ++$i) { $campReport = getBanners($campIDs[$i]['id'], $startDate, $endDate); // data.txt // data.txt Cron for ($j = 0; $j < count($campReport); ++$j) { file_put_contents('/var/www/html/adfox/data.txt', $startDate."\t".$campReport[$j]['campaign']."\t".$campReport[$j]['flightname']."\t".$campReport[$j]['bannername']."\t".$campReport[$j]['impressions']."\t".$campReport[$j]['clicks']."\n", FILE_APPEND); // () echo 'Record created - '.$startDate.' - '.$campReport[$j]['bannername']."\n"; } } We run the code in a few days (for example, September 1-4), substituting dates from 01/09/15 to 09/04/15 for startDate and endDate. As a result, statistics for each banner for each day from September 1 to September 4 should be accumulated in the data.txt file.
It remains to display our data on the chart and put the script to automatically update. To draw graphs use www.highcharts.com/demo/line-basic . You can download the library to the instances or access the libraries on the Highcharts website. The example uses the second option. The code of all the examples can be viewed at www.highcharts.com/demo/line-basic by clicking the “EDIT IN JSFIDDLE” button below the graph.
For the library to work correctly, we need jQuery . Download it from the site or directly in the console in the / var / www / html / adfox folder:
$ wget code.jquery.com/jquery-1.11.3.js
Add the chart code to the report.html file:
HTML code with visualization
<html> <head> <script src="jquery-1.11.3.js"></script> <script src="http://code.highcharts.com/highcharts.js"></script> <script src="http://code.highcharts.com/modules/exporting.js"></script> </head> <body> <script> // , data.txt var banners = []; // , , data.txt // CTR ( ) var dates1 = []; var shows1 = []; var clicks1 = []; var ctr1 = []; var dates2 = []; var shows2 = []; var clicks2 = []; var ctr2 = []; var dates3 = []; var shows3 = []; var clicks3 = []; var ctr3 = []; // data.txt $.get("data.txt", function(data){ var lines = data.split("\n"); for (var i = 0, len = lines.length; i < len; i++) { // , //console.log(lines[i]); // 6 , data.txt elements = lines[i].split("\t"); // , elements // ( - 0, 1) banners.push(elements[2]); } // , //console.log(banners); // bannerNames 3 Array.prototype.unique = function() { var tmp = {}, out = []; for(var i = 0, n = this.length; i < n; ++i) { if(!tmp[this[i]]) { tmp[this[i]] = true; out.push(this[i]); } } return out; } bannersNames = banners.unique().slice(0, 3); // , 3 //console.log(bannersNames); // data.txt , bannerNames for (var i = 0, len = lines.length; i < len; i++) { elements = lines[i].split("\t"); // data.txt , , if (elements[2] == bannersNames[0]) { dates1.push(elements[0]); shows1.push(parseInt(elements[4])); clicks1.push(parseInt(elements[5])); // toFixed(3) - CTR if (parseInt(elements[4]) > 0) { ctr1.push(Number(parseFloat(elements[5] / elements[4] * 100).toFixed(3))); } else { ctr1.push(0); } } // if (elements[2] == bannersNames[1]) { dates2.push(elements[0]); shows2.push(parseInt(elements[4])); clicks2.push(parseInt(elements[5])); if (parseInt(elements[4]) > 0) { ctr2.push(Number(parseFloat(elements[5] / elements[4] * 100).toFixed(3))); } else { ctr2.push(0); } } // if (elements[2] == bannersNames[2]) { dates3.push(elements[0]); shows3.push(parseInt(elements[4])); clicks3.push(parseInt(elements[5])); if (parseInt(elements[4]) > 0) { ctr3.push(Number(parseFloat(elements[5] / elements[4] * 100).toFixed(3))); } else { ctr3.push(0); } } } // , CTR ( ) // : [0.22, 0.25, 0.30, 0.24] //console.log(ctr1); //console.log(ctr2); //console.log(ctr3); // CTR $(function () { // container <div id="container"... $('#container').highcharts({ // title: { text: 'Campaign banners CTR', x: -20 //center }, // subtitle: { text: 'Source: ADFOX', x: -20 }, // dates1 xAxis: { categories: dates1 }, // yAxis: { title: { text: 'CTR %' }, plotLines: [{ value: 0, width: 1, color: '#808080' }] }, // tooltip: { valueSuffix: '%' }, // legend: { layout: 'vertical', align: 'right', verticalAlign: 'middle', borderWidth: 0 }, // , : CTR series: [{ name: bannersNames[0], data: ctr1 }, { name: bannersNames[1], data: ctr2 }, { name: bannersNames[2], data: ctr3 }], credits: { enabled: false } }); }); }); </script> <div id="container" style="min-width: 310px; height: 400px; margin: 0 auto"></div> </body> </html> Open the report.html page in the browser, not forgetting that the file is in the adfox folder:
It remains to put our script on a daily update (for example, at 8:00 in the system time of the instance, which can be checked with the date command in the console). To do this, perform the console:
$ crontab -e
By default, the vim editor will open. To edit a file, click on 'i' (edit mode) and add the following line (paste it into the editor using Shift + Ins):
00 08 * * * / usr / bin / php /var/www/html/adfox/daily.php> / var / www / html / adfox / out
Then press esc (exit edit mode) and type ': wq' - save and exit. The console should display the line:
crontab: installing new crontab
To check the schedule setting:
$ crontab -l
00 08 * * * / usr / bin / php /var/www/html/adfox/daily.php> / var / www / html / adfox / out
In the out file, you can track the results of Cron tasks. For example, if errors occur during the execution of the script.
Read more about AWS Cron: docs.aws.amazon.com/opsworks/latest/userguide/workingcookbook-extend-cron.html
All is ready. In total, we have a script that daily updates data on impressions and clicks of all the banners available to us for yesterday. As well as an HTML page on which at any time you can see the dynamics of CTR banners over the past few days. AWS has many options for setting up secure data access. Also, while improving this approach, you can write data to the MySQL database, which is much easier to work with than with text files. I hope this approach will help you save time with regular work with Adfox.
Source: https://habr.com/ru/post/266307/
All Articles