Putting Android Logcat messages on the VTune Amplifier timeline
 The famous proverb says: "One mind is good, but two is better." It is valid not only for everyday situations, but also in the affairs of debugging applications. Combining the "minds" of various software tools, you can get not only quantitative, but also qualitative advantages. For example, the alliance Android Logcat and VTune Amplifier - this is just such a case.
Android Logcat is a powerful debug tool. With it, you can get a lot of useful information about the system or about applications with reference to timestamps. Android provides developers with standard APIs for logging data. These APIs are convenient to use when developing and debugging applications: just add the calls of the corresponding commands to the right places in the program code. Commands display messages in Logcat, where they can be viewed.
VTune Amplifier for specialized systems is a software complex for profiling. With it, you can analyze and optimize the performance of operating systems and applications. VTune Amplifier has a very useful tool - the timeline panel. It allows the developer to view performance information related to time.
How to map messages from Logcat to VTune Amplifier timeline? This will give developers the ability to see messages from Logcat along with performance information from the VTune Amplifier timeline. As a result, it will be possible to find out what exactly happened at a particular time and immediately understand what kind of load on the system this or that event had and how it affected performance.
')
Intel VTune Amplifier is able to process and integrate additional performance information into its own datasets obtained with its built-in tools. They can be obtained using external data collectors or tools of the application under test. In order to add external data to VTune Amplifier, you need a CSV file with a certain structure, which contains the collected information. This file, for further work with it, must be loaded into VTune Amplifier.
Details on creating your own CSV data files can be found in the VTune Amplifier User Manual. In particular, in the section VTune Amplifier> User's Guide> External Data Import there is information about how to create such files. There are also examples of their internal structure. In order for the messages from Logcat to appear on the VTune timeline, you must, following the instructions, convert them to a CSV file and upload the resulting file to the VTune Amplifier.
Example
Consider an example. There is an application "com.example.Thread1". It has a function in which heavy calculations are performed. Here is how it looks in general:
void myfunction () { Log.v("MYTEST", "start block 1"); { ...// 1 } Log.v("MYTEST", "start block 2"); { ...// 2 } Log.v("MYTEST", "my computation finished"); } Please note that before profiling an Android application using VTune Amplifier, you need to prepare the application. Namely, in its AndroidManifest.xml file, in the <application> section, the debugging feature must be enabled:
<application android:debuggable="true" ... > You can install the debug version of the application on an Android device, for example, using standard Android Studio tools. And after installing the application, Android Studio will need to close, otherwise VTune Amplifier will not be able to collect data. In order to combine the collection of Logcat messages and profiling in VTune Amplifier, you need to run Logcat from the command line. A universal tool, suitable for those who work in Windows, and for those who use Linux is the bash shell.
On Linux systems, bash is present by default. But if your host system is Windows, you will need additional software. We recommend cygwin . This application allows you to use bash-environment in Windows. Details on working with Logcat from the command line can be found here .
By default, if we, for example, run Logcat with the command $ adb logcat -v threadtime, the data will be displayed on the screen. It is much more convenient to redirect the output to an external file. This is done with the following command:
$ adb logcat -v threadtime > log.txt We redirect the output from Logcat to the file log.txt, which will be placed in the current directory.
You need to start collecting Logcat data before starting profiling in VTune Amplifier, and stop (Ctrl + C on the command line) after.
Let's return to our example. Judging by the timeline VTune Amplifier, which is shown below, the function was performed 6 times. The application's main thread ID is 12271. The brown columns are the performance information (CPU time) that was collected during the profiling using the VTune Amplifier.
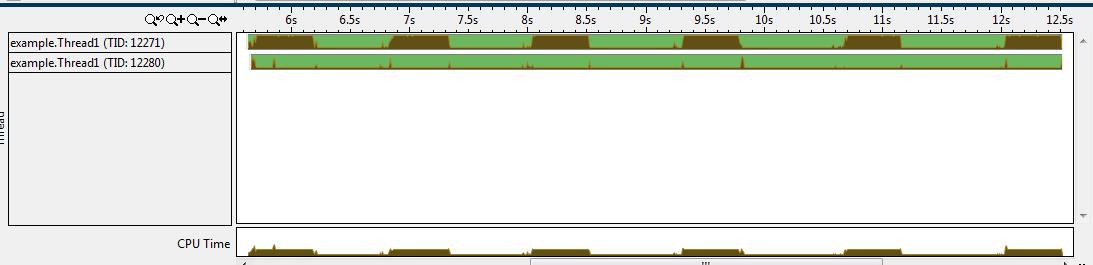
View application analysis results on the VTune Amplifier timeline
Each time the function is executed, if we collect Logcat messages with a command like "logcat -v threadtime", we will get the data set shown below.
01-12 11:13:19.090 2174 2174 V MYTEST : start block 1 01-12 11:13:19.260 2174 2174 V MYTEST : start block 2 01-12 11:13:19.500 2174 2174 V MYTEST : my computation finished After receiving this data, we can convert it to a CSV file of a suitable format that is suitable for uploading to VTune Amplifier. In accordance with the VTune Amplifier documentation, the CSV file we need may look like this:
name,start_tsc.UTC,end_tsc,pid,tid V/MYTEST : start block 1,2015-01-12 03:13:19.090,2015-01-12 03:13:19.090,2174,2174 V/MYTEST : start block 2,2015-01-12 03:13:19.260,2015-01-12 03:13:19.260,2174,2174 V/MYTEST:my computation finished,2015-01-12 03:13:19.500, 2015-01-12 03:13:19.500, 2174, 2174 Here, as the “name” data column, the tag that was used during logging and the message string are used. The message time falls into the start_tsc.UTC and end_tsc columns. The process ID and flow ID are presented in the CSV file, respectively, as pid and tid. Fields are separated by commas.
Now you need to go to the VTune Amplifier and execute the Analysis Type> Import from CSV command, choosing the newly created data file for import. The application loads the data and displays messages from the Logcat on a timeline with performance data. The figure below shows how moving the mouse to a small yellow triangle, which indicates the location of the message, displays a pop-up window with data from Logcat that was generated by our application.
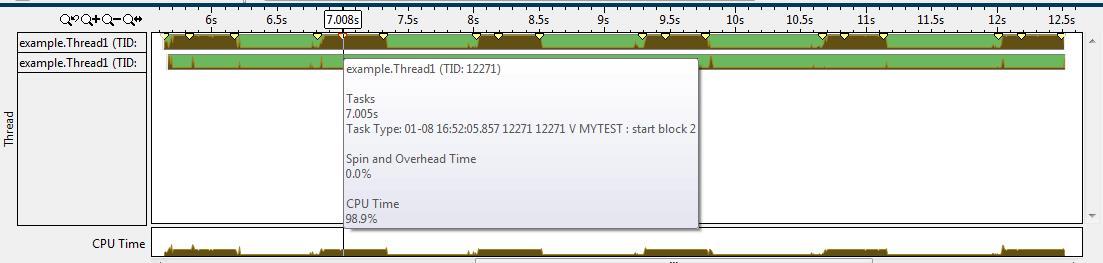
View messages from Logcat on the VTune Amplifier timeline
Here are some tips that relate to creating CSV files.
- The time stamps displayed in Logcat are taken from the Android OS. They are tied to the time zone that is set on the device. These, when creating a CSV file, need to be changed to time stamps in the UTC standard. They are the ones that are needed to successfully import data into VTune Amplifier.
- The name of the host (hostname) on which the data is collected using a third-party application should be specified in the name of the CSV file. For example, a file name may have the following structure: [user-defined] -hostname- <hostname-of-system> .csv. For target devices running Android, the host name is in the / proc / sys / kernel / hostname file. You can view it using the ADB shell.
- String data, which are located in the column "name", can be customized in accordance with the needs of the developer. In the example discussed above, we went without frills: the entire Logcat message was placed in the “name” column. Note that the string data that is intended for the "name" column must not contain commas. The comma character is a reserved delimiter character that should not appear in lines.
- You can also convert messages from the system kernel into the CSV format (for example, from “dmesg”), import them into VTune Amplifier and view them on the timeline. This feature is very useful for system programmers, for example, those who develop kernel modules or device drivers. For messages from the system kernel, the process ID and thread must be set to 0. Note that the time stamps of the system messages (for example, from the same “dmesg”) start from the moment the system boots. They need to be converted so that they indicate the UTC time of the message output. For example, you can use the following formula for calculating message time stamps: “Message time” = “current time” - “time from the beginning of the system operation” + “message time stamp”. Under the "current time" here refers to the current system time. It can be obtained using the “date” command in the ADB shell. “Time since the system started working” is the time that has passed since the beginning of the OS boot. It can be found in the file / proc / uptime.
Helper script
We have created an experimental bash script (logcat2vtune.sh), which allows us to simplify the above steps. You can use it to automate the collection of Logcat data and the creation of a CSV file. The script can collect messages that are displayed in the Logcat application, as well as - messages from the system kernel. In addition, it reads information about the target system, parses the logging results and automatically generates CSV files.
In order to use this script, you will need a bash environment. As mentioned above, in Linux systems this is the standard working environment, while in Windows you can use, for example, Cygwin.
In order to get a CSV data file during profiling using VTune Amplifier, you need to do the following:
- Check if “adb” is available from the command line. After that, run the script logcat2vtune.sh, specifying the necessary keys. For example, like this:> ./logcat2vtune.sh -c logcat -g MYTEST
- Start performance data collection in VTune Amplifier. This can be done both from the application window and through the command line.
- Stop data collection in VTune Amplifier.
- Click any button in the command line window where logcat2vtune.sh is running, thereby stopping data collection. The script will read the collected logging data, parse it using bash regular expressions and convert it to a CSV file. This file can be found in the current folder, which you work from the command line.
- Download the resulting CSV file to the VTune Amplifier. Now messages from Logcat can be viewed on the timeline.
Here are some typical examples of using the script.
$logcat2vtune.sh -c logcat -g MYTEST This command allows you to collect Logcat data, select messages with the “MYTEST” line and generate a CSV file. Logcat collects data using the following command:
$adb shell logcat -v threadtime "MYTEST" is the string that filters messages from Logcat. We strongly recommend using filters, since Logcat can display very long lists of messages, while developers usually are only interested in messages from their process. As a filter, you can use the Logcat message tag name, process ID, thread ID, or any other string. Here you can use commas, you can specify multiple lines. Messages that match any string specified when starting the script with the "-g" key will be selected and organized as a CSV file.
$logcat2vtune.sh -c dmesg -g MYDRIVER Using this command, you can collect messages from “dmesg”, filter them by the “MYDRIVER” line and create a CSV file.
$logcat2vtune.sh -c logcatk -g MYTEST,MYDRIVER This command allows you to collect both regular messages from Logcat and messages from the kernel, filter them by “MYTEST” or “MYDRIVER” lines and create a CSV file. As a result, on the VTune Amplifier timeline, you can view messages from normal user-level applications and kernel messages from dmesg. The script collects this data using the following command:
>adb shell logcat -v threadtime -f /dev/kmsg | adb shell cat /proc/kmsg In this case, on the timeline, you will see messages from vmlinux with TID 0 and user-level logs from Logcat with TID 1922.

View Logcat messages received from various streams on the VTune Amplifier timeline
To learn more about working with a script, use the following command: “logcat2vtune.sh –h”.
If you wish, you can customize the script for your own needs. Please note that “logcat2vtune.sh” is a pilot project, it has not passed a comprehensive test. If there are any problems with it, you can tell us about it.
findings
What we have described here applies to the products of Intel System Studio 2015 and Intel System Studio 2016. The material covers the work with the Windows (IA-32, Intel 64) and Linux (IA32, Intel 64) host systems. The target system considered the Android OS.
Using the tools and techniques described above, you can bring the profiling and debugging of Android applications to a higher level by combining information from Android Logcat with performance data from VTune Amplifier. We hope this will help your applications conquer new heights of performance and economy.
Source: https://habr.com/ru/post/266149/
All Articles