Industrial control system: how we created a system for the exact calculation of the machine tool life of a large plant
Features of the formation of signals (delays of local signals of automation) in the control system, this creates some difficulties in calculating the operating time.
The essence of the problem is very simple: there is a lot of very expensive equipment that requires regular technical inspections and timely maintenance. For the past ten years, equipment has been serviced, for example, once every six months, once every three months, and so on, without correlation with the actual operating time. The point was that if an accident occurs on the equipment, and in doing so, the equipment in fact has worked out a longer period than it should be before the service - the manager will sit down.
')
Nobody wanted to sit down, so they counted with a large margin. On the other hand, to do maintenance more often than necessary - to lose extra funds for repairs, work and downtime. Therefore, accurate accounting was required.
On high-tech industries, one of the methods is to put a special controller on each technical object that requires consideration of its operating time. It is quite expensive. There are machines and other high-tech equipment, which they themselves consider, it is important to simply take the data correctly. In our case, the recording of the operating time was carried out manually, in a logbook with the help of a mechanic of the type “machine worked 3 days plus or minus 4 hours” As a result, it was decided to pick up the manager software and remove data from it. Now I’ll tell you what happened next and what the picture above is related to.
Architecture
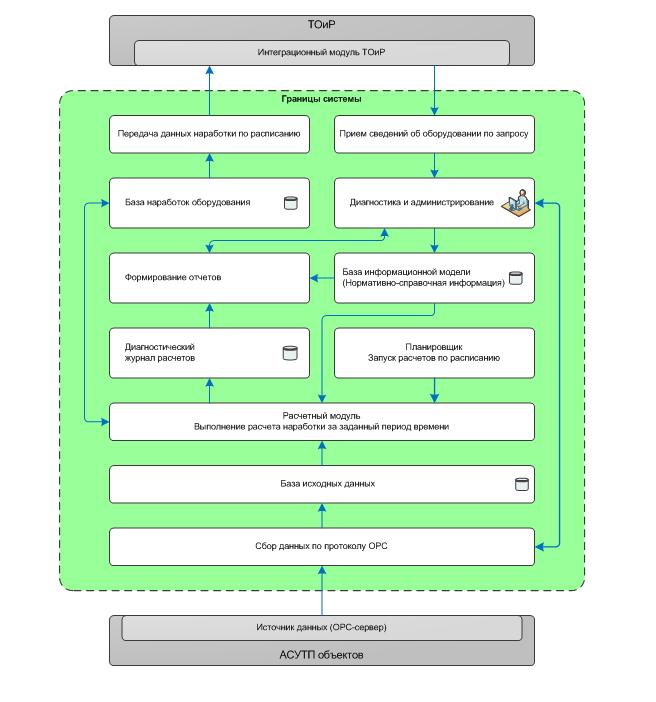
Functional architecture of the machine tool life calculation system
The essence of the work - we take data on all the events in production, which already have from the industrial control system. In an ideal world, all the signaling circuits ideally show what and how — you just need to pick up the equipment images (what it is and how it works) from the system a higher level and apply signaling circuits, and then calculate the operating time using the algorithm and return it to the MRO system. But you and I are in the real world, so it just didn’t work out right. Let's start with the fact that in the ideal world each machine has a detailed instruction, it exactly corresponds to reality. In our world, we had to reveal the nature of the work of many things empirically.
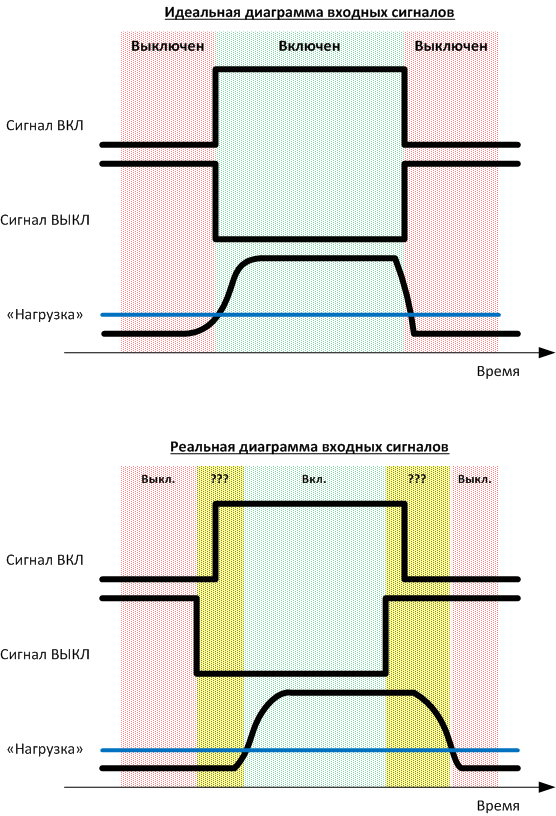
For example, in the picture before kata, you see the simplest case of how the service signaling (two bits - the “ON” signal and the “OFF” signal) suddenly turns from a trigger into something much more monstrous. That is life. And it is necessary to consider the operating time of the machine not according to these signals, but (in this particular case) according to the load. There were other situations more fun, but, alas, I have no right to go deep, it’s too painful a specific production.
How was the work
So, we have a server that analyzes the data of the automated process control system (dispatching control and management), considers the operating time (or rather, various state switching, and other events, which ultimately boil down to operating time numbers) and give it further to ERP (MRO), where planned preventive repairs. We obtain, from the bottom, roughly speaking, data on the condition of the equipment, and on top, its hierarchy.
The calculation scheme is above; In general, this is a well-known technical process, which in the form of abstractions is supported by 4 different manufacturers of industrial software (including an open source solution), but, as usual - when it comes to a particular object, a file needs to be improved. We have created not only a common architecture, but also specific data correction algorithms, because, as I said, the features of the control systems are such that they can break the entire logic of the software from the root. Here it is necessary to clarify that the data on the state of the equipment comes in the form of three signals - the “on” signal, the “off” signal and the current equipment load. For the load, a threshold value is set, above which it is considered that the equipment is turned on and operates in nominal mode. Ideally, these signals should vary consistently with each other. But the reality was that the signals did not always change as expected. That creates additional difficulties. Plus, it was necessary to add some of the signals, since they were poorly described, differed in implementation, or were not initially supported by the protocol.
Then it was necessary to restore historical data in case of communication failure between the components of the system and to develop a scheme for calculating the operating time during a long break of this connection. We recorded, recalculated and created tools to account for such situations. The difficulty is that during a physical connection breakage, we simply did not see the events, but did not know about the fact of the loss of the signal. These are the features of the protocol. As a result, at the level of the automated process control system I had to create a “pulse” - a kind of virtual valve that moved once a second. Thanks to this “sensor” we knew that the signal was coming. If he “clicked” incorrectly or with distortions, we marked the period as unreliable. If for an unreliable period it was impossible to recover data from the logs (or recount it by hand), then a level higher, it was most likely noted as an operating time, since the main task is not to step over the limit without maintenance.
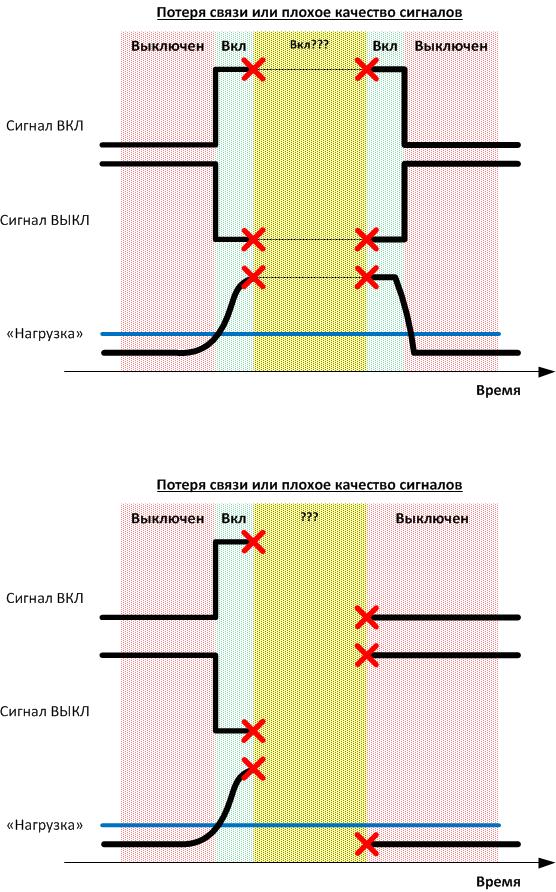
Additional complexity was brought by problems with data transmission, which was reflected in their availability and quality. In case of short-term loss of communication with the data source, it is possible to make a reasonable assumption that the condition of the equipment did not change during this period of time, but with a long absence of data the condition of the equipment could change, in which case the system could not give an unambiguous answer to the question - what happened during that time? for which data is not available. As a result of the project implementation, algorithms that can handle these and other non-standard situations were developed and agreed with the customer.
Then there was another iteration of working with “bad” data so that there were no undercount errors. Then - already trial operation. We started after two stages of testing. Each production site had its own characteristics. The most interesting thing was to play detective in half with the work of the doctor - it was necessary to make a picture of the signals, get data about the features of the equipment, communicate with all dispatchers ... The men at the factory helped a lot: the servicemen immediately understood what we were doing, we were very happy that we didn’t touch the bottom level and their iron hands, and began to share experiences. Many checked by hand the calculations of the system, chased the cause of each discrepancy. As a result, algorithms that can handle various non-standard situations were developed and agreed upon. To account for different types of equipment, additional tuning parameters were introduced into the algorithms, such as dead time, allowable error, etc. For the new equipment, the user can himself fine-tune the algorithms both at the system level as a whole and at the level of an individual piece of equipment or group - because individual units can also behave differently.
As a result, accuracy is now up to a fraction of a second, which is very, very cool for us and for production. The next step is to test the scalability without our direct participation, independently by dispatchers.
On a specific production, the machine begins to be polled immediately after appearing in SAP. In general, such systems can be built without touching ERP - we have, as you can see, the system has its own reports. Just in this case, the customer is more convenient to redistribute and load, and repairs it in the ERP. In the course of the play, by the way, the MRO data transfer requirements changed a couple of times - but they had a planned upgrade, and this, on the whole, is normal.
Of course, it’s very cool that we didn’t climb to the lower level at all, where the service signaling goes to the physical nodes - this made the project much cheaper than typical ones.
The result is difficult to estimate in money, but the customer knows for sure that there will be no useless repairs according to the plans.
Summary
In general, this experience can be repeated in any industry. In this project, we used the PI System platform plus a number of our developments as the basis for data exchange. For example, we had to develop our own interaction with our system of maintenance and repair, as well as tools for visualizing diagnostic information and building reports (AWP).
But in general, such things can be done also on the basis of solutions from such vendors as WonderWare (Wonderware System Platform platform), Iconics (ICONICS Genesis platform), Tibbo (Taiwanese-Russian vendor, the platform is called Aggregate). But the main feature, of course, is that for the successful completion of the project, it is highly desirable that the experience of algorithmization is not always complete and consistent data of the service signaling, plus the actual experience of working with large-scale production.
Again, MRO modules have already been installed at our facilities. But in general, this is not necessary, for example, instead of uploading data to them, you can also use our web reports (the user can monitor the system status, generate reports, receive and download data, monitor the availability of tags for collection, perform manual submissions and configure the system) - This part of the solution was created on the Microsoft .NET Framework based on ASP.NET, the C # language. Front-end - on HTML5.
Total:
- Collection of source data necessary for performing calculations;
- Calculation of operating time on the basis of data collected from the automated process control system;
- The transfer of parameters for operating time within the prescribed time limits;
- Receiving data from the maintenance and repair system needed to configure our system;
- Providing the system administrator with the ability to control data acquisition errors from the automated process control system and SAP, diagnose the software and hardware of the system, as well as an interface for generating reports, collecting and viewing statistics.
In general, we put our server next to their servers, and they got accurate calculations on the machine tool hours. Next - a whole bunch of data consolidation, processing, etc., - in general, detectives and algorithms. The result is an accurate source of data about the operating time, which interacts with the established systems of production automation and enterprise management. There was a lot of pain associated with the fact that it is still a large production group with the necessary bureaucratic features, but according to our projects, this is a rather usual working process. In general, there were no surprises, except for a number of equipment indications and the lack of technical documentation in some cases, which, in fact, had to be reversed - but this was supposed to be at the very beginning.
That seems to be all. If you have questions that do not relate to the specifics of production (here I have no right to tell even where the plants are) - I will be happy to answer in the comments. If the question is not for comments, write to sbannikov@croc.ru.
Source: https://habr.com/ru/post/266007/
All Articles