IBM Cognos BI and QlikView, where to start curious?
Some time ago I wrote an article in which I described the mechanics of working with BI systems relatively briefly using the example of IBM Cognos BI. I decided to develop a little topic, and make a kind of "comparison" of the analytical products of IBM Cognos and QlikView .
The publication material itself cannot be called a comparison, it is more the instruction “where to start?”. I will demonstrate how to make a relatively uncomplicated report with 2 tools - IBM Cognos BI and QlikView, and you can decide for yourself which one is more suitable for you (or not for you).
Article material will be presented in the form of a combination of a bit of text and a lot of video (amateurs can read the article about IBM Cognos BI ). I hope that this way of conveying information will be convenient and will shorten the time for creating the material.
Notes
- All materials of the article were prepared using trial versions of software (IBM Cognos Express and QlikView Personal Edition). This means that each of you can go to the official website, download the trial version and repeat everything shown;
- I have a wealth of experience with IBM Cognos products (there are a number of successful projects, certificates, etc.), while at the same time, there is much less experience with Qlik products;
- Often, the same task may have several solutions, and if I chose and demonstrated a specific solution, this does not mean that this particular solution is the best or most optimal solution, just at the moment I decided to perform a specific implementation that way.
Formulation of the problem
I thought a lot what a test task should be. On the one hand, I wanted to show more functionality, on the other hand, the more functions I consider, the larger the material becomes. In the end, I decided that the material considered should be enough for the uninitiated person to start working with the tools in question.
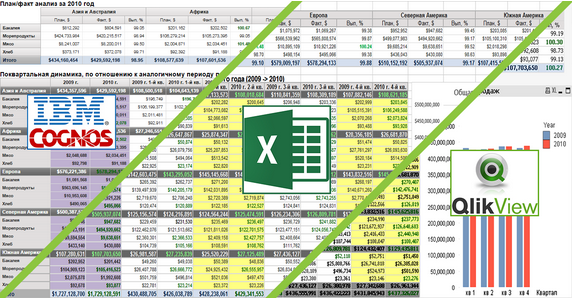
So, suppose that some customer provided us with a sample of the report made in Excel (see screenshot) and wants us to do the same, selected BI tool, based on their data marts.

')
Of course, in real life, a real customer is unlikely to provide you with such a structured and formalized sample report. Real samples often have a very arbitrary shape. But in fact, always, all reports of an arbitrary type are formalized and structured, and then implemented in BI systems.
As with the report, the client most likely will not provide you with a ready-made data mart and you will have to build it yourself, based on the already existing data warehouse (most often complex and heterogeneous). But in our case we will already have a ready data mart.
Metadata
In simple terms, metadata in BI systems is a mechanism by which the user shows the BI system how the data storage system is organized and how to work with this data. Every BI system I know has a metadata mechanism. Metadata is not always just information about the data source, in some cases, metadata is the internal storage mechanisms of the BI system (for example, OLAP cubes). For example, metadata in Cognos BI is a formalized description of the structure of the data storage system, and in QlikView, tables with data loaded into proprietary storage and the mechanisms for their formation.
I can identify 2 diametrically opposed approaches to the development of metadata:
- Minimalistic - metadata includes the minimum that is needed to solve a specific task. Most often, this approach is used when it is necessary to solve a specific task as quickly as possible (to build a specific report). The advantage of this approach is a very high speed of development, the disadvantage is non-universality, lack of potential for expansion, limited opportunities for the construction of arbitrary reports by the analyst. Also, when developing metadata at a fast pace, developers often neglect the best practice rules;
- Universal - metadata includes the maximum description of the data source. This approach is used when we need to make a universal analyst tool. Advantages of this approach are high potential for expansion (usually in such metadata it is easy to add a new attribute, dimension or indicator), universality for the analyst (the analyst can quickly and relatively simply build reports of virtually any level of detail). Among the shortcomings can be noted the long development time and reduced speed of reports on large amounts of data.
In our case, I will try to stop at the golden middle. That is, I will not include in the metadata those tables that are not needed for the construction of our report. But at the same time I will try to maintain the potential for expansion and take into account the rules of best practices.
Metadata for IBM Cognos BI
Metadata for QlikView
Reports
When the metadata is ready, we can begin to develop reports. In the process of developing reports, I will also try to find a compromise between the speed at which a report is developed and its versatility. In principle, all serious BI tools support a very wide range of functions (the ability to create parameterized reports, Drill-Down and Drill-Trouth communication, cyclic display of elements, etc.), in this article I will try to use only the basic functionality.
Report Design in IBM Cognos BI
Report Development in QlikView
From my point of view, when developing a static regular report in QlikView, I do not do very fair, because QlikView is more focused on interactive data analysis in real time. On the other hand, my task is to show the basic mechanics of working with a tool, and the solution to any thematic problem is suitable for this purpose.Source: https://habr.com/ru/post/265835/
All Articles