Life and graphs: a network approach to system modeling

The modern world is ruled by all kinds of networks. Virtually any data can be represented as a network structure. At the same time, many people do not realize, do not see that the basis of one or another system is based on network principles. In this post we will look at several types of networks that model different systems, analyze their advantages and disadvantages, and also talk about the benefits that the network approach to modeling gives us.
Networks and markets
Trading is the process of selling a product or service from one party to another, which means it is a type of network. It is an analysis of market networks that can help us understand how the economy functions.
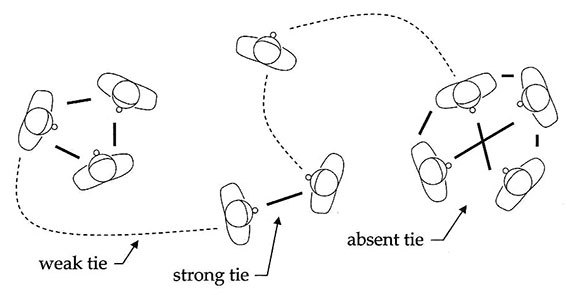
Some time ago, Mark Granovetter (Mark Granovetter), who was researching job search processes, discovered the power of weak ties .
')
Granovetter's work has had a very big impact on the analysis of social networks. In particular, it argues something that is contrary to common sense: specialists with whom you have few points of contact (weak ties) may be the best source of useful information on work, because they have access to more recent data that differs from those that are available to people with whom you communicate more closely (strong ties). This “hypothesis of weak ties” is used today to analyze all sorts of types of relationships.
A few decades ago, when analyzing social networks, researchers operated only on the data that they were able to collect on their own, through personal experience, as well as interviewing their closest circle and spending many hours "in the fields." Today, the source data for analysis delivers countless social networking sites and applications. And the Internet itself can be represented in the form of a large graph, reflecting the logical interconnections between websites. And to research and understand the principles of the functioning of these ecosystems, you can use a wide range of techniques used in the analysis of social networks. In fact, the competent application of the analysis today is one of the main innovations in the field of social networks.
Success networks
There are other ways to use networks to understand market connections.
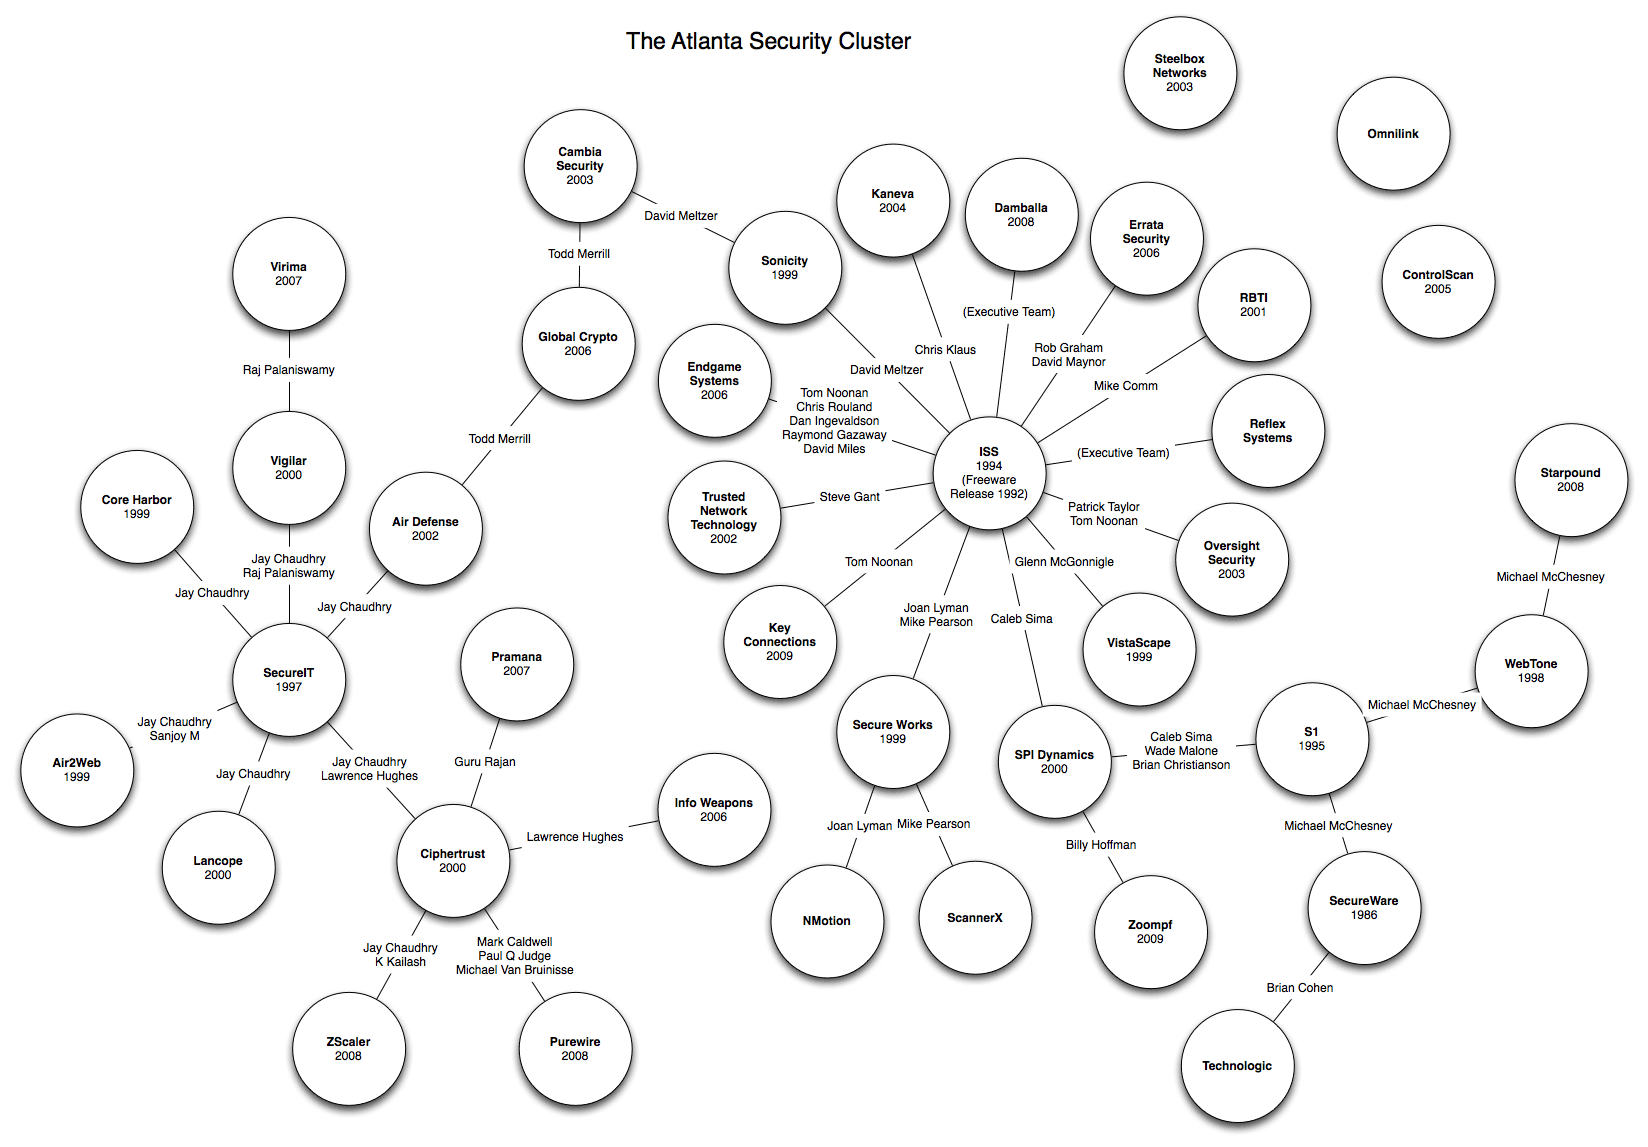
This is how the interconnection between information security startups in Atlanta looks like as of 2010. It was possible to build it thanks to the information received from the startup participants themselves, as well as from LinkedIn and Google. Each node in the diagram corresponds to a company. The connection between nodes A and B suggests that the founder of company B had previously worked for company A. For example, Internet Security Systems (ISS) and SecureIT are the real incubators of startup founders, giving rise to most of the companies represented in the scheme.
This simple scheme well illustrates the idea that the network-based principle is at the heart of the startup ecosystem process. Entire clusters of companies survive together due to the so-called “success network” - interconnections between individuals working in the same direction, developing multiple skills, social capital and financial resources.
This network is similar to a number of well-known social networks, such as PayPal Mafia or Fairchildren . And by “ social networks ” here are not meant Facebook or VKontakte, but social structures that are studied through the analysis of social networks .
The scheme presented above proves the importance of mentoring and training in creating start-ups and ecosystems. Employees' participation in the company's IPO is equivalent to each of them gaining start-up capital. True, startup ecosystems are rarely present in the ecosystems, since in the provinces, employees usually lack the capacity and financial means to take risks and create their own start-ups.
But as soon as some startups begin to generate others, the ecosystem becomes self-developing, it no longer needs external support. Earlier generations of entrepreneurs begin to invest themselves and become mentors for new entrepreneurs, and each cluster that emerges becomes more stable, and the ties within it expand.
One of the ways to benefit from such schemes is to invest in companies that make up such clusters. Naturally, to do this, you must first identify these links by analyzing the array of available data and constructing a circuit. Thus, the share of investment losses can be reduced, since the synergistic effect of interaction between companies within clusters increases the likelihood of their success in the market.
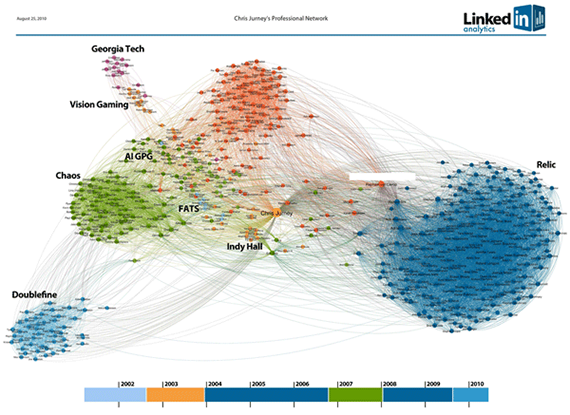
InMaps LinkedIn
At the time, Ali Imam , working in LinkedIn, developed InMaps as a side project. But he was extremely successful, the audience began to use this functionality with great enthusiasm.
InMaps was a great example of an application using snowball sampling and one-and-a-half redirection networks (1.5 hop networks). The snowball was a sample that begins with one or several people and then grows like a snowball as it is included in the sample of friends, friends of friends, friends of their friends, etc. Until the sample is large enough to draw the necessary conclusions from it. The “networks with one-and-a-half admission” meant local groups of people formed around an object or person. These two concepts help to analyze parts of large graphs that cannot be covered entirely.
In InMaps, a user of LinkedIn was taken, people connected with him were added to it, as well as connections between them — it was a “network with a one-and-a-half reinterpretation”. If the original person and the people associated with it were taken, without “radial” connections, it would be a “one-way network”. If you include not only the connections between the friends of the “central” user, but their connections with other people who are not connected with the first, then you would get a “network with two pereperiemi”.
It's funny, but one of the InMaps bugs turned into a feature as a result. At the final stage of development, the functionality that allows users to name the clusters created in the application has not yet been implemented. At the same time, the developers had a question, how to draw the attention of users to the project?
In the end, a wide-format printer printed a map of the interrelationships of a brother of one of the developers, and he manually pasted the names of the clusters invented by him. This bar - when it is necessary to give names to the clusters on your map - was subsequently very much liked by the users. This only reinforced the viral dissemination of information about the new instrument, with the help of which it was possible to visualize his entire career and professional activity.
Mailbox networks
Another interesting example of networking is the result of Enron data analysis. In the course of a large-scale investigation that accompanied the bankruptcy of the corporation , about 0.5 GB of emails were collected, which later turned into a standard set of data for testing various statistical software.
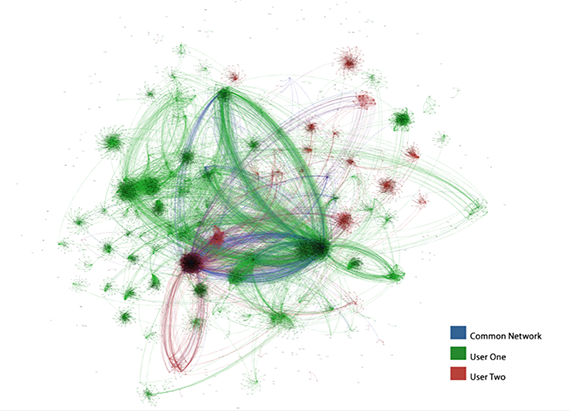
After working with Enron data, Russell Jurney , the author of the article, decided that he wanted to work with personal information, and not with someone else's letters. To do this, he wrote a script that downloads letters from the Inbox to Gmail and converts them to Avro format. Using the algorithms used in InMaps, Russell created a map of interconnections from his mailbox:
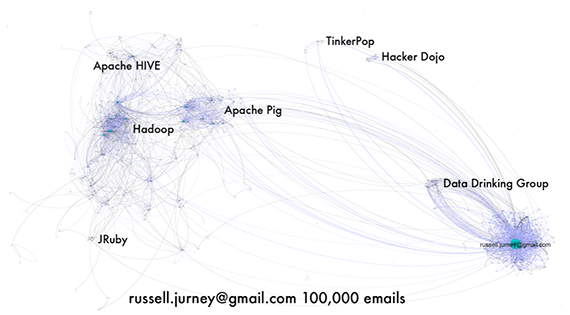
It clearly reflects the group and mailing lists, in which Russell participated. He also created a map of relations between the authors of letters, on which they are combined into groups and organizations. The “mailboxes network” technology formed the basis of the RelatelQ project, which was acquired in 2014 for $ 392 million. One of the advantages of RelatelQ is that it can be used to greatly reduce the amount of data entered into the CRM system. This is achieved through the automatic identification of companies with which the correspondence is conducted, and the creation of links between incoming and outgoing correspondence in the CRM system.
This technology is also used in a Kontexa startup founded by Russell Jurni. With it, you can create collaborative semantic mailboxes. Here is an example of the visualization of links between different mailboxes at the semantic level:
This work later formed the basis of the book Agile Data Science . With its help, readers can independently download letters from their mailboxes and analyze them in Apache Pig and Python.
CRM analysis
CRM databases can cost many millions of dollars, and they are a find for the analyst, because they can test a variety of tools and techniques. One of the interesting tasks was the study of the possibility of visual clustering of similar databases for subsequent automatic targeting.
Below is a map of links based on the CRM databases of the main Hadoop vendors: Cloudera, Hortonworks, MapR and Pivotal. Relationships were established on the basis of partner lists. Most big data companies have such lists. It lists those organizations whose products and services are used in the proposed solutions. First, a partnership map was built for each of the four vendors, and then partnership partners were added.
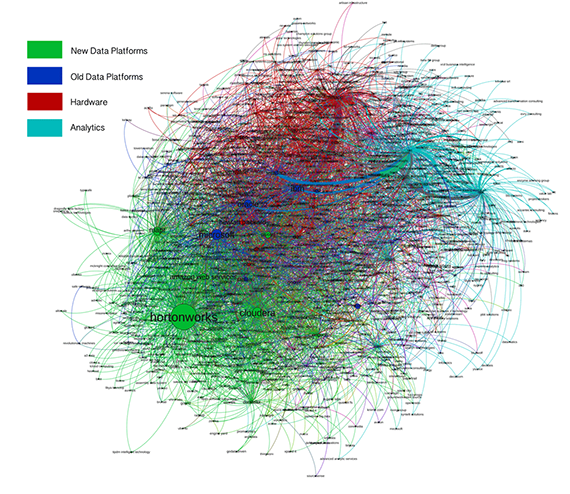
With the help of such maps, you can create content designed for specific clusters and more effectively target it.
Here you probably had an idea: what if in this way to build a map of entire markets? Why are there markets - economies! Create a global pattern of relationships between all organizations involved in commodity-money relations. Probably, this ambitious project may well be implemented. In particular, using such a map it would be easier to identify weak spots in the economy and increase the efficiency of various markets. For this purpose, the startup Relato was created, for example. Later, the data collected with it will be compiled into the report. Mapping Big Data: A market driven by data that will appear in the public domain through a partnership with O'Reilly. The report will feature analytics for companies offering products and services for working with big data.
As you can see, network structures underlie a variety of phenomena and systems.
So the next time you start working with some data, ask yourself: aren't they a network? What will give me a similar view of the relationship?
Source: https://habr.com/ru/post/265733/
All Articles