Sending push notifications to Go

If you have been using VKontakte mobile applications for the last year (even if not official ones), then this material will reveal some data on how push notifications work for us. The gun is implemented in the Go language, and sends up to 9 billion guns per day to four target platforms: GCM, APNS, MPNS, WNS.
In this post I decided to talk about the overall architecture of the gun, problems and workarounds, loads and performance solutions. Many letters and little code.
The architecture is simple: some event occurs, you need to notify N'noe number of recipients about it, and the contents of the push are personalized. A pack of pushups is formed for each recipient (for all attached devices) and is added to the send queue.
A gun should get these pushes from there, send it to the right place, and update the statistics.
From the queues, you can only get through the external API, which gives packs of pushes only for the requested platforms (this will be needed later). All platforms handles one process, distributing the pushes by handlers who already know what to do with their type and how.
')
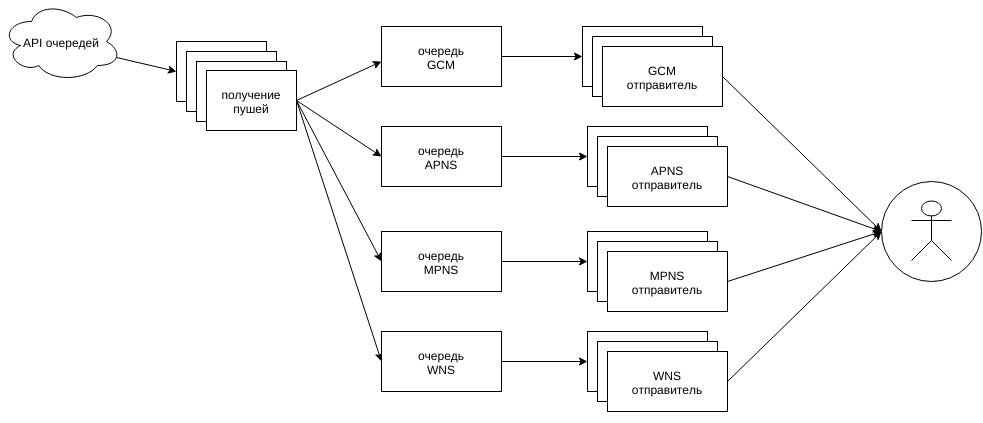
The scheme is simplified: the corresponding number of links should go to and from the grouped blocks, and not like on the diagram one by one.
Getting push from API
Since the only way to get push is an external API with access via HTTPS, the receiving works simply via http.Client with an increased MaxIdleConnsPerHost to support keep-alive. Several gorutin, sharing this common http.Client, constantly knocking on the API for a fresh pack of pushes. If a full pack arrives (about 1-3k pushing) - the next request leaves immediately, if it is much less than they wanted - the request leaves with a short pause.
Here we catch two birds with one stone: we give queues to accumulate, or, if the problem is in the external node that started to slow down, we reduce the load on it. If the requests do not pass at all, or freeze, then after a certain period (about a couple of minutes), close all connections and create a new http.Client object.
As a result, we obtain a constant stream of fresh data for processing, distributed over the target platform to the appropriate queues (normal buffered channels).
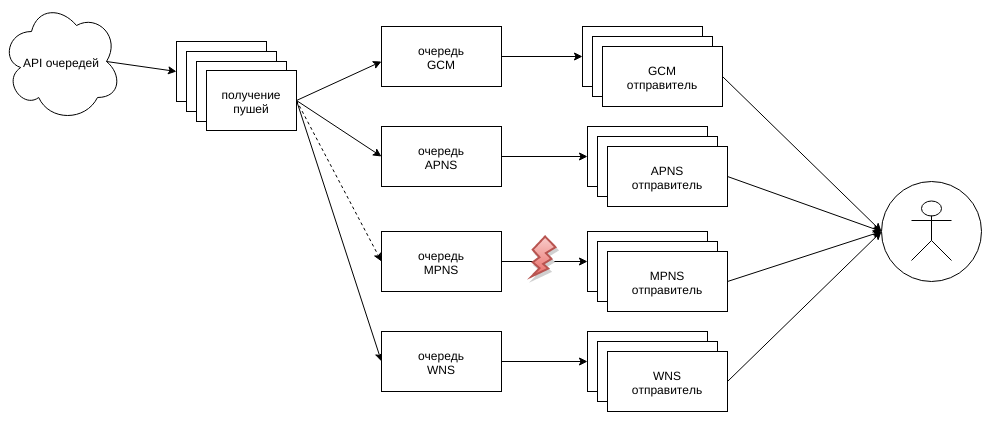
At the same time, the queues are monitored, and if what queue gets clogged up very much (more than 50%), then the dispatcher stops requesting this type from the API.
Shippers push
The logic of pushing pushes varies between platforms, but somehow they implement a common interface that unites them into pools of workers.
The size of these pools is controlled by the general connection manager, which monitors the size of the channels received by the push. When the occupancy is exceeded in excess of 10% of the capacity of the channels, the manager expands the pool to the extent allowed in the config for the specific platform and mobile application registered as the recipient of the push.
The more valuable the application is, the more it can be :) This would not have happened if it had not been necessary to send out pushes to a bunch of various third-party applications, yes, not all of whom follow their certificates and current registration of applications.
Increasing the capacity of pools is performed in steps (not one at a time, but in batches), with a minimum time between two extensions, so that the newly created ones can enter the working rhythm. In the config, the maximum limits are very high, in case of massive problems (somehow, ~ 80% of the tillers managed to break down before delivery delays started, as the others pulled more than their limits on themselves).
We need a lot of connections, and it was not done without increasing the umilit -n to a level of> 10k descriptors. Well, in Go, we tighten the limits right up to the allowed maximum, something like this:
var rLimit syscall.Rlimit if err := syscall.Getrlimit(syscall.RLIMIT_NOFILE, &rLimit); err != nil { return nil, err } if rLimit.Cur < rLimit.Max { rLimit.Cur = rLimit.Max syscall.Setrlimit(syscall.RLIMIT_NOFILE, &rLimit) } The common channel of a specific target platform (gcm, etc.) is divided into multiple channels (and pools of workers for their processing) for each application registered with us. Special gorutiny scatter the incoming flow of push through the channels of specific applications, until one of them begins to get clogged. This is where the scaling of pools comes in, restocking the workers for a particular application. If there is no place to grow, then there are two options: a problem with a critical application for us or not.
In the case of an important application, we simply stop quitting the incoming channel of the push, it starts to get clogged up, as the workers receive the push from the API, and simply remove the specific platform from their requests. And the pushes are either redistributed along other fluffs, or the queue begins to grow, and this is already visible in the monitoring.
And if the application is not particularly important, and the limits for it are exhausted, then alas, the fluffs will be discarded without processing (but these drops will appear in the statistics).
Internal statistics are also kept (within the application) by the number of problems with specific applications (certificate curves, server connection drops, timeouts when sending, etc.) and if the patience cup is exceeded, such applications get a temporary ban - all push files are discarded without processing all the time of action ban.
This is a very useful feature for the case of third-party applications-one-day or unexpectedly popular applications that do not have normal certificates, and they generate more limits on target platforms. There were cases when we ourselves wrote to the representatives of these applications and hinted to them that it would be good for them to finish this part in order to receive pushy normally.
And, of course, you need to do everything in the name of keep-alive and certificate caching, otherwise the application will instantly be a stake, because there will always be interaction errors and there will be no way to reconnect.
All workers have internal re-send buffers in case of failure, which we consider not fatal (request timeout, or 502 response code, for example). It looks like this:
for { select { case push := <-mainChan: send(push) case push := <-resendChan: send(push) default: // ... } } func send(push Push) { if !doSmth(push) { resendChan <- push } } Due to the absence of a guarantee in the order of choosing from several options in select, we obtain an alternate selection of both channels. Above this, there are still limits on the number of re-shipments, timeouts before re-shipments, but this is already beyond the scope of the material.
APNS

Most of all (for the time being?), Work differs in fluffs for apple products, where communication with the remote side occurs via tls connection with sending binary packages.
According to the documentation, an error message (if such an error occurred, for example, an old authorization or an incorrectly formed request) should arrive at the same connection later.
Since waiting for a response (which is usually not) for each request is too slow, then you have to put all the sent pushes and a little extra information into separate lists of sent, but not confirmed pushes (using list.List). And wait for an answer. How long to wait is also not very clear. In this case, the waiting time is selected in 2 seconds (less, it happened, was not enough).
When we receive a response, we will know the push identifier (transmitted with each packet) with which some error occurred, or all is well (yes. There is such an answer). Accordingly, all the pushes to the specified can be considered confirmed in the delivery, specifically this push is discarded or sent again. All pushes after the specified one remain in the list until the next error message, or after a timeout. Pushes that have lain in the queue for more than 2 seconds are considered “timed out”.
Plus, there is also a separate connection with Apple servers, through which incoming packets with data on "unsubscribing" applications arrive to us. It is processed by a separate gorutinka, one for each client application.
As a result, we get an endless shifting of push between the receiving channels, the queues of unconfirmed and re-resending (it can occur many times for each push).
To this we can add that sometimes errors come that are not described in the documentation. Or (most popular) the connection is broken without any error notification. Beauty is the same)
The implementation pumps approximately (this is only the number of delivered or discarded, not all) 1.4 billion apns of push a day (~ 30k-33k per second during peaks) on a laptop with a mobile i7-4500U processor (in the name of tests, of course).
But, as I recently learned, Apple plans to implement the scheme, like others - through http requests. We'll see.
GCM
The most adequate platform. The logic of the workers was literally written in 1-2 days and since then has simply worked. We create http.Client with MaxIdleConnsPerHost more (a few thousand), and send POST requests. Servers respond quickly, the documentation is good - beauty. At peak times, it comes close to 100k pushes per second.
I did not try the XMPP option, but there will be time, I will try. Although, "it works - do not touch".
MPNS, WNS

This is the worst of all options, especially MPNS. Then you have to wait for a response for 1-2 seconds (there are simply no words!), And getting the setracks instead of xml with an error (and this is after waiting for those 1-2 seconds).
sample response pieces
<! DOCTYPE html> \ r \ n <html> \ r \ n <head> \ r \ n <title> Insufficient memory of the program. <\ / Title> \ r \ n
...
OutOfMemoryException: System.CodeDom.Compiler.Executor.ExecWaitWithCaptureUnimpersonated (SafeUserTokenHandle userToken, String cmd, String currentDir, TempFileCollection tempFiles, String & TempTileCollection tempFiles, StF & TempTile, TempDile, TempFileCollection tempFiles, String & TempTile CMD, String currentDir, TempFileCollection tempFiles, String & String cmd, String currentDir, TempFileCollection tempFiles, String & String cmd \ r \ n
...
This is an error page that has been configured to show verbose error messages using <customErrors mode = \ "Off \" \ />. Consider using <customErrors mode = \ "On \" \ /> or <customErrors mode = \ "RemoteOnly \" \ /> in production environments.
...
...
OutOfMemoryException: System.CodeDom.Compiler.Executor.ExecWaitWithCaptureUnimpersonated (SafeUserTokenHandle userToken, String cmd, String currentDir, TempFileCollection tempFiles, String & TempTileCollection tempFiles, StF & TempTile, TempDile, TempFileCollection tempFiles, String & TempTile CMD, String currentDir, TempFileCollection tempFiles, String & String cmd, String currentDir, TempFileCollection tempFiles, String & String cmd \ r \ n
...
This is an error page that has been configured to show verbose error messages using <customErrors mode = \ "Off \" \ />. Consider using <customErrors mode = \ "On \" \ /> or <customErrors mode = \ "RemoteOnly \" \ /> in production environments.
...
Worst of all, sometimes this answer does not mean that the push was not accepted and delivered. And re-sending from our side leads to the arrival on the device of two identical pushi. And as it turns out, people are more upset by two pushing than their absence in principle.
Separately, it is worth telling about TLS Renegotiation, which is required for sending with a certificate (without it, you quickly rest against the limits on sending), but it is not supported in Go, and generally it is drunk everywhere.
For this you have to send a push through the cgo wrapper over curl. But the solution is so-so on stability - every few million requests there is a chance to catch sigsegv somewhere inside the system library. To work around this problem, working with curl through cgo was moved to a separate small (~ 400 lines) application for the same Go, operating on the principle: gun => "http server => https curl tls renego client" => MS server.
Such applications run a separate small pool with its manager, monitor the fall. These intermediate proxies respond to the main button with the response of external servers, as well as add grit to the headers for debugging and statistics: response time, proxy response code (in addition to the response code of the external server), and so on. All this makes it possible to quite reliably send fluffs in an unstable environment.
By the way, instead of MaxIdleConnsPerHost, we don’t forget to set CURLOPT_MAXCONNECTS more, otherwise we will not take off again on the CPU.
But it is in this platform that the text of the push and the badge (the number of the application icon) must be set by two different independent requests (and in WNS by three). Feel free to multiply the above seconds of waiting and glitches by two (three) and move on ...
Statistics collection
No matter how it all works, you need statistics. And the more detailed the better.
It monitors both the queue filling code (the one before the API), the work of the API methods, and the mailing applications themselves.
The main characteristic is the dispatch time: how long does it take from the moment of pushing to the confirmed dispatch to the server of a specific site? For fast GCM and APNS, the average time goes about 60-100ms for the entire processing path, for MPNS / WNS, how lucky: we cannot send MS servers faster than the MS servers work.
Statistics are kept on:
- the number of sent, dropped, returned error when sending, with overdue authorizations (they also need to send the tokens themselves, and drop them while they are still in the send queues, and not to try to send-receive the error again — reinstall the connection);
- processing time: min / max / avg for each platform and each application separately;
- uptime of the process, use of cpu (divided by user, system, io, idle), number of open file descriptors, memory consumption (rss), time for running gc in total and min / max / avg of recent launches.
All this is collected and sent in batches all in the same API.
However, it is extremely expensive to keep statistics on each push from each mountain (and there are many thousands of them) in one place. Therefore, all workers collect their statistics first locally at home, and only occasionally (every few seconds) merge it into a common place. Sample code:
type Stats struct { sync.RWMutex ElapsedTime ... Methods ... AppID ... ... } addStatsTicker := time.Tick(5 * time.Second) for { select { case <-addStatsTicker: globalStats.Lock() gcm.stats.Lock() mergeStatsToGlobal(&gcm.stats) cleanStats(&gcm.stats) gcm.stats.Unlock() globalStats.Unlock() case push := <-mainChan: // , gcm.stats.Lock() statsMethodIncr(&gcm.stats, push.Method) statsAppIDIncr(&gcm.stats, push.AppID) gcm.stats.Unlock() send(push) // ... } } Selective logging
In addition to the general statistics, the guns allow you to log all key steps in the processing of selective guns.

If a push comes from the queue with special flags, then all actions for processing this push are sent to the debug channel of the logger, which sends these logs to the API. Not only the success / error facts are collected, but also all the important details: key branches for selection, values of variables and buffers, exact time with millisecond accuracy. All this makes it possible to quite accurately understand what went wrong along with these logs themselves in case of problems like “I didn’t have someone pushing yesterday at such a time,” “two of them came,” and so on.
This is all in addition to the “local” logs, which generally do not leave the limits of the machine on which the gun is running.
Something like that. All this works on many tens of thousands of gorutin without any problems, and it's cool)
PS A lot of things left behind the scenes, maybe later ...
PPS Pictures of gophers taken from here .
Source: https://habr.com/ru/post/265731/
All Articles