Getting Started with Intel Energy Profiler for Android
If a certain application consumes more energy than a competing one, users will notice it very soon and make the appropriate choice. Therefore, it is vital for each developer to ensure that their programs are sensitive to the batteries of tablet PCs and smartphones. The tools included in Intel System Studio can help in this important endeavor.

Intel VTune Amplifier for specialized systems allows you to optimize the power consumption of applications designed for embedded Linux platforms for the Android and Windows operating systems. This is done thanks to the analysis that is carried out using the Intel Energy Profiler.
Having dealt with energy consumption, you can identify application scenarios that waste battery power. The end result of the analysis is code optimization and a significant increase in the lifetime of the device from a single charge.
')
Intel Energy Profiler allows you to monitor how the device operates in low-power modes and analyze the reasons for exiting these modes. The profiler is able to help in the study of changes in the processor clock frequency. It also helps to identify the problems of power consumption of the system. In addition, data visualization is supported, which allows you to quickly see and evaluate improvements made to reduce energy consumption.
This paper discusses the energy profiling process on the target Android platform using the tools included in the Intel System Studio installed on a Windows computer. The material also includes comments about the features of working with the system, which is installed on the OS Linux. A system installed on a Mac OS will work in a similar way, however, we have not performed experiments on a Mac. Copies of the screen, which are available in the article, were made on a computer with Windows OS installed.
Several components are responsible for working with Android devices in Energy Profiler.
The first is the Android kernel level drivers, which require a system permission level. Best of all, if these drivers were assembled with the kernel and are already present on the device. So you can be sure that they have the necessary permissions.
The next component is a low-level application that interacts with drivers. You can work with the application via the command line. In particular - to collect data from the device. This application is commonly referred to as the Intel SoC Watch data collector. It is accessed using the socwatch command, the collector can be installed on the device using an ADB script.
And finally, a data visualization component that is built into the Intel VTune Amplifier user interface. It is quite acceptable to collect energy analysis data using the Intel SoC Watch via the command line and process the information manually without using the Intel VTune Amplifier graphical tools. That is why many of the papers on energy optimization, says only about "Intel SoC Watch", but not about "Intel Energy Profiler".
In order to find out whether the required driver is installed on the device you are going to work with, as well as which version of the data collection tool you need, you need to open the adb shell and check if there is a / lib / modules / or / directory in system / lib / modules / SOCWATCHx_x.ko driver file.

An example of checking the device for SOCWATCH driver
After checking, it turned out that on the device that we use in this example, the driver is already included in the system image. It is located at /lib/modules/SOCWATCH1_3.ko. The name of the driver file allows us to understand which version of Intel SoC Watch should be used for data collection. This is version 1.3.
If it turned out that the file name looks like SOCWATCH1_5.ko, we would have to use the Intel SoC Watch version 1.5. Note that in Android Lollipop, the driver will most likely be located in the / system / lib / modules folder. However, on this version of Android it is worth checking both folders. For example, on an Asus Fonepad 8 tablet computer with an Intel Atom Z3530 CPU updated to Android 5.0, the driver was found in the / lib / modules / folder.
If the required driver cannot be found in the system, it must be included in the kernel during the build. This is beyond the scope of this article. Useful information on this topic can be found in the user manual, in the "Building the Kernel Modules" section. Below we will tell about where you can find this guide. Special attention should be paid to the fact that the driver had the same signature as the system core, or - it should be possible to provide the driver with system-level permissions.
Now, when, after checking the driver, it became clear which version of the data collection application to use, it was time to install this application on the device. Please note that the installation of the application on each analyzed device needs to be performed only once.
Locate the file system_studio_target.tgz. It is located in the Intel System Studio installation folder. The path to the directory where it is located may look like <ISS_install_dir> / Targets. Here <ISS_install_dir> is the folder where System Studio is installed. For Windows, this is usually "C: \ Program Files (x86) \ Intel \ System Studio yyyy.x.xxx". On Linux, “opt / intel / system_studio_yyyy.x.xxx”.
Here, yyyy.x.xxx is the version number of the suite of installed applications. The above .tgz archive contains files that are needed for host systems running Windows or Linux. The archive should be unpacked somewhere where it will be easy to find its contents. In our case, it was unpacked into the “C: \ Users \ Public \ ISS-2015_SoCWatch” directory.
If you are already using the beta version of Intel System Studio 2016 , the required file can be found at “C: \ Program Files (x86) \ Intel_sw_development_tools \ system_studio_2016.x.xxx \ Targets”.
Using the command line, navigate to one of the folders you just unzipped, whose name matches the version of the Intel SoC Watch driver that was previously identified on the device. In our case, this is the “C: \ Users \ Public \ ISS-2015_SoCWatch \ system \ studio \ target \ socwatch_android_v1.3d \” folder.
Please note that in this folder you can find the User Guide, which contains a lot of useful information. Including, here you can find descriptions of options available for a particular version of the data collector and a quick start guide that covers most of what we are talking about here. The manual also contains information on how to analyze the results.
Make sure that the Android device is connected to the computer via USB and run the installation script. When working in Windows, you need to run the batch file socwatch_android_install.bat. On Linux, you will need the shell script socwatch_android_install.sh. If you have already used these scripts, you will see a message that the installation failed. Therefore, if you accidentally installed the wrong version of the Android application, before installing the required version, you will need to delete the / data / socwatch folder from the device using the adb shell. If successful, you will see a list of files copied to the device.
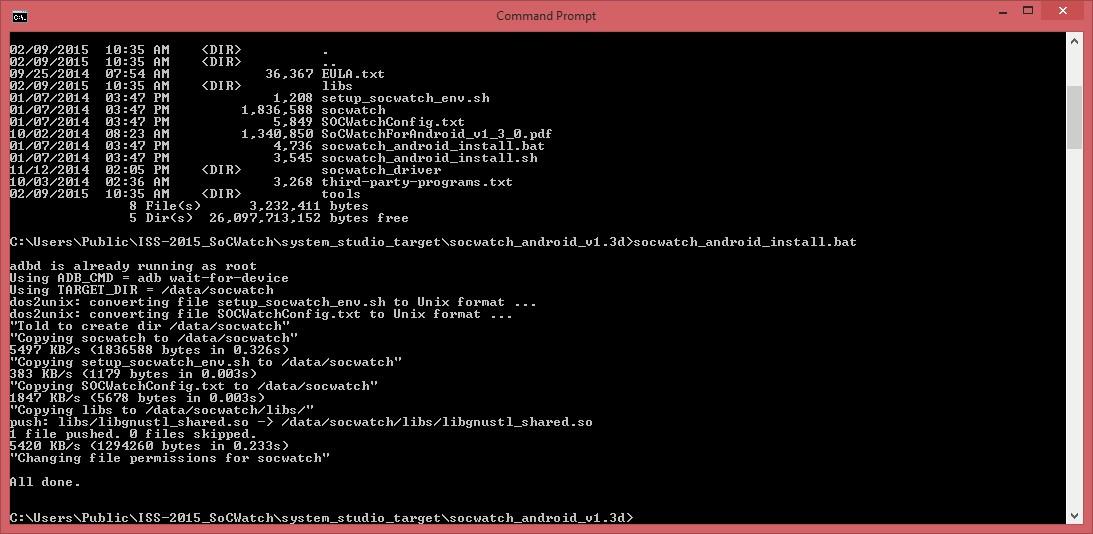
Installing the data collector on the device
Data collection for analysis, in the simplest form of this process, consists of three steps. The first is setting the environment. The second is loading the driver. The third is the launch of a script that collects data.
This step must be performed each time a new ADB connection is made to the device for data collection.
Connect to the device using ADB and go to the / data / socwatch directory. Here you will find the setup_socwatch_env.sh script. Run the script. During its operation, the current environment settings will be displayed on the screen. In addition, among the output data you will see a reminder that you need to load the driver, but we will do this in the next step. And now we need the following commands:
or
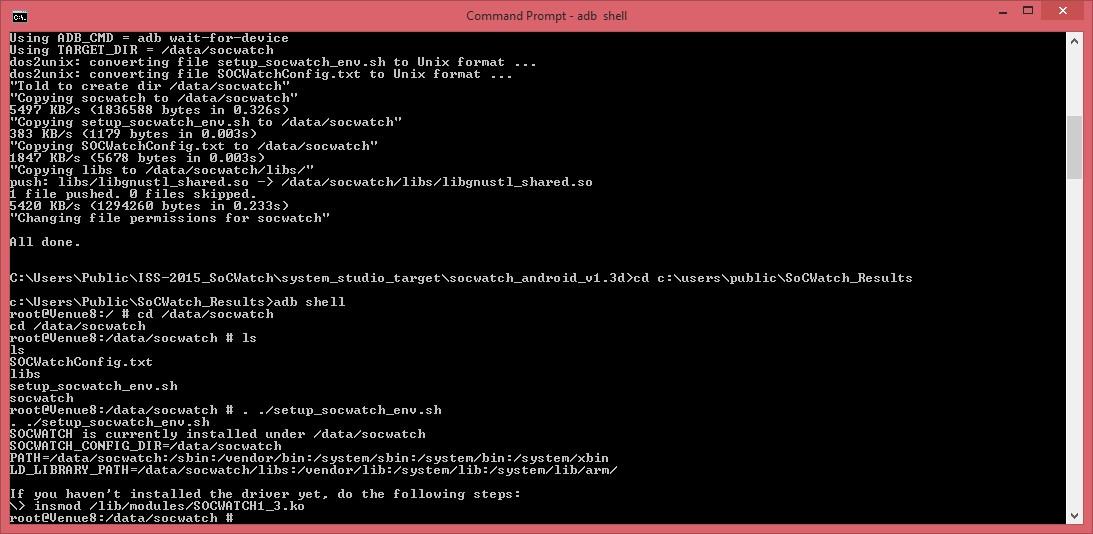
Setting up an environment for data collection using a shell script
This should be done every time before data collection, if the device is rebooted. At the same time, if a new connection is made to the prepared device through the ADB shell, the driver does not need to be downloaded again.
At this step, the driver is loaded into the device’s RAM, which we detected above on the device. This is done using the insmod command. In our example, the driver is located at /lib/modules/SOCWATCH1_3.ko, it is present on the device and can be downloaded for further work. For more confidence, you can check again whether the driver is loaded. This is done using the lsmod command. Here is an example of its use:
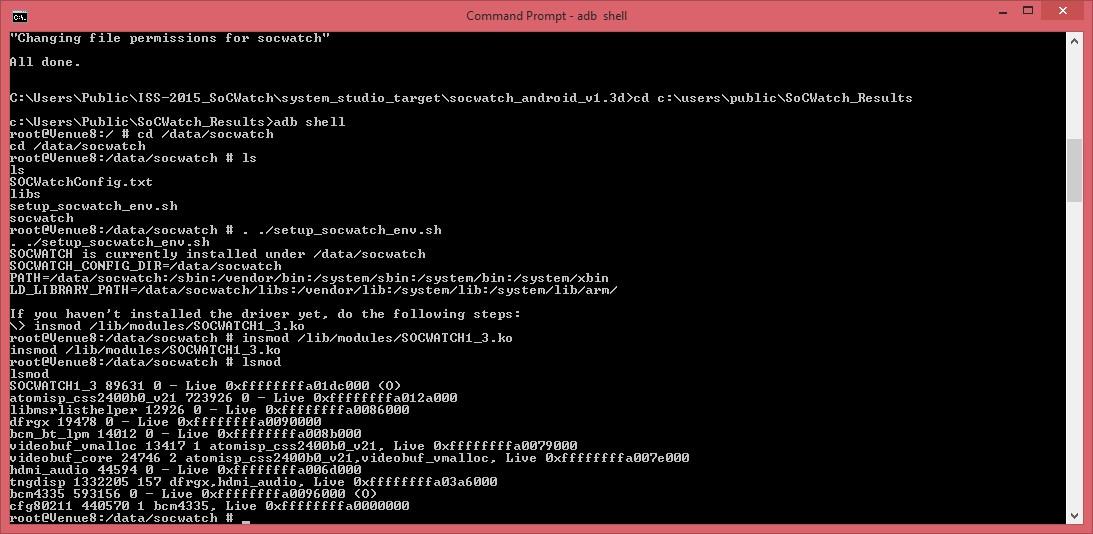
Download and confirm loading of the socwatch driver
Some versions of socwatch require the download of an additional driver (socperf_xxx.ko). Like it or not, it will be indicated after the execution of the script set_socwatch_env.sh.
This step must be performed each time a new file is required with data for analysis. The exact startup parameters will vary depending on the version of the data collector used, on the capabilities of the device and on the required set of information that needs to be collected for analysis. You can get a brief help on working with this tool using the --help parameter. Below is an example of running socwatch.
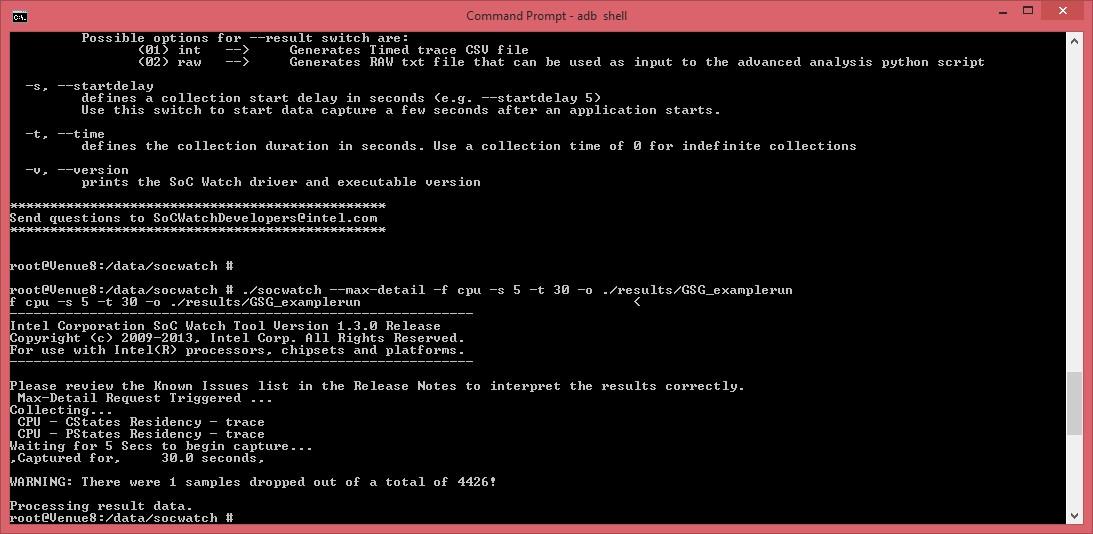
Start data collection
Here, the program collects information about C-states and P-states of the processor core, having waited 5 seconds before starting data collection. Collection is carried out within 30 seconds. The results are displayed in the / data / socwatch / results / folder, with the file names starting with “GSG_examplerun”.
Please note that connecting an Android device to a computer via a USB cable is very likely to affect the power consumption mode of the device. Therefore, the cable is often disconnected immediately after starting the command, but before the start of data collection. This can be done, for example, using the background task and the nohup command. The corresponding command might look like this: “nohup ./socwatch &”. After it is executed, the cable can be disconnected.
It is often highly desirable that data be collected only when executing a particular application. This can be achieved with the socwatch "-p" parameter. Details of this technique can be found in the user manual or by using the key - help.
In order to analyze the collected data using the Intel VTune Amplifier, we will need to go through two more steps. Namely - copy files with the collected data from the device and import them into the application.
In order to copy files from the device, you need to use the command line to go to the computer directory in which you can save these files. It is recommended that this be a folder other than the one in which the Intel VTune Amplifier projects are stored. The fact is that when importing these files will be automatically copied exactly there, so it is best to transfer them from the device to some temporary directory.
If you omit this step and try to go directly to the files on the device (for example, the beginning of the path to them may look like “devicename / internal storage / data”), you will not be able to work with them due to various permissions restrictions.
When you navigate to the temporary directory in the command line to which you want to copy files from the device, use the adb pull command. If you do not remember the exact file names, you can get their list with a command like "adb shell ls / data / socwatch / results". Here are examples of commands with which we copied the necessary files:
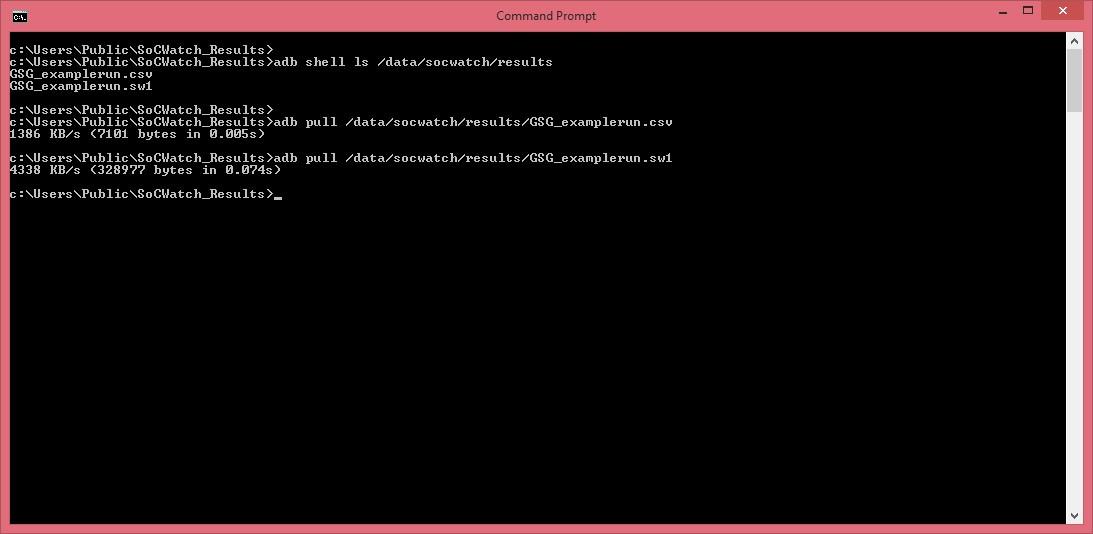
Copying test files to PC
In this step, we need only a file with the .sw1 extension, which was copied from the device. A .csv file (comma separated values) is a text file with results, it can be used as a data source for your own data analysis scripts or other tools.
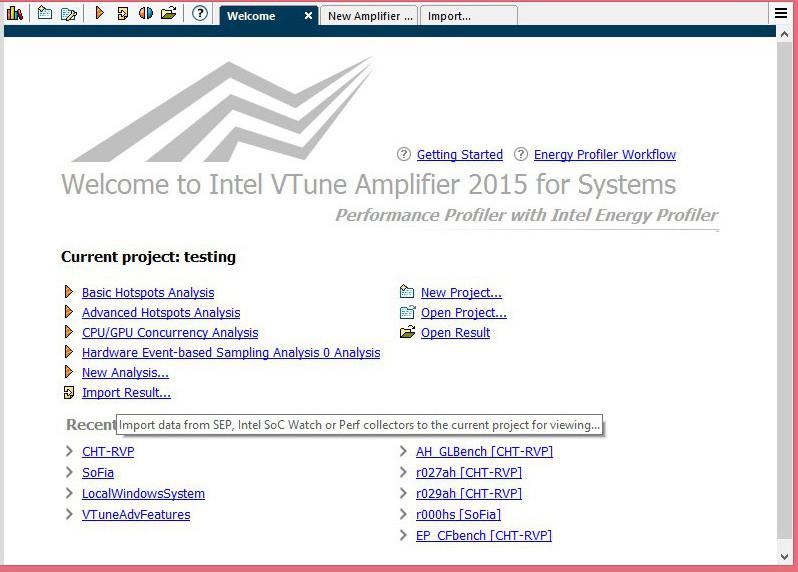
Launch the Intel VTune Amplifier application and download the desired project. If you are not familiar with this product, refer to Getting Started with the Intel VTune Amplifier for Specialized Systems or some similar guide. On the “Welcome” tab, click on the link “Import Result ...”. You can do otherwise - go to the “Energy Analysis” group, which can be found in the “Analysis Type” section on the “New Analysis” tab, and click on “Import Data”.
Please note that the steps above are relevant for Intel System Studio 2015 Update 1 or later. If you are using an earlier version of Intel System Studio, you may need to use the command line tools to import data.
Import data from the Welcome tab

Import data from the analysis type selection screen
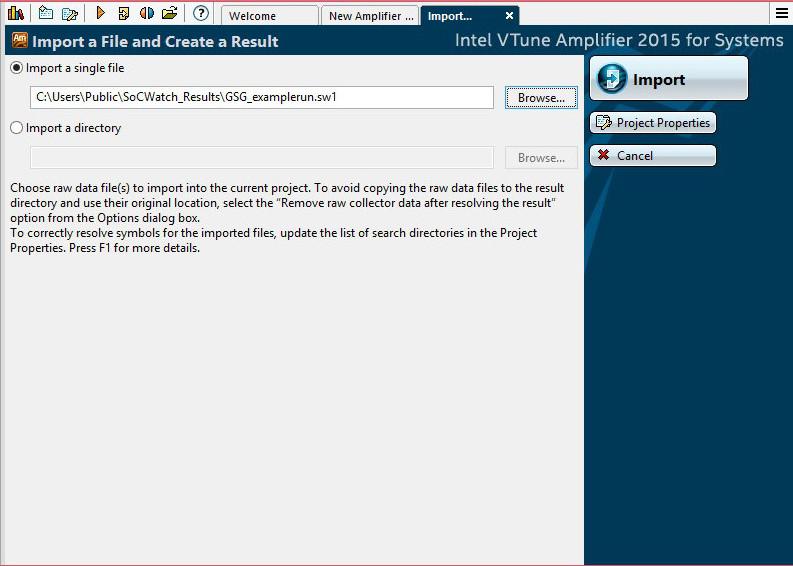
In either case, the next step is the Import a File and Create a Result tab. It will contain a field in which you can specify the path to the .sw1 file copied from the device you want to import into the application.
File Selection Tab for Import
After the file is selected, click on the Import button and observe how the program analyzes and displays data that can be viewed.
What kind of data will be available for analysis is highly dependent on the hardware of the device under test, on the version of the data collector and the command line parameters used in collecting the information.
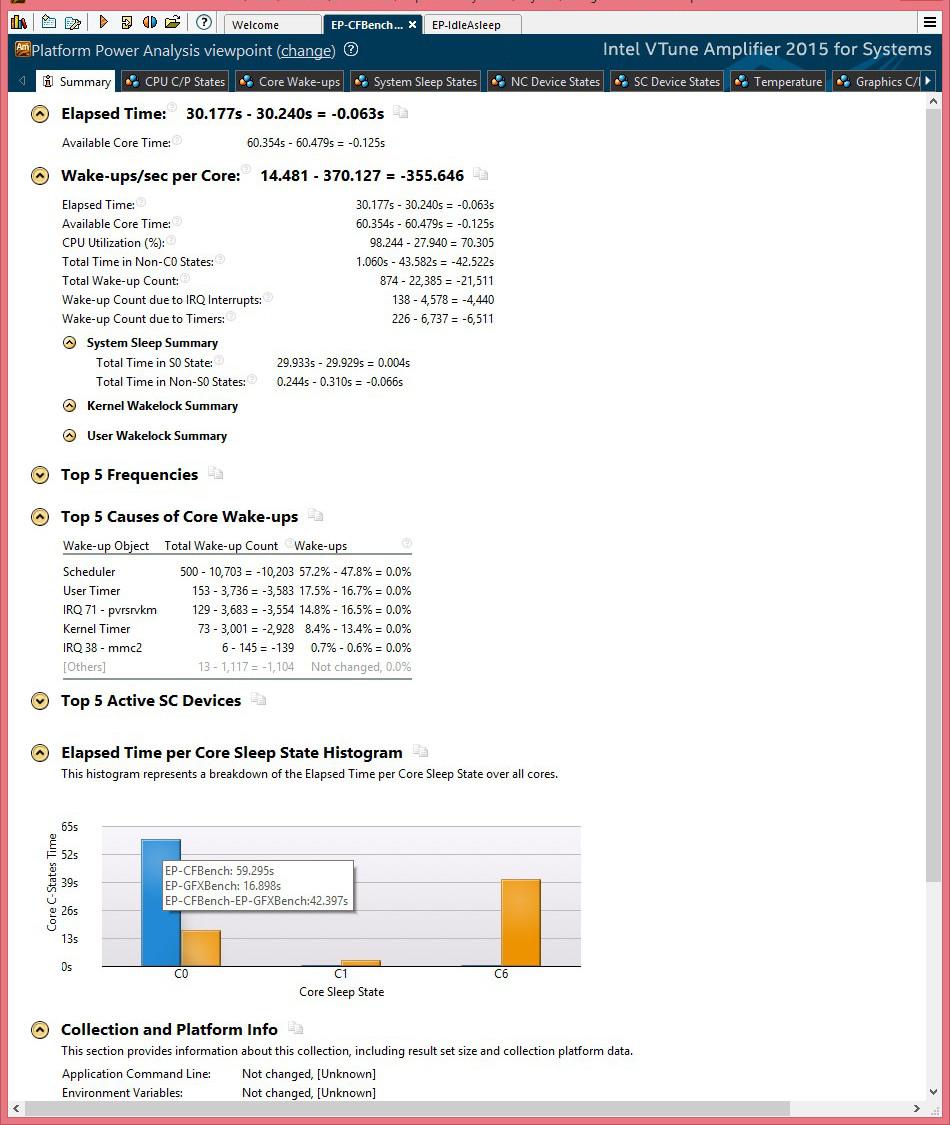
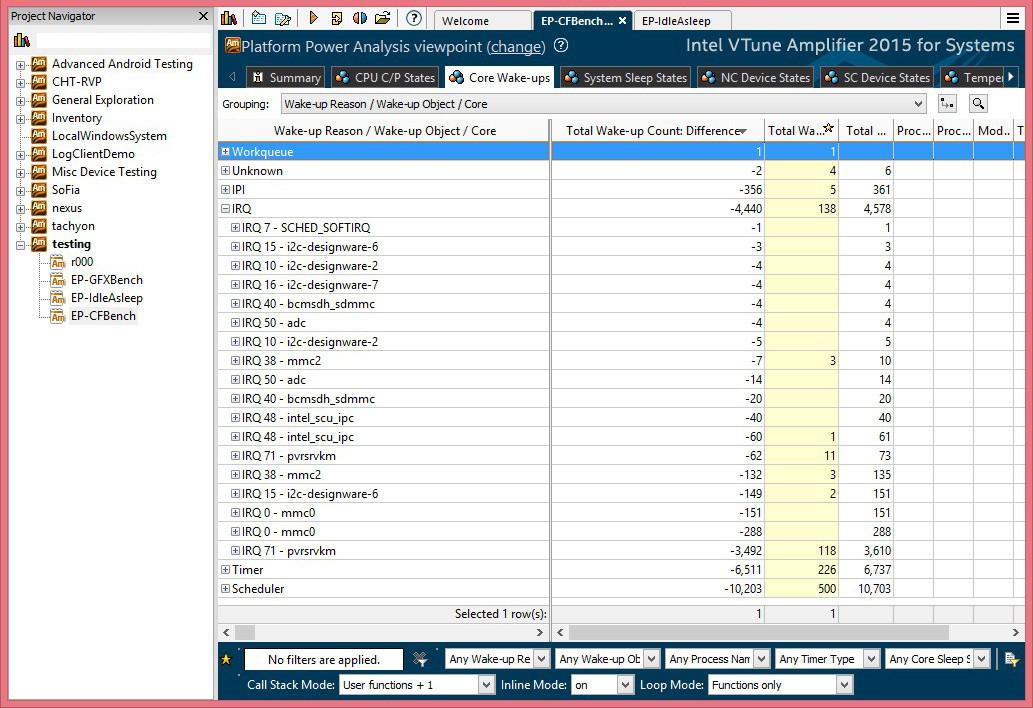
When downloading results, the Platform Power Analysis view will be selected by default (usually there are no other options), the Summary tab will be displayed. On this tab, you can find such useful information as “Elapsed time”, that is, the testing time and the processor cores (usually the number of cores multiplied by the testing time). Here there is information about events (events per second per core), which lead to the exit of the processor from low power mode. On the same tab, you can find information about the frequency of active nuclei and the causes of events that "awaken" them.
Here is an example of analyzing the data obtained after using this command:
The device was connected to the computer via a USB cable, was in locked mode, the screen was turned off. As expected, the results indicate that it consumed very little energy.
Data on the device that was in sleep mode
Another useful tab is Correlate Metrics. Here you can see the time layout for various states and events. Here you can easily zoom in the view of the desired period of time and explore the exact time frame of events and how they relate to each other. In addition, note that if you hold the mouse pointer over the area you are interested in for a while, you can see a pop-up message with more detailed information. This moment is shown in the following figure.
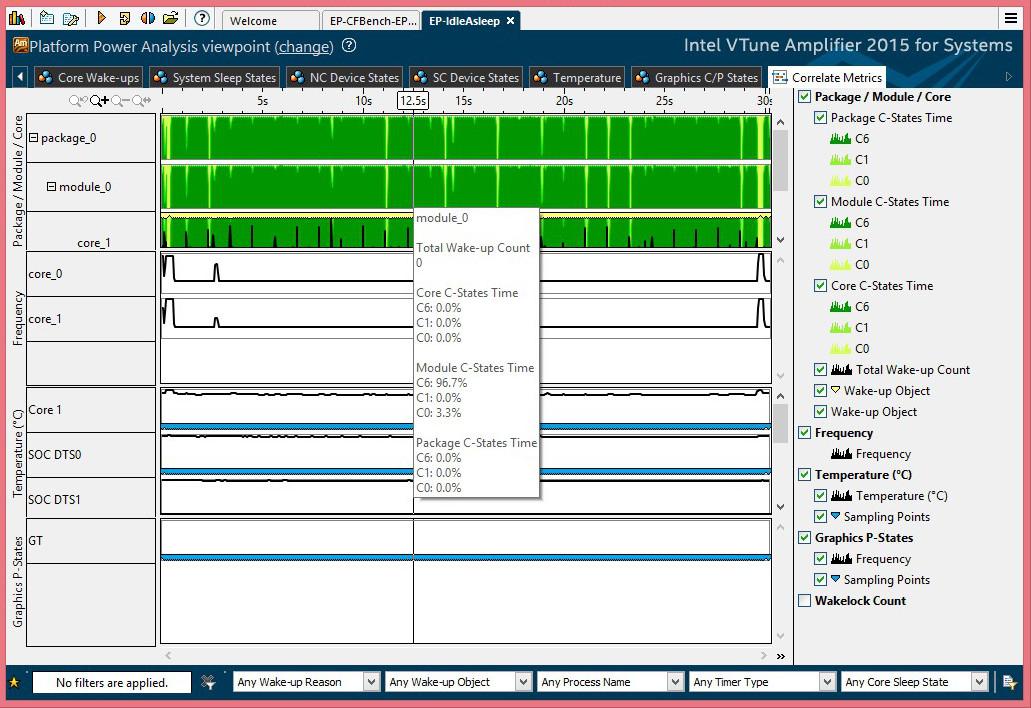
View data on the System Correlate Metrics tab
If necessary, you can compare the results of two tests in the same window. For example, such a technique makes it easy to compare the results of two data collections performed with the same conditions. This is done in order to check whether there are any improvements, or to make sure that the results obtained earlier can be reproduced.
To compare the results of the two tests, you first need to separately import both data sets into the application, then close their data analysis tabs. In this step, it is recommended to rename the analysis results in the “Project Navigator” window in order to make it easier to work with them, but this is not necessary. Then you need to use the “Compare Results” icon and specify which analysis results should be compared. The application will show both sets of analytical data in one window, where they can be compared. Here is an example of comparing two sets of data obtained from various tests.
Comparison of several test results: general information
Comparison of the results of several tests: the reasons for the processor to exit the low-power mode
We looked at an example of using Intel System Studio tools to analyze the power consumption of devices running on the Android platform. Now you have everything you need to start analyzing and optimizing your applications.
» Intel VTune Amplifier 2015 Documentation
» Optimization and Productivity Guides
Overview
Intel VTune Amplifier for specialized systems allows you to optimize the power consumption of applications designed for embedded Linux platforms for the Android and Windows operating systems. This is done thanks to the analysis that is carried out using the Intel Energy Profiler.
Having dealt with energy consumption, you can identify application scenarios that waste battery power. The end result of the analysis is code optimization and a significant increase in the lifetime of the device from a single charge.
')
Intel Energy Profiler allows you to monitor how the device operates in low-power modes and analyze the reasons for exiting these modes. The profiler is able to help in the study of changes in the processor clock frequency. It also helps to identify the problems of power consumption of the system. In addition, data visualization is supported, which allows you to quickly see and evaluate improvements made to reduce energy consumption.
Target platform and host system
This paper discusses the energy profiling process on the target Android platform using the tools included in the Intel System Studio installed on a Windows computer. The material also includes comments about the features of working with the system, which is installed on the OS Linux. A system installed on a Mac OS will work in a similar way, however, we have not performed experiments on a Mac. Copies of the screen, which are available in the article, were made on a computer with Windows OS installed.
Check for required drivers
Several components are responsible for working with Android devices in Energy Profiler.
The first is the Android kernel level drivers, which require a system permission level. Best of all, if these drivers were assembled with the kernel and are already present on the device. So you can be sure that they have the necessary permissions.
The next component is a low-level application that interacts with drivers. You can work with the application via the command line. In particular - to collect data from the device. This application is commonly referred to as the Intel SoC Watch data collector. It is accessed using the socwatch command, the collector can be installed on the device using an ADB script.
And finally, a data visualization component that is built into the Intel VTune Amplifier user interface. It is quite acceptable to collect energy analysis data using the Intel SoC Watch via the command line and process the information manually without using the Intel VTune Amplifier graphical tools. That is why many of the papers on energy optimization, says only about "Intel SoC Watch", but not about "Intel Energy Profiler".
In order to find out whether the required driver is installed on the device you are going to work with, as well as which version of the data collection tool you need, you need to open the adb shell and check if there is a / lib / modules / or / directory in system / lib / modules / SOCWATCHx_x.ko driver file.
An example of checking the device for SOCWATCH driver
After checking, it turned out that on the device that we use in this example, the driver is already included in the system image. It is located at /lib/modules/SOCWATCH1_3.ko. The name of the driver file allows us to understand which version of Intel SoC Watch should be used for data collection. This is version 1.3.
If it turned out that the file name looks like SOCWATCH1_5.ko, we would have to use the Intel SoC Watch version 1.5. Note that in Android Lollipop, the driver will most likely be located in the / system / lib / modules folder. However, on this version of Android it is worth checking both folders. For example, on an Asus Fonepad 8 tablet computer with an Intel Atom Z3530 CPU updated to Android 5.0, the driver was found in the / lib / modules / folder.
If the required driver cannot be found in the system, it must be included in the kernel during the build. This is beyond the scope of this article. Useful information on this topic can be found in the user manual, in the "Building the Kernel Modules" section. Below we will tell about where you can find this guide. Special attention should be paid to the fact that the driver had the same signature as the system core, or - it should be possible to provide the driver with system-level permissions.
Installing a data collection application
Now, when, after checking the driver, it became clear which version of the data collection application to use, it was time to install this application on the device. Please note that the installation of the application on each analyzed device needs to be performed only once.
Locate the file system_studio_target.tgz. It is located in the Intel System Studio installation folder. The path to the directory where it is located may look like <ISS_install_dir> / Targets. Here <ISS_install_dir> is the folder where System Studio is installed. For Windows, this is usually "C: \ Program Files (x86) \ Intel \ System Studio yyyy.x.xxx". On Linux, “opt / intel / system_studio_yyyy.x.xxx”.
Here, yyyy.x.xxx is the version number of the suite of installed applications. The above .tgz archive contains files that are needed for host systems running Windows or Linux. The archive should be unpacked somewhere where it will be easy to find its contents. In our case, it was unpacked into the “C: \ Users \ Public \ ISS-2015_SoCWatch” directory.
If you are already using the beta version of Intel System Studio 2016 , the required file can be found at “C: \ Program Files (x86) \ Intel_sw_development_tools \ system_studio_2016.x.xxx \ Targets”.
Using the command line, navigate to one of the folders you just unzipped, whose name matches the version of the Intel SoC Watch driver that was previously identified on the device. In our case, this is the “C: \ Users \ Public \ ISS-2015_SoCWatch \ system \ studio \ target \ socwatch_android_v1.3d \” folder.
Please note that in this folder you can find the User Guide, which contains a lot of useful information. Including, here you can find descriptions of options available for a particular version of the data collector and a quick start guide that covers most of what we are talking about here. The manual also contains information on how to analyze the results.
Make sure that the Android device is connected to the computer via USB and run the installation script. When working in Windows, you need to run the batch file socwatch_android_install.bat. On Linux, you will need the shell script socwatch_android_install.sh. If you have already used these scripts, you will see a message that the installation failed. Therefore, if you accidentally installed the wrong version of the Android application, before installing the required version, you will need to delete the / data / socwatch folder from the device using the adb shell. If successful, you will see a list of files copied to the device.
Installing the data collector on the device
Data collection
Data collection for analysis, in the simplest form of this process, consists of three steps. The first is setting the environment. The second is loading the driver. The third is the launch of a script that collects data.
Setting up the environment
This step must be performed each time a new ADB connection is made to the device for data collection.
Connect to the device using ADB and go to the / data / socwatch directory. Here you will find the setup_socwatch_env.sh script. Run the script. During its operation, the current environment settings will be displayed on the screen. In addition, among the output data you will see a reminder that you need to load the driver, but we will do this in the next step. And now we need the following commands:
source ./setup_socwatch_env.sh or
. ./setup_socwatch_env.sh Setting up an environment for data collection using a shell script
Driver loading
This should be done every time before data collection, if the device is rebooted. At the same time, if a new connection is made to the prepared device through the ADB shell, the driver does not need to be downloaded again.
At this step, the driver is loaded into the device’s RAM, which we detected above on the device. This is done using the insmod command. In our example, the driver is located at /lib/modules/SOCWATCH1_3.ko, it is present on the device and can be downloaded for further work. For more confidence, you can check again whether the driver is loaded. This is done using the lsmod command. Here is an example of its use:
insmod /lib/modules/SOCWATCHx_y.ko Download and confirm loading of the socwatch driver
Some versions of socwatch require the download of an additional driver (socperf_xxx.ko). Like it or not, it will be indicated after the execution of the script set_socwatch_env.sh.
Running a script to collect data
This step must be performed each time a new file is required with data for analysis. The exact startup parameters will vary depending on the version of the data collector used, on the capabilities of the device and on the required set of information that needs to be collected for analysis. You can get a brief help on working with this tool using the --help parameter. Below is an example of running socwatch.
./socwatch --max-detail -f cpu -s 5 -t 30 -o ./results/GSG_examplerun Start data collection
Here, the program collects information about C-states and P-states of the processor core, having waited 5 seconds before starting data collection. Collection is carried out within 30 seconds. The results are displayed in the / data / socwatch / results / folder, with the file names starting with “GSG_examplerun”.
Please note that connecting an Android device to a computer via a USB cable is very likely to affect the power consumption mode of the device. Therefore, the cable is often disconnected immediately after starting the command, but before the start of data collection. This can be done, for example, using the background task and the nohup command. The corresponding command might look like this: “nohup ./socwatch &”. After it is executed, the cable can be disconnected.
It is often highly desirable that data be collected only when executing a particular application. This can be achieved with the socwatch "-p" parameter. Details of this technique can be found in the user manual or by using the key - help.
Visualizing Results with VTune Amplifier
In order to analyze the collected data using the Intel VTune Amplifier, we will need to go through two more steps. Namely - copy files with the collected data from the device and import them into the application.
Copy files from device
In order to copy files from the device, you need to use the command line to go to the computer directory in which you can save these files. It is recommended that this be a folder other than the one in which the Intel VTune Amplifier projects are stored. The fact is that when importing these files will be automatically copied exactly there, so it is best to transfer them from the device to some temporary directory.
If you omit this step and try to go directly to the files on the device (for example, the beginning of the path to them may look like “devicename / internal storage / data”), you will not be able to work with them due to various permissions restrictions.
When you navigate to the temporary directory in the command line to which you want to copy files from the device, use the adb pull command. If you do not remember the exact file names, you can get their list with a command like "adb shell ls / data / socwatch / results". Here are examples of commands with which we copied the necessary files:
adb pull /data/socwatch/results/GSG_examplerun.csv adb pull /data/socwatch/results/GSG_examplerun.sw1 Copying test files to PC
Import data into VTune for further analysis.
In this step, we need only a file with the .sw1 extension, which was copied from the device. A .csv file (comma separated values) is a text file with results, it can be used as a data source for your own data analysis scripts or other tools.
Launch the Intel VTune Amplifier application and download the desired project. If you are not familiar with this product, refer to Getting Started with the Intel VTune Amplifier for Specialized Systems or some similar guide. On the “Welcome” tab, click on the link “Import Result ...”. You can do otherwise - go to the “Energy Analysis” group, which can be found in the “Analysis Type” section on the “New Analysis” tab, and click on “Import Data”.
Please note that the steps above are relevant for Intel System Studio 2015 Update 1 or later. If you are using an earlier version of Intel System Studio, you may need to use the command line tools to import data.
Import data from the Welcome tab
Import data from the analysis type selection screen
In either case, the next step is the Import a File and Create a Result tab. It will contain a field in which you can specify the path to the .sw1 file copied from the device you want to import into the application.
File Selection Tab for Import
After the file is selected, click on the Import button and observe how the program analyzes and displays data that can be viewed.
Interpretation of results
What kind of data will be available for analysis is highly dependent on the hardware of the device under test, on the version of the data collector and the command line parameters used in collecting the information.
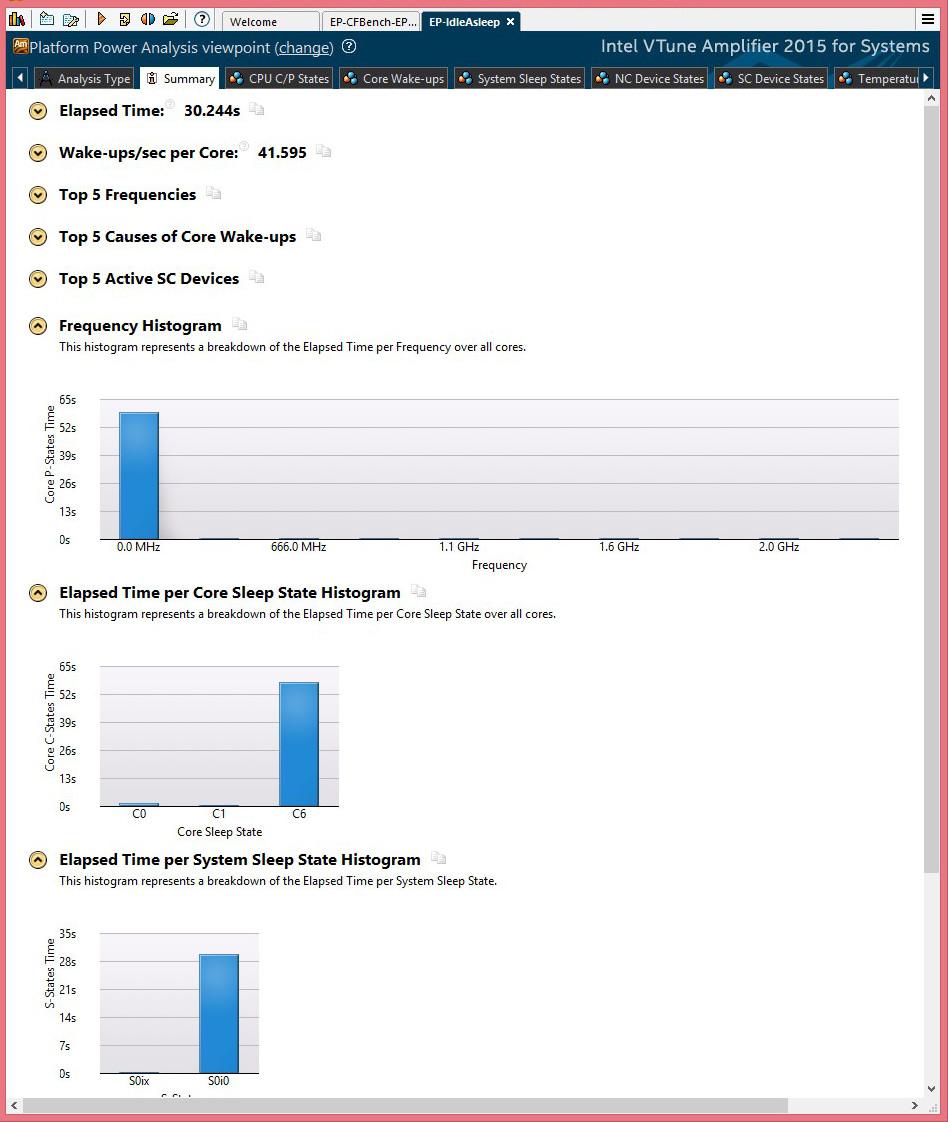
When downloading results, the Platform Power Analysis view will be selected by default (usually there are no other options), the Summary tab will be displayed. On this tab, you can find such useful information as “Elapsed time”, that is, the testing time and the processor cores (usually the number of cores multiplied by the testing time). Here there is information about events (events per second per core), which lead to the exit of the processor from low power mode. On the same tab, you can find information about the frequency of active nuclei and the causes of events that "awaken" them.
Here is an example of analyzing the data obtained after using this command:
./socwatch --max-detail -f cpu -f device -f sys -t 30 -s 5 –o ./results/idleasleep The device was connected to the computer via a USB cable, was in locked mode, the screen was turned off. As expected, the results indicate that it consumed very little energy.
Data on the device that was in sleep mode
Another useful tab is Correlate Metrics. Here you can see the time layout for various states and events. Here you can easily zoom in the view of the desired period of time and explore the exact time frame of events and how they relate to each other. In addition, note that if you hold the mouse pointer over the area you are interested in for a while, you can see a pop-up message with more detailed information. This moment is shown in the following figure.
View data on the System Correlate Metrics tab
If necessary, you can compare the results of two tests in the same window. For example, such a technique makes it easy to compare the results of two data collections performed with the same conditions. This is done in order to check whether there are any improvements, or to make sure that the results obtained earlier can be reproduced.
To compare the results of the two tests, you first need to separately import both data sets into the application, then close their data analysis tabs. In this step, it is recommended to rename the analysis results in the “Project Navigator” window in order to make it easier to work with them, but this is not necessary. Then you need to use the “Compare Results” icon and specify which analysis results should be compared. The application will show both sets of analytical data in one window, where they can be compared. Here is an example of comparing two sets of data obtained from various tests.
Comparison of several test results: general information
Comparison of the results of several tests: the reasons for the processor to exit the low-power mode
Results
We looked at an example of using Intel System Studio tools to analyze the power consumption of devices running on the Android platform. Now you have everything you need to start analyzing and optimizing your applications.
Homework
» Intel VTune Amplifier 2015 Documentation
» Optimization and Productivity Guides
Source: https://habr.com/ru/post/265621/
All Articles