A statistical method for detecting anomalies in eBay
Complex systems are prone to failures of many components, so it is reasonable to divide the failures into two classes. The first one can include repeated failures that can be prevented (for example, a hard disk failure) and identified by direct checks. The second class includes unforeseen failures.

A tool for detecting unexpected failures is statistics - hence the name of the article. The statistical anomaly detector tracks characteristic changes that go beyond what is acceptable and sends notifications. The main advantage of the statistical method for determining anomalies is that it can be used to detect problems that have not been encountered before. The disadvantages include the need to independently determine the root cause. All this may seem too abstract, so I will give a concrete example.
To avoid confusion, here are some basic terms:
')
A certain obstacle in creating effective statistical detectors is the possibility of false positives: notifications of non-existent violations. If the anomaly detector has too many false positives, the user will turn off notifications or mark them as spam, or just ignore them. And such a detector is clearly not very effective.
In this article, I will describe the statistical anomaly detector used by eBay . A similar scheme is also used in the t.onthe.io analytics tool . In the search engine in question, the monitored signals will be based on the most repetitive search results generated by a set of reference queries. For the statistical anomaly detector to work, a method of translating the results into numerical form is necessary. In our case, we apply metrics to the results.
Each reference query will be processed by approximately 50 metrics, which will combine the elements returned by the query. Two metrics for example are the number of items returned and the average price of items returned. A total of 3000 reference queries and 50 metrics are used — that is, 150,000 values. Currently, benchmark requests are issued every 4 hours or 6 times a day, so we have 900,000 values per day. Nowadays with terabyte databases is a ridiculous amount. But the analysis of these values for the detection of anomalies, and with a low false positive rate, is quite a challenge.
I will try to visually explain the approach used with charts and graphs. The first image shows the monitored signals, that is, the combined values of the metrics:
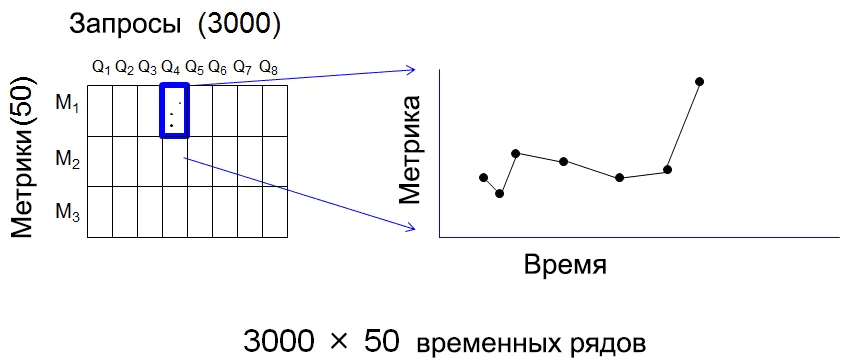
Each pair (query, metric) is a value that can be tracked over time, which is essentially a time series. In total, this is 150,000 time series, and therefore it is reasonable to expect that during each 4-hour tracking period, at least one of the series will be defined as anomalous. From which we can conclude that notifying about each anomalous time series does not make much sense, since this will lead to a large number of false positives.
In our approach, we accumulate data, and the process begins with a very simple action: considering each time series and calculating the deviation between the last and expected value, which is calculated by extrapolating the previous values. I call this “surprise” - the greater the deviation, the greater the surprise. The image below shows a surprise for each triplet (query, metric, time).
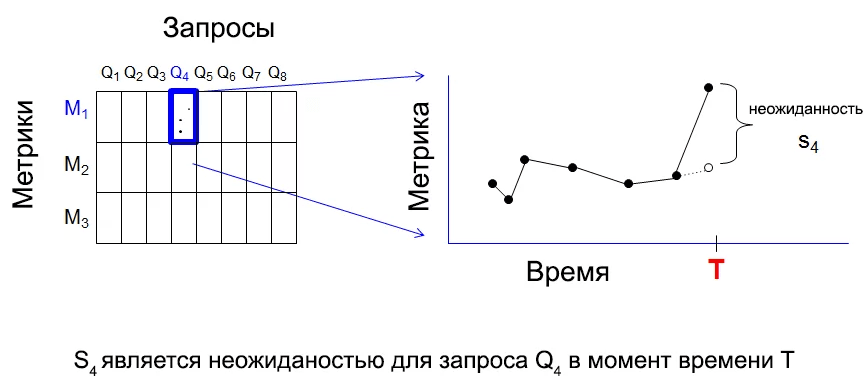
The essence of our anomaly detector is as follows: at each moment of receiving T data, we assume that there will be a great surprise value for several triplets (query, metric, T). If an unusually high number of triplets with a high surprise value is detected, an anomaly notification will be sent. To be able to quantify, we calculate the 90th percentile of surprise in time T for all 3000 queries of individual metrics: .
.
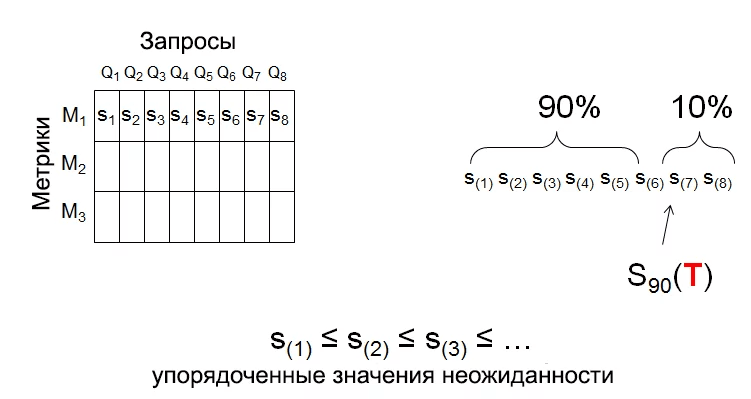
What gives a new time series of T for each metric. The approximate time series for the first two metrics are shown below.
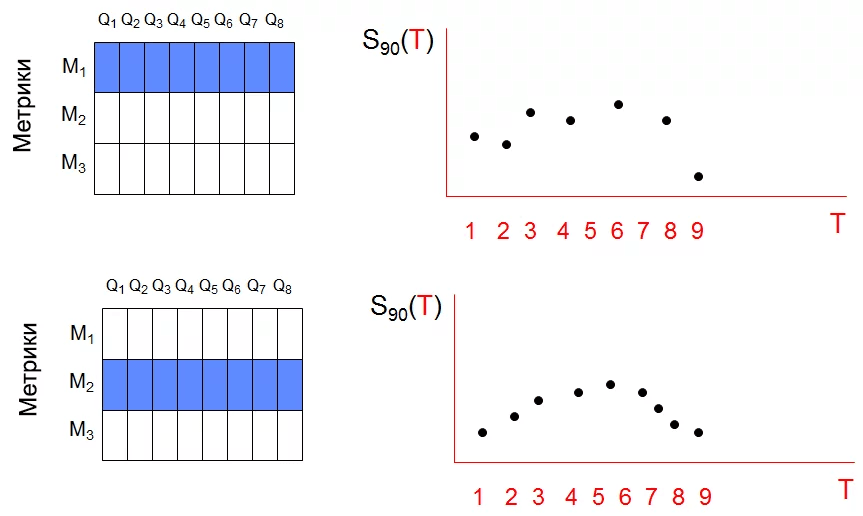
Thus, 150,000 time series were reduced to just 50. Such a combination of values is a very convenient technique for detecting anomalies.
At the end, the anomaly detector uses a simple check of the combined time series. The presence of an anomaly is considered when the current value of any of the 50 rows is more than three times the variance of the mean value of this series. Here is an example using eBay data with the average sales price metric. Clearly noticeable anomaly at time T = 88.

A tool for detecting unexpected failures is statistics - hence the name of the article. The statistical anomaly detector tracks characteristic changes that go beyond what is acceptable and sends notifications. The main advantage of the statistical method for determining anomalies is that it can be used to detect problems that have not been encountered before. The disadvantages include the need to independently determine the root cause. All this may seem too abstract, so I will give a concrete example.
Basic terms
To avoid confusion, here are some basic terms:
')
- Monitored Alarms: Continuous tracking results for violations.
- Violation: the nature of the change, indicating that the website is not working properly. Human intervention is needed to determine the cause.
- Anomaly: an unusual pattern of changes in monitored signals, indicating possible irregularities.
- Notification: automatic signal indicating an abnormality. Usually sent when an anomaly is detected.
A certain obstacle in creating effective statistical detectors is the possibility of false positives: notifications of non-existent violations. If the anomaly detector has too many false positives, the user will turn off notifications or mark them as spam, or just ignore them. And such a detector is clearly not very effective.
In this article, I will describe the statistical anomaly detector used by eBay . A similar scheme is also used in the t.onthe.io analytics tool . In the search engine in question, the monitored signals will be based on the most repetitive search results generated by a set of reference queries. For the statistical anomaly detector to work, a method of translating the results into numerical form is necessary. In our case, we apply metrics to the results.
Each reference query will be processed by approximately 50 metrics, which will combine the elements returned by the query. Two metrics for example are the number of items returned and the average price of items returned. A total of 3000 reference queries and 50 metrics are used — that is, 150,000 values. Currently, benchmark requests are issued every 4 hours or 6 times a day, so we have 900,000 values per day. Nowadays with terabyte databases is a ridiculous amount. But the analysis of these values for the detection of anomalies, and with a low false positive rate, is quite a challenge.
I will try to visually explain the approach used with charts and graphs. The first image shows the monitored signals, that is, the combined values of the metrics:
Each pair (query, metric) is a value that can be tracked over time, which is essentially a time series. In total, this is 150,000 time series, and therefore it is reasonable to expect that during each 4-hour tracking period, at least one of the series will be defined as anomalous. From which we can conclude that notifying about each anomalous time series does not make much sense, since this will lead to a large number of false positives.
In our approach, we accumulate data, and the process begins with a very simple action: considering each time series and calculating the deviation between the last and expected value, which is calculated by extrapolating the previous values. I call this “surprise” - the greater the deviation, the greater the surprise. The image below shows a surprise for each triplet (query, metric, time).
The essence of our anomaly detector is as follows: at each moment of receiving T data, we assume that there will be a great surprise value for several triplets (query, metric, T). If an unusually high number of triplets with a high surprise value is detected, an anomaly notification will be sent. To be able to quantify, we calculate the 90th percentile of surprise in time T for all 3000 queries of individual metrics:
.What gives a new time series of T for each metric. The approximate time series for the first two metrics are shown below.
Thus, 150,000 time series were reduced to just 50. Such a combination of values is a very convenient technique for detecting anomalies.
At the end, the anomaly detector uses a simple check of the combined time series. The presence of an anomaly is considered when the current value of any of the 50 rows is more than three times the variance of the mean value of this series. Here is an example using eBay data with the average sales price metric. Clearly noticeable anomaly at time T = 88.
Abstract
- Statistics is a tool for detecting anomalies.
- The statistical anomaly detector tracks characteristic changes that go beyond what is acceptable and sends notifications.
- At each moment of receiving data T, it is assumed that there will be a large value of surprise for several triplets.
- Combining the values of time series is a convenient technique for detecting anomalies.
Source: https://habr.com/ru/post/265571/
All Articles