Development of trading robots: search for market inefficiencies
Translator's note: Earlier in our blog on Habré, we looked at various stages of developing trading systems (there are online courses on the topic), and even described the development of an event-oriented backtest module in Python. Today we will talk about how the HFT-traders in the development process simulate the behavior of people who will resist their trading robots on the exchange.
Most traders believe that the best deals should be made with the participation of people acting as counterparties, not using computers. By computers, I mean the computer execution of an order: not only high-frequency trading (HFT) algorithms, but also some other types of order execution algorithms. High-frequency traders enter the market only when they are confident that the order will be profitable, their execution algorithms mainly work in the event of a large volume of stocks moving, so even if the algorithm is not sufficiently effective, it can still make [human] dangerous competition. People, in turn, do not act accurately enough when setting a price (setting an instant price to within a few decimal places is not the best waste of time for a trader), even more inaccurately when setting the time for executing their orders and canceling them (a person has slowness and inattention).
')
Therefore, it is logical that traders who use algorithms to search for small long-term orders, first think about how to maximize the likelihood of trading with people. Probably, the majority of orders placed by the traders themselves are in widespread demand and are primarily processed by wholesalers and dark pools. Then, if no one in these markets considers their conditions advantageous, they are sent to major exchanges. They are due to high competition in the queues "waiting" [ eng. resting FIFO type orders [ eng. First In, First Out ] it is incredibly difficult to selectively work with small manually generated orders: in order to select as many profitable incoming orders as possible, the trader needs to intercept them before all robots do. Considering how many fast and “smart” programs work in the market, it’s very difficult to compete with the best of them.
Knowing that manually generated orders are highly demanded in the market, we will pay attention to “waiting” orders, formed manually. If you try to define this type of order, you can start from what they are not - from HFT orders. It is known that HFT orders have a fairly high level of failures, that is, a large number of orders placed by the robot on the market are canceled before they are executed. The graph below, taken from a recent report of the European Securities Market Authority (ESMA), presents statistics on the validity period of applications from HFT algorithms, investment banks and all other traders. Note that within 1 second after the placement, more than half of the orders of the HFT algorithms were canceled and only about a quarter of all other orders. This graph is based on data from Europe, but the general trend should be observed in each of the markets with a high proportion of HFT trading.

The distribution of the duration of the "life cycle" of orders, depending on the types of traders. The vertical axis is time in seconds, the horizontal axis is the percentage of rejected or modified orders. [ Report link ]
Given this correlation between the type of trader and the duration of the life cycle of an order, take a look at how the price of an asset changes before and after the execution of orders at different time intervals, if viewed from the perspective of each of the considered orders.
Top Chart: The dependence of the average profit or loss per share from the time before / after the transaction in terms of the passive side. For example, 30 seconds after the transaction, the average Nasdaq order with a duration of less than 100 ms lost about 0.2 cents (20 mil) compared to the value of the 100 most recently sold shares. The average Nasdaq order with a duration of more than 1 second lost about 0.5 cents compared to the same indicator. Commission and rebates are not considered. Bottom chart: Dependence of the volume of shares traded on Nasdaq on the time before / after the transaction (taking into account trust trading). Note: all lines are within a region of 1 standard deviation from each other (calculated approximately), so they are difficult to discern. 1 mil = 0.01 cents per share.
A similar chart for Bats BZX, the lower chart also shows the volume of Nasdaq shares
When I first discovered this effect, I was struck by its scale. In the world of algorithmic trading, the difference of a quarter of a cent (and this is several times higher than the amount of profit in high-frequency trading) is a rather impressive phenomenon. In addition, the fact of this phenomenon is quite obvious, and in the presence of a clearly ineffective situation, the market will find a way to resolve it. One of the simplest applications that can be imagined is the predominant use of such orders with a long “life cycle” by “liquidity seekers” algorithms: theoretically, this will lead to a reduction in customer costs by a quarter of a cent.
This does not mean that the effect is so strong that it can in itself serve as the basis for a profitable strategy, but below we will see that it is not so difficult to form such a strategy. The most obvious and at the same time irrational approach to creating a strategy would be the following:
Despite the fact that such a strategy leads to better results than copying the actions of other traders, one should not expect that it will be profitable. In order to make a profit, we need to know something else about the structure of the US securities market. Probably the most important thing here is that the loss of value after the execution of the “waiting” orders on the EdgeX platform of the DirectEdge exchange, as a rule, is greater than on other exchanges. I do not know what the reason is, but on each exchange the set of traders and the flow of orders are different.

The price of assets before / after the execution of orders on various stock exchanges. In general, this graph is similar to the graphs above. Please note that rebates are not taken into account, so a visible improvement in the picture on exchanges such as Nasdaq Bx (Bsx), Bats BYX (BatsY) and DirectEdge EdgeA (EdgeA), for the most part results from the difference in compensation payments.
Another important fact is that the loss of value after the execution of the order is characteristic of "expensive" stocks (we are talking about shares with a high value, and not their valuation) in comparison with "cheap" stocks. This phenomenon is in itself interesting and may be a sign of a decrease in the activity of the expensive stock market due to: reduced liquidity, relative insignificance of tick and rebate compared to volatility, inflated fees of the Securities and Exchange Commission (levied on each circulating dollar) Shares or custom place orders for a number of shares that are a multiple of 100 (which makes the “minimum” amount of a contractor’s order of 100 shares too large to be taken advantage of by market makers).
For the same reason, trading strategies against existing liquidity are more advantageous in the case of expensive stocks. An even more unusual feature of the EdgeX platform is that the larger “waiting” orders are placed on it, the more profitable it is to trade. In most cases, a partial execution of a large order (such that a significant portion of the order remains unfulfilled) means that the current holder of the order is currently in a better position than those who traded with it. The reason for this behavior is obvious; we can assume that if the more “small” trader from our example was confident in the direction of price movement, he would have bought out all the available shares.
If in such a situation all the leading traders come from these assumptions [and do not work with partially filled orders], it turns out that those who “bite off” only a part of large orders are either noise traders or those who, due to circumstances, cannot continue trade. For some reason, this is not the case with EdgeX. For example, if I model a “strategy” that repeats all aggressive deals (regarding trading with “waiting” limit orders), in fact, it will work better when more stocks are available at the selected price level on EdgeX.

Simulation of the behavior of orders with a volume of 1000 shares, depending on the range of prices per share and the volume of executed orders. The behavior of orders with a large volume of execution is extremely unusual.
To understand why this is so unusual, imagine that you come to the Best Buy electronics store and see how some clever man buys almost all Dell laptops available. Then imagine that an ordinary person comes in and buys one Mac, leaving 50 more on the counter. You probably think that the one who bought Dell laptops was well prepared and eventually won the price more than the one who purchased the Mac. But it turns out that if Best Buy sells its products on EdgeX, then the owner of the Mac laptop is smarter.
Perhaps the one who bought Dell laptops took advantage of his company's corporate account, and he doesn’t care how much they cost, but the situation is different in the world of professional traders who, according to general opinion, carefully monitor the efficiency of their work. In addition, we can reflect on what our special advantage is, and whether we use it correctly when we look only at the lifetime of the order. In our strategy, it would be more logical to monitor all orders on all stock exchanges and trade only when the order becomes relatively “old”. With this approach, we win another 0.1-0.15 cents per share. Of course, there is a method for optimizing the strategy for the age of orders based on the characteristics of each particular stock exchange, but we simply set a standard threshold of 5 seconds for each “waiting” order on each of the stock exchanges. In the end, our strategy will look like this:
How does all this look?
Simulation of trades on the strategy above. The simulation data does not contain information about some important stock exchanges, since our strategy does not take into account the age of their orders. It is worth noting that (as in all previous charts) this chart takes into account profits and losses in the market depending on the volume of executed orders. The simulation covers more than 2.5 weeks of August 2014 - an unremarkable time for this strategy. For clarity, orders are divided by the volume executed. Note that on the Nasdaq exchange (the largest and fastest) there are no strong jumps after the deal we modeled. After it, after 1 ms, an average of 10-20 stocks were traded - approximately the same amount as in the chart above. A jump in volume would indicate simultaneous algorithmic trading — this would mean that algorithmic traders use a similar strategy.
I think the result is rather unexpected. All information used in the strategy can be easily found among the data on the market and, in principle, there is nothing special about it. For high-frequency trading, a strategy is not easier to find; there is practically no optimization, it does not use statistical models - only some features of market data are involved. This strategy can be said to contradict the conventional wisdom that successful strategies are incredibly complex and have been formed over the years. Naturally, it does not bring a sufficiently large income (by the standards of high-frequency trading), and it does not have a method for exiting a position in time, but it is not difficult to imagine that a little more painstaking work in this direction can bring much more profit.
At the moment, it brings in 1 cent per share, excluding commission, with a number of transactions of about 7,000 per day and an average order volume of 350 shares. After paying a commission of about 0.5 cents per share (0.3 cents to the stock exchange, about 0.2 cents to the Securities and Exchange Commission, clearing fees are usually no more than a few hundredths of a cent), we end up with a profit of about 10 thousand per day. I have not experienced this strategy in action; This is only a model, but in reality the results sometimes differ. But, by and large, when modeling aggressive trading, there are less discrepancies with reality compared to modeling the work of a market maker.
In some cases, market inefficiencies persist even with observant traders. In such situations, inefficiency is often “wedged” into the so-called microstructure, which becomes the property of the fastest market players. You can imagine a situation where there are several inattentive traders who are responsible for the “old” large orders that are traded inefficiently. Theoretically, if most of these inefficiencies were noticed, this would lead to panic trading in stocks remaining after the execution of older orders. In this case, it would be worthwhile to expect a jump in the volumes immediately after the execution of these orders, as well as a high sensitivity to delays during the simulation, but I did not see either.
Increasing the delay during the simulation for 100 microseconds (this is a lot for high-frequency trading) does not lead to significant changes. It is believed that market failures should be hidden only in its microstructure. This example indicates not only the inefficiency at medium time intervals, but also its rather large scale, which allows to derive profit from it. So I am very interested in whether all these supposedly carefully thought-out execution algorithms and quantitative strategies take into account at least the most basic principles of market functioning.
To be continued...
Most traders believe that the best deals should be made with the participation of people acting as counterparties, not using computers. By computers, I mean the computer execution of an order: not only high-frequency trading (HFT) algorithms, but also some other types of order execution algorithms. High-frequency traders enter the market only when they are confident that the order will be profitable, their execution algorithms mainly work in the event of a large volume of stocks moving, so even if the algorithm is not sufficiently effective, it can still make [human] dangerous competition. People, in turn, do not act accurately enough when setting a price (setting an instant price to within a few decimal places is not the best waste of time for a trader), even more inaccurately when setting the time for executing their orders and canceling them (a person has slowness and inattention).
')
Therefore, it is logical that traders who use algorithms to search for small long-term orders, first think about how to maximize the likelihood of trading with people. Probably, the majority of orders placed by the traders themselves are in widespread demand and are primarily processed by wholesalers and dark pools. Then, if no one in these markets considers their conditions advantageous, they are sent to major exchanges. They are due to high competition in the queues "waiting" [ eng. resting FIFO type orders [ eng. First In, First Out ] it is incredibly difficult to selectively work with small manually generated orders: in order to select as many profitable incoming orders as possible, the trader needs to intercept them before all robots do. Considering how many fast and “smart” programs work in the market, it’s very difficult to compete with the best of them.
Knowing that manually generated orders are highly demanded in the market, we will pay attention to “waiting” orders, formed manually. If you try to define this type of order, you can start from what they are not - from HFT orders. It is known that HFT orders have a fairly high level of failures, that is, a large number of orders placed by the robot on the market are canceled before they are executed. The graph below, taken from a recent report of the European Securities Market Authority (ESMA), presents statistics on the validity period of applications from HFT algorithms, investment banks and all other traders. Note that within 1 second after the placement, more than half of the orders of the HFT algorithms were canceled and only about a quarter of all other orders. This graph is based on data from Europe, but the general trend should be observed in each of the markets with a high proportion of HFT trading.
The distribution of the duration of the "life cycle" of orders, depending on the types of traders. The vertical axis is time in seconds, the horizontal axis is the percentage of rejected or modified orders. [ Report link ]
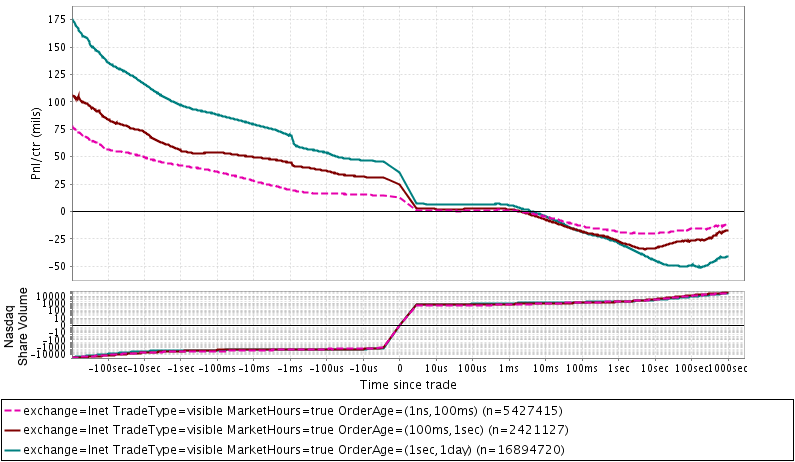
Given this correlation between the type of trader and the duration of the life cycle of an order, take a look at how the price of an asset changes before and after the execution of orders at different time intervals, if viewed from the perspective of each of the considered orders.
Top Chart: The dependence of the average profit or loss per share from the time before / after the transaction in terms of the passive side. For example, 30 seconds after the transaction, the average Nasdaq order with a duration of less than 100 ms lost about 0.2 cents (20 mil) compared to the value of the 100 most recently sold shares. The average Nasdaq order with a duration of more than 1 second lost about 0.5 cents compared to the same indicator. Commission and rebates are not considered. Bottom chart: Dependence of the volume of shares traded on Nasdaq on the time before / after the transaction (taking into account trust trading). Note: all lines are within a region of 1 standard deviation from each other (calculated approximately), so they are difficult to discern. 1 mil = 0.01 cents per share.
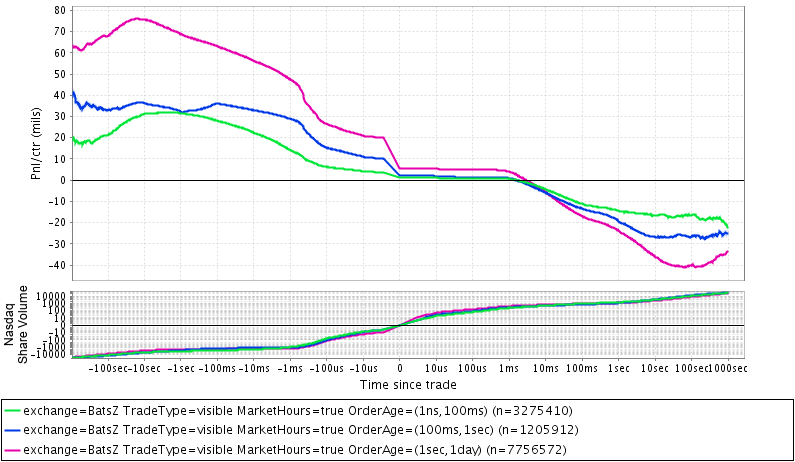
A similar chart for Bats BZX, the lower chart also shows the volume of Nasdaq shares
When I first discovered this effect, I was struck by its scale. In the world of algorithmic trading, the difference of a quarter of a cent (and this is several times higher than the amount of profit in high-frequency trading) is a rather impressive phenomenon. In addition, the fact of this phenomenon is quite obvious, and in the presence of a clearly ineffective situation, the market will find a way to resolve it. One of the simplest applications that can be imagined is the predominant use of such orders with a long “life cycle” by “liquidity seekers” algorithms: theoretically, this will lead to a reduction in customer costs by a quarter of a cent.
This does not mean that the effect is so strong that it can in itself serve as the basis for a profitable strategy, but below we will see that it is not so difficult to form such a strategy. The most obvious and at the same time irrational approach to creating a strategy would be the following:
- When we see an order in the tape about market data for a long time, we immediately place a market order at the same price, playing to “withdraw” liquidity from the market (reducing the amount of liquidity available to market players).
Despite the fact that such a strategy leads to better results than copying the actions of other traders, one should not expect that it will be profitable. In order to make a profit, we need to know something else about the structure of the US securities market. Probably the most important thing here is that the loss of value after the execution of the “waiting” orders on the EdgeX platform of the DirectEdge exchange, as a rule, is greater than on other exchanges. I do not know what the reason is, but on each exchange the set of traders and the flow of orders are different.
The price of assets before / after the execution of orders on various stock exchanges. In general, this graph is similar to the graphs above. Please note that rebates are not taken into account, so a visible improvement in the picture on exchanges such as Nasdaq Bx (Bsx), Bats BYX (BatsY) and DirectEdge EdgeA (EdgeA), for the most part results from the difference in compensation payments.
Another important fact is that the loss of value after the execution of the order is characteristic of "expensive" stocks (we are talking about shares with a high value, and not their valuation) in comparison with "cheap" stocks. This phenomenon is in itself interesting and may be a sign of a decrease in the activity of the expensive stock market due to: reduced liquidity, relative insignificance of tick and rebate compared to volatility, inflated fees of the Securities and Exchange Commission (levied on each circulating dollar) Shares or custom place orders for a number of shares that are a multiple of 100 (which makes the “minimum” amount of a contractor’s order of 100 shares too large to be taken advantage of by market makers).
For the same reason, trading strategies against existing liquidity are more advantageous in the case of expensive stocks. An even more unusual feature of the EdgeX platform is that the larger “waiting” orders are placed on it, the more profitable it is to trade. In most cases, a partial execution of a large order (such that a significant portion of the order remains unfulfilled) means that the current holder of the order is currently in a better position than those who traded with it. The reason for this behavior is obvious; we can assume that if the more “small” trader from our example was confident in the direction of price movement, he would have bought out all the available shares.
If in such a situation all the leading traders come from these assumptions [and do not work with partially filled orders], it turns out that those who “bite off” only a part of large orders are either noise traders or those who, due to circumstances, cannot continue trade. For some reason, this is not the case with EdgeX. For example, if I model a “strategy” that repeats all aggressive deals (regarding trading with “waiting” limit orders), in fact, it will work better when more stocks are available at the selected price level on EdgeX.
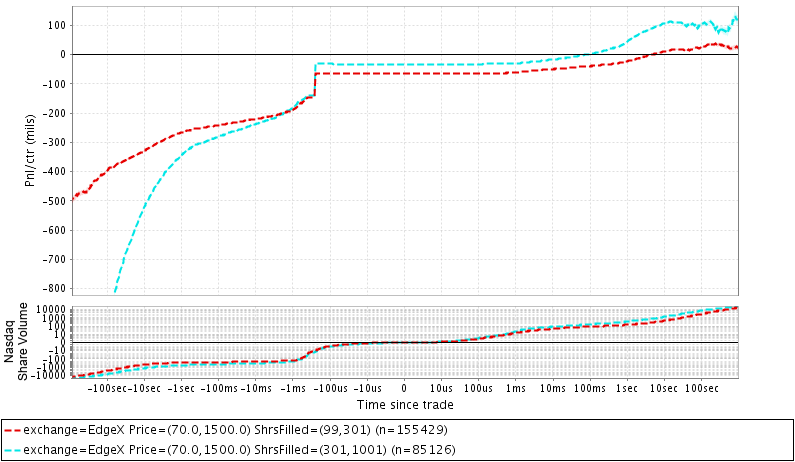
Simulation of the behavior of orders with a volume of 1000 shares, depending on the range of prices per share and the volume of executed orders. The behavior of orders with a large volume of execution is extremely unusual.
To understand why this is so unusual, imagine that you come to the Best Buy electronics store and see how some clever man buys almost all Dell laptops available. Then imagine that an ordinary person comes in and buys one Mac, leaving 50 more on the counter. You probably think that the one who bought Dell laptops was well prepared and eventually won the price more than the one who purchased the Mac. But it turns out that if Best Buy sells its products on EdgeX, then the owner of the Mac laptop is smarter.
Perhaps the one who bought Dell laptops took advantage of his company's corporate account, and he doesn’t care how much they cost, but the situation is different in the world of professional traders who, according to general opinion, carefully monitor the efficiency of their work. In addition, we can reflect on what our special advantage is, and whether we use it correctly when we look only at the lifetime of the order. In our strategy, it would be more logical to monitor all orders on all stock exchanges and trade only when the order becomes relatively “old”. With this approach, we win another 0.1-0.15 cents per share. Of course, there is a method for optimizing the strategy for the age of orders based on the characteristics of each particular stock exchange, but we simply set a standard threshold of 5 seconds for each “waiting” order on each of the stock exchanges. In the end, our strategy will look like this:
- Find EdgeX orders with a volume of 100 stocks and a lifetime of more than 5 seconds.
- If the order that meets our conditions starts to be executed, we play to withdraw liquidity.
- The volume of our order must be higher (for example, 1000 shares) so that we can get the largest possible share of the remaining EdgeX shares (on the other hand, you can send warrants of any size to the stock exchange, but only if at least 300 shares are available at the time of sending) .
- We apply this approach to stocks priced at more than $ 70 per share and in order to get more volume, we set our price 1 cent higher than the transaction price.
How does all this look?
Simulation of trades on the strategy above. The simulation data does not contain information about some important stock exchanges, since our strategy does not take into account the age of their orders. It is worth noting that (as in all previous charts) this chart takes into account profits and losses in the market depending on the volume of executed orders. The simulation covers more than 2.5 weeks of August 2014 - an unremarkable time for this strategy. For clarity, orders are divided by the volume executed. Note that on the Nasdaq exchange (the largest and fastest) there are no strong jumps after the deal we modeled. After it, after 1 ms, an average of 10-20 stocks were traded - approximately the same amount as in the chart above. A jump in volume would indicate simultaneous algorithmic trading — this would mean that algorithmic traders use a similar strategy.
I think the result is rather unexpected. All information used in the strategy can be easily found among the data on the market and, in principle, there is nothing special about it. For high-frequency trading, a strategy is not easier to find; there is practically no optimization, it does not use statistical models - only some features of market data are involved. This strategy can be said to contradict the conventional wisdom that successful strategies are incredibly complex and have been formed over the years. Naturally, it does not bring a sufficiently large income (by the standards of high-frequency trading), and it does not have a method for exiting a position in time, but it is not difficult to imagine that a little more painstaking work in this direction can bring much more profit.
At the moment, it brings in 1 cent per share, excluding commission, with a number of transactions of about 7,000 per day and an average order volume of 350 shares. After paying a commission of about 0.5 cents per share (0.3 cents to the stock exchange, about 0.2 cents to the Securities and Exchange Commission, clearing fees are usually no more than a few hundredths of a cent), we end up with a profit of about 10 thousand per day. I have not experienced this strategy in action; This is only a model, but in reality the results sometimes differ. But, by and large, when modeling aggressive trading, there are less discrepancies with reality compared to modeling the work of a market maker.
In some cases, market inefficiencies persist even with observant traders. In such situations, inefficiency is often “wedged” into the so-called microstructure, which becomes the property of the fastest market players. You can imagine a situation where there are several inattentive traders who are responsible for the “old” large orders that are traded inefficiently. Theoretically, if most of these inefficiencies were noticed, this would lead to panic trading in stocks remaining after the execution of older orders. In this case, it would be worthwhile to expect a jump in the volumes immediately after the execution of these orders, as well as a high sensitivity to delays during the simulation, but I did not see either.
Increasing the delay during the simulation for 100 microseconds (this is a lot for high-frequency trading) does not lead to significant changes. It is believed that market failures should be hidden only in its microstructure. This example indicates not only the inefficiency at medium time intervals, but also its rather large scale, which allows to derive profit from it. So I am very interested in whether all these supposedly carefully thought-out execution algorithms and quantitative strategies take into account at least the most basic principles of market functioning.
To be continued...
Source: https://habr.com/ru/post/265553/
All Articles