New Memory Profiler in Visual Studio 2015
For many years C ++ programmers writing under Linux caustically blamed C ++ developers for Windows by the absence of a normal memory profiler in Visual Studio. Here in Linux, they say, there is Valgrind, which solves all the problems, but in the studio that: arrange some macros, analyze some logs - darkness. Slander! Although true. Rather, it was true before the release of Visual Studio 2015, which finally (cheers 3 times!) There is a normal memory profiler, which allows you to catch memory leaks with your eyes closed, with one hand and not even waking up!
In this article we will see what he can do and how to use it.
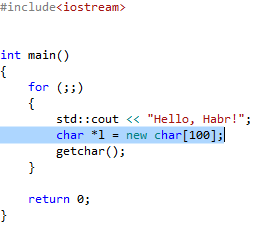
We start Visual Studio 2015, create a new console project in C ++ and write the following code into it:
')
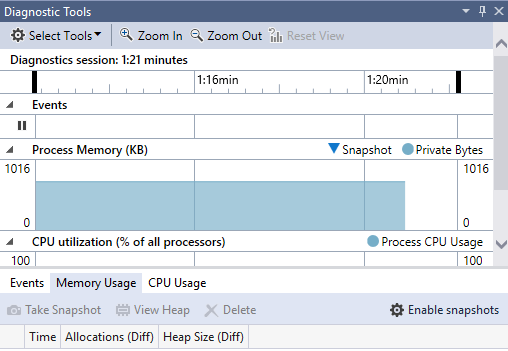
Now we run the application under the debugger (F5) and see the Diagnostic Tool panel that appears in Visual Studio (see the screenshot above).
It shows CPU and memory usage, but this is not what we are interested in. The most valuable thing in this panel is the lower part, which allows us to create snapshots of the application at any time. By default, this functional is disabled (as it slows down the application), to enable it, you must click the “Enable snapshots” button and restart the application under the debugger.
Now the “Take Snapshot” button becomes available, let's click on it.
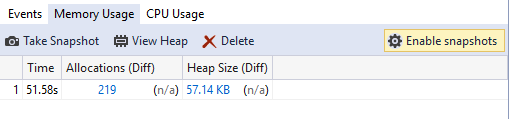
And we have the first snapshot of memory! We can click on it twice and see what's inside:
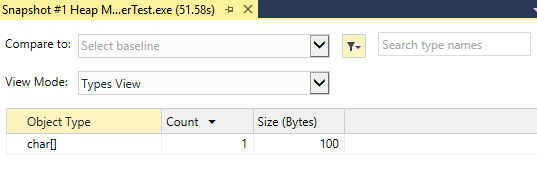
We see a list of all the memory allocations that occurred in our process, the types of variables created, their number and size in bytes. Our application is simple as a door, but still ... What is this char [] array of 100 bytes in size? How to find out where it is created? Just click on it twice - we get into the list of instances of objects of this type. We have only one. At the bottom of the window, we see the call stack, during the execution of which this block of memory was allocated. We look at the top of this stack:
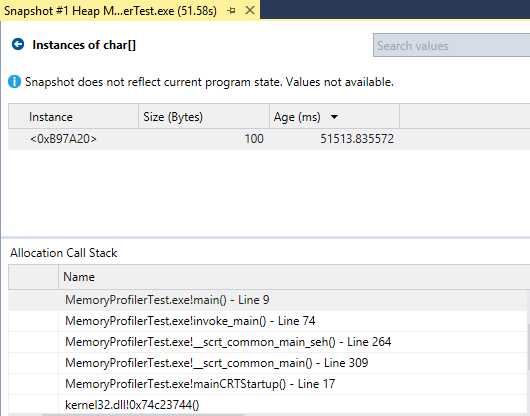
So, this is the function main (), line number 9. A double click will take us directly to the code.
Oh dear, how so! It turns out that I was just going to write that simple code that I brought in from above, and along the way I created a 100-byte array in a loop, which is not deleted anywhere and leads to a memory leak. I don’t even know how I would find it if it were not for the new Visual Studio profiler!
“Okay, stop making fun,” a practical reader will say, “He found the allocation of one array in a program of 7 lines, where no other memory is allocated. I have here in the project 150 thousand classes and code as text in "War and Peace", you try to find there where it is leaking! ".
And let's try. For realism, we will create a new MFC project that pulls the (surprise!) - MFC. We create a project with a standard wizard, without changing anything. And here we have an empty project of 55 files - long live the MFC minimalism. Well at least build.
Find the CMFCApplication1App :: OnAppAbout () method and add to it the memory leak we already know:
Now run this application under the memory profiler. As you might guess, already in the course of launching MFC, it allocates its memory. Immediately after launching, we will create the first snapshot of the memory, and then click the “About” button 10 times. Each time a modal dialog will be shown (which will lead to a certain number of operations for allocating and freeing memory) and, as you guessed, 100 bytes of memory will leak every time. In the end, we will create another snapshot of memory - now we have two.
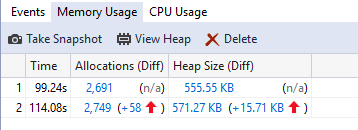
The first thing we see is the difference in the amount of allocated memory - in the second snapshot, there are 58 more emissions, which totals 15.71 KB. Basically, this is the memory allocated by MFC for its internal needs (just like in your project with 150 thousand classes, yes?), Which then, probably, will be released by MFC. But we are not interested in it, but memory leaks in our code. Let's open the second snapshot:
In principle, it is possible to draw some conclusions from here: we have 10 pointers to char, 100 bytes each - it is likely that 10 allocations of memory are associated with 10 clicks on the button, which means you can search for the number “100” in the code well, or go through the stack of calls to the place of memory allocation for this array. But okay, let's complicate the task - let's imagine that we have not 7 lines here with pointers to the allocated memory, but 700 or 7000. Among them there may be larger blocks, and other blocks existing in the amount of 10 copies. How can we track only what was created between two snapshots of memory? Elementary - for this there is a "Compare to" combo at the top of the window. Simply choose the number 1 picture there and see only the difference between the moment before the first click on the button and the moment after the 10th click. Now the tablet looks much cleaner, here already the blind will notice what you should pay attention to.

Plus, we have sorting by columns and search by data type.
In general, Microsoft's tool turned out to be a very good, just rare case when everything that is needed is in place, and there is nothing superfluous.
In this article we will see what he can do and how to use it.
We start Visual Studio 2015, create a new console project in C ++ and write the following code into it:
')
#include<iostream> int main() { for (;;) { std::cout << "Hello, Habr!"; getchar(); } return 0; } Now we run the application under the debugger (F5) and see the Diagnostic Tool panel that appears in Visual Studio (see the screenshot above).
It shows CPU and memory usage, but this is not what we are interested in. The most valuable thing in this panel is the lower part, which allows us to create snapshots of the application at any time. By default, this functional is disabled (as it slows down the application), to enable it, you must click the “Enable snapshots” button and restart the application under the debugger.
Now the “Take Snapshot” button becomes available, let's click on it.
And we have the first snapshot of memory! We can click on it twice and see what's inside:
We see a list of all the memory allocations that occurred in our process, the types of variables created, their number and size in bytes. Our application is simple as a door, but still ... What is this char [] array of 100 bytes in size? How to find out where it is created? Just click on it twice - we get into the list of instances of objects of this type. We have only one. At the bottom of the window, we see the call stack, during the execution of which this block of memory was allocated. We look at the top of this stack:
So, this is the function main (), line number 9. A double click will take us directly to the code.
Oh dear, how so! It turns out that I was just going to write that simple code that I brought in from above, and along the way I created a 100-byte array in a loop, which is not deleted anywhere and leads to a memory leak. I don’t even know how I would find it if it were not for the new Visual Studio profiler!
“Okay, stop making fun,” a practical reader will say, “He found the allocation of one array in a program of 7 lines, where no other memory is allocated. I have here in the project 150 thousand classes and code as text in "War and Peace", you try to find there where it is leaking! ".
And let's try. For realism, we will create a new MFC project that pulls the (surprise!) - MFC. We create a project with a standard wizard, without changing anything. And here we have an empty project of 55 files - long live the MFC minimalism. Well at least build.
Find the CMFCApplication1App :: OnAppAbout () method and add to it the memory leak we already know:
CMFCApplication1App::OnAppAbout() { CAboutDlg aboutDlg; aboutDlg.DoModal(); char* l = new char[100]; } Now run this application under the memory profiler. As you might guess, already in the course of launching MFC, it allocates its memory. Immediately after launching, we will create the first snapshot of the memory, and then click the “About” button 10 times. Each time a modal dialog will be shown (which will lead to a certain number of operations for allocating and freeing memory) and, as you guessed, 100 bytes of memory will leak every time. In the end, we will create another snapshot of memory - now we have two.
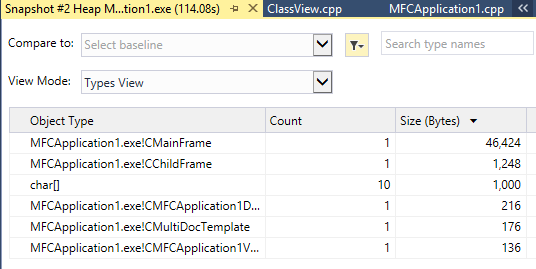
The first thing we see is the difference in the amount of allocated memory - in the second snapshot, there are 58 more emissions, which totals 15.71 KB. Basically, this is the memory allocated by MFC for its internal needs (just like in your project with 150 thousand classes, yes?), Which then, probably, will be released by MFC. But we are not interested in it, but memory leaks in our code. Let's open the second snapshot:
In principle, it is possible to draw some conclusions from here: we have 10 pointers to char, 100 bytes each - it is likely that 10 allocations of memory are associated with 10 clicks on the button, which means you can search for the number “100” in the code well, or go through the stack of calls to the place of memory allocation for this array. But okay, let's complicate the task - let's imagine that we have not 7 lines here with pointers to the allocated memory, but 700 or 7000. Among them there may be larger blocks, and other blocks existing in the amount of 10 copies. How can we track only what was created between two snapshots of memory? Elementary - for this there is a "Compare to" combo at the top of the window. Simply choose the number 1 picture there and see only the difference between the moment before the first click on the button and the moment after the 10th click. Now the tablet looks much cleaner, here already the blind will notice what you should pay attention to.
Plus, we have sorting by columns and search by data type.
In general, Microsoft's tool turned out to be a very good, just rare case when everything that is needed is in place, and there is nothing superfluous.
Source: https://habr.com/ru/post/265507/
All Articles