Co-clustering: Segmentation of data along and across
Usually clustering involves the allocation of several groups of objects with similar characteristics within the group, and between groups - different. A special feature of co-clustering is the grouping of not only the objects, but also the characteristics of these objects themselves. That is, if the data is represented as a matrix, then clustering is the rearrangement of rows or columns of the matrix, and co-clustering is the rearrangement of rows and columns of the data matrix.
As in my previous publications, examples of the use of methods and the visualization of solutions are shown on the data of the survey results. A typical area of application for co-clustering algorithms is bioinformatics, image segmentation, text analysis.

For co-clustering data, as in the case of clustering, there are many algorithms. Wikipedia reports at least 22 methods of co-clustering. This article will demonstrate the capabilities of only one of them. This method is called block clustering. Its essence is best expressed by a picture taken from the article by the authors of this approach [1].
')
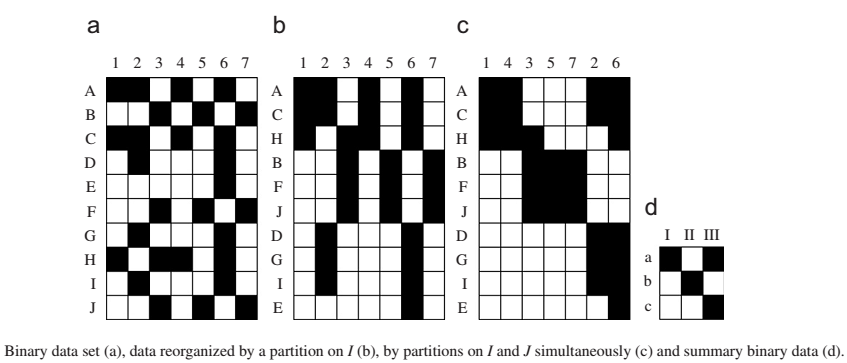
In other words, the task is to assemble a block image from a data mosaic. Mathematically, this method can be formalized using the three-factorization procedure for non-negative matrices. Let V be the input matrix of size nxm . It is required to present it in the form

Each row of matrices R and C contains exactly one unit, the other elements are zeros. The unit element ( ij ) of the matrix R indicates that the row i of the matrix V belongs to the jth horizontal cluster. The unit element ( kl ) of the matrix C indicates that the column k of the matrix V belongs to the lth vertical cluster.
The matrices R and C are chosen in such a way as to minimize the loss function: In this case, D is determined by the Frobenius norm.

This formalization goes back to [2], in which the orthogonal tri-factorization of non-negative matrices was proposed. This formulation of the problem allows the use of iterative methods for finding the specified decomposition of the input matrix, similar to the factorization methods of non-negative matrices.
But this publication will consider examples of block clustering obtained using the maximum likelihood method. Details of the algorithm can be found in [1]. Such an approach, as a rule, requires large computational costs for finding a solution. But there are advantages. First, using such a method, it is possible to automatically determine the optimal, from the point of view of the algorithm, the number of horizontal and vertical clusters for categorical data [3]. Secondly, the algorithm allows to take into account the type of input data - categorical (in particular, binary) or continuous (in this case, no restriction is required that the input data is non-negative). For the calculations, the blockcluster [4] package of the R environment will be used.

The main purpose of this publication is to demonstrate the capabilities of visualization of the clustering solution. A distinctive feature of block clustering, in addition to data segmentation in both directions, is that the type of clustering does not translate input data values. Only a permutation of the rows and columns of the input matrix is performed. This makes it possible to visualize as is the result of clustering, which is easy to interpret. I will make a reservation that if the number of columns in a matrix is measured in hundreds or thousands, you will probably need to pre-process the result. But in the tasks of analyzing the results of surveys, which will be discussed below, clustering is usually not required for a very large number of variables.
What to do if your task does not need to select groups of variables, but you want to get an idea of the block form of your data? Co-clustering does not necessarily require grouping of variables. Just with this example we begin.
Example 1: Freedom in the World (Freedom House 2015 data)
The Freedom in the World (FIW) data is a comparative assessment of political rights and civil liberties in 195 countries of the world based on interviews with experts conducted by Freedom House. Data for 2015, aggregated to 7 sub-categories, are available here .
According to the results of these 7 variables, each of the 195 countries is assigned two ratings - political rights and civil liberties, and the final status of the country is free, partially free and unfree (only 3 groups) based on the results of these ratings.
For the objects of the blockcluster class, the function plot () is supported, but I use my own variant of displaying the clustering solution.
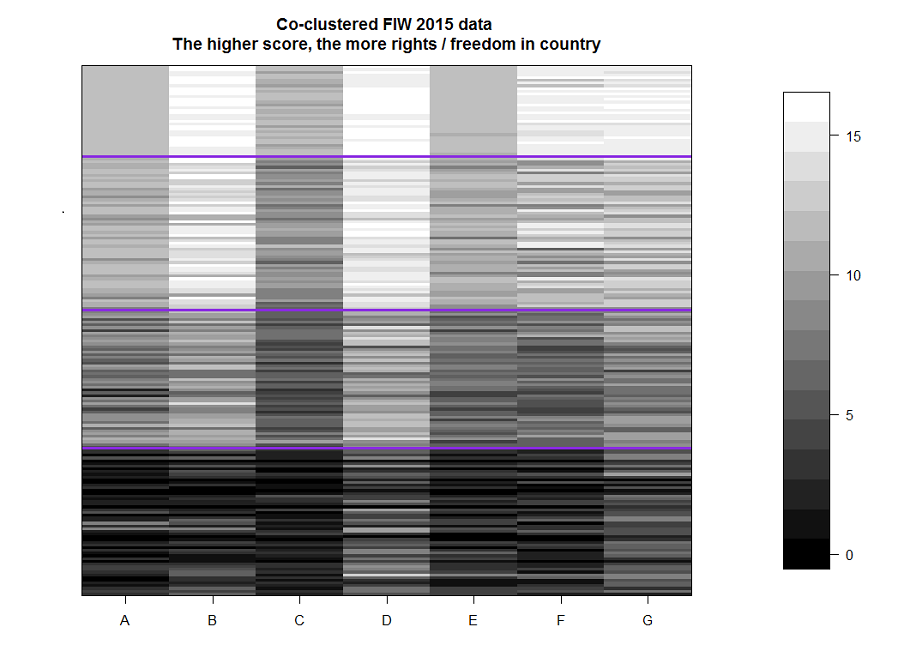
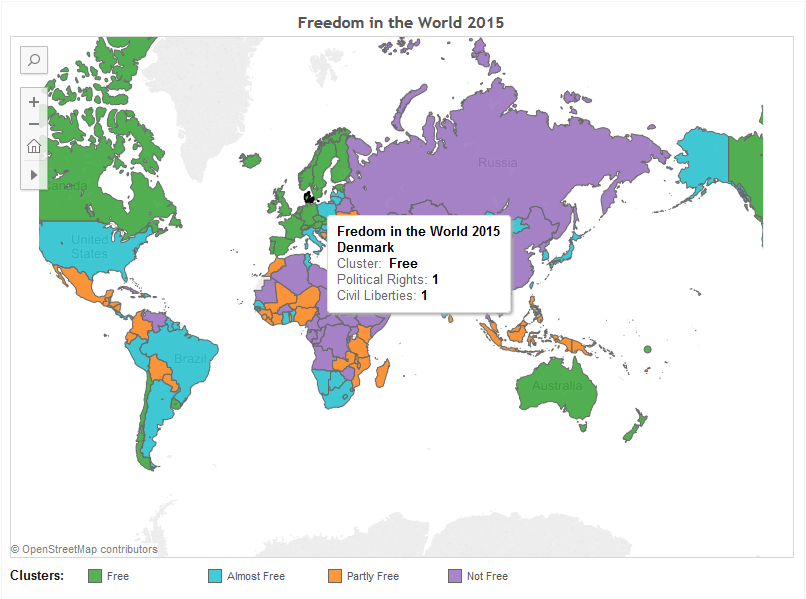
The result of the clustering of all countries, with the exception of a few cases, corresponds to the status proposed by Freedom House, taking into account that the 2 top clusters in their report have the same status, Free. Nevertheless, it is easy to see that the second cluster is clearly different from the first, especially in the variables “F” and “G”. Also, this result shows that, in general, each cluster is “darker” than the previous one in all variables at once. The result of cluster clustering presented on a geographical map in tableau public ( link )
In my view, the clustering task is more intended for marketing research than sociological research. Segmentation and selection of features of audiences is a very important element of the analysis of such data. But in open access marketing base nobody puts. Therefore, we consider an illustration of block clustering on the example of sociological data; of course, the type of research has no effect on the essence of the method.
Example 2: Democracy module (European social survey 2012 data)
The research of the ESS project is mentioned in all my previous publications. It tells you where to get the data and how to load it into R. We will group the target audience and variables by block of research with questions about democracy.
Respondents were asked to rate (from 0 to 10) the degree of importance for democracy of some 16 basic values and evaluate (from 0 to 10) the degree to which the respondent’s country applies 14 statements about civil institutions and rights at present. Polar values:
0 - “it doesn’t matter” / “not entirely true”;
10 - “extremely important” / “fully corresponds to reality”.
Detailed information about the module and the questions themselves are available here .
This is a link to a pdf file with a questionnaire in Russian for respondents from Estonia.
We set the target audience: men aged 15 years from France or Russia.
When outputting results to a block map, we replace the missing values (NA) by -5, so that they differ more from 0.
Clusters are numbered from left to right and from top to bottom.
First about vertical clusters. The first (light) cluster got the first 15 questions about common (hypothetical) values for democracy. The only out of 16 questions about basic values for democracy that did not fall into the first cluster is the question of consolidation (“Is it important that before adopting policy decisions take into account the opinions of other European governments”), it falls into the second cluster. The third vertical cluster is darker than the second, primarily for the first and third horizontal clusters. This third cluster consists of the following judgments.
Those respondents who emphasize the importance of basic civil and political values for democracy - 1 and 3 horizontal clusters are more critical of reality - 2 and 3 vertical clusters. The third horizontal cluster is more pessimistic than the first.
Horizontal clusters 2 and 4 are more uniform in vertical components, but the fourth is darker than the second, especially in the first vertical component. The fourth cluster respondents do not consider it important to have any values for the democratic life of the country.
In the fifth horizontal cluster there are many respondents who did not give answers to a number of questions, mostly from the second and first vertical clusters. The lower left corner is very contrasted - either there is no answer to the question, or a high degree of importance of a certain value is stated.
More about examples. In this pdf , at the very end of the article, examples of the results of block clustering of images and abstracts of scientific articles are presented.
Literature:
[1] G. Govaert, M. Nadif, Block clustering, Computational Statistics & Data Analysis, Volume 52, Issue 6, February 20, 2008, Pages 3233-3245.
[2] C. Ding et al. Orthogonal nonnegative matrix t-factorizations for clustering / / Proceedings of the 12th ACM SIGKDD international conference on Knowledge Discovery and Data Mining. - ACM, 2006. - p. 126-135.
[3] C. Keribin et al. Estimation and selection for the latent block model on categorical data // Statistics and Computing. - 2014. - p. 1-16.
[4] PS Bhatia et al. blockcluster: Coclustering package for binary, contingency, continuous and categorical data-sets. R package version 3.0.2
Update: In the R code for (5.3) co-clustering, a line was skipped replacing the NA values of the input matrix.
As in my previous publications, examples of the use of methods and the visualization of solutions are shown on the data of the survey results. A typical area of application for co-clustering algorithms is bioinformatics, image segmentation, text analysis.
For co-clustering data, as in the case of clustering, there are many algorithms. Wikipedia reports at least 22 methods of co-clustering. This article will demonstrate the capabilities of only one of them. This method is called block clustering. Its essence is best expressed by a picture taken from the article by the authors of this approach [1].
')
In other words, the task is to assemble a block image from a data mosaic. Mathematically, this method can be formalized using the three-factorization procedure for non-negative matrices. Let V be the input matrix of size nxm . It is required to present it in the form
Each row of matrices R and C contains exactly one unit, the other elements are zeros. The unit element ( ij ) of the matrix R indicates that the row i of the matrix V belongs to the jth horizontal cluster. The unit element ( kl ) of the matrix C indicates that the column k of the matrix V belongs to the lth vertical cluster.
The matrices R and C are chosen in such a way as to minimize the loss function:
In this case, D is determined by the Frobenius norm.This formalization goes back to [2], in which the orthogonal tri-factorization of non-negative matrices was proposed. This formulation of the problem allows the use of iterative methods for finding the specified decomposition of the input matrix, similar to the factorization methods of non-negative matrices.
But this publication will consider examples of block clustering obtained using the maximum likelihood method. Details of the algorithm can be found in [1]. Such an approach, as a rule, requires large computational costs for finding a solution. But there are advantages. First, using such a method, it is possible to automatically determine the optimal, from the point of view of the algorithm, the number of horizontal and vertical clusters for categorical data [3]. Secondly, the algorithm allows to take into account the type of input data - categorical (in particular, binary) or continuous (in this case, no restriction is required that the input data is non-negative). For the calculations, the blockcluster [4] package of the R environment will be used.
The main purpose of this publication is to demonstrate the capabilities of visualization of the clustering solution. A distinctive feature of block clustering, in addition to data segmentation in both directions, is that the type of clustering does not translate input data values. Only a permutation of the rows and columns of the input matrix is performed. This makes it possible to visualize as is the result of clustering, which is easy to interpret. I will make a reservation that if the number of columns in a matrix is measured in hundreds or thousands, you will probably need to pre-process the result. But in the tasks of analyzing the results of surveys, which will be discussed below, clustering is usually not required for a very large number of variables.
What to do if your task does not need to select groups of variables, but you want to get an idea of the block form of your data? Co-clustering does not necessarily require grouping of variables. Just with this example we begin.
Example 1: Freedom in the World (Freedom House 2015 data)
The Freedom in the World (FIW) data is a comparative assessment of political rights and civil liberties in 195 countries of the world based on interviews with experts conducted by Freedom House. Data for 2015, aggregated to 7 sub-categories, are available here .
According to the results of these 7 variables, each of the 195 countries is assigned two ratings - political rights and civil liberties, and the final status of the country is free, partially free and unfree (only 3 groups) based on the results of these ratings.
Code on R with (4.1) co-clustering FIW data
library(data.table) library(blockcluster) fiw.2015 <- fread("FIW 2015.csv") fiw.2015.clusters <- cocluster(as.matrix(fiw.2015[,LETTERS[1:7],with=FALSE]), datatype = "categorical",model = "pik_rhol_multi", nbcocluster = c(4,1), strategy = cocluststrategy(nbinititerations=100, nbxem = 20, nbtry = 20 )) For the objects of the blockcluster class, the function plot () is supported, but I use my own variant of displaying the clustering solution.
The result of the clustering of all countries, with the exception of a few cases, corresponds to the status proposed by Freedom House, taking into account that the 2 top clusters in their report have the same status, Free. Nevertheless, it is easy to see that the second cluster is clearly different from the first, especially in the variables “F” and “G”. Also, this result shows that, in general, each cluster is “darker” than the previous one in all variables at once. The result of cluster clustering presented on a geographical map in tableau public ( link )
In my view, the clustering task is more intended for marketing research than sociological research. Segmentation and selection of features of audiences is a very important element of the analysis of such data. But in open access marketing base nobody puts. Therefore, we consider an illustration of block clustering on the example of sociological data; of course, the type of research has no effect on the essence of the method.
Example 2: Democracy module (European social survey 2012 data)
The research of the ESS project is mentioned in all my previous publications. It tells you where to get the data and how to load it into R. We will group the target audience and variables by block of research with questions about democracy.
Respondents were asked to rate (from 0 to 10) the degree of importance for democracy of some 16 basic values and evaluate (from 0 to 10) the degree to which the respondent’s country applies 14 statements about civil institutions and rights at present. Polar values:
0 - “it doesn’t matter” / “not entirely true”;
10 - “extremely important” / “fully corresponds to reality”.
Detailed information about the module and the questions themselves are available here .
This is a link to a pdf file with a questionnaire in Russian for respondents from Estonia.
We set the target audience: men aged 15 years from France or Russia.
Code on R with (5.3) co-clustering ESS data
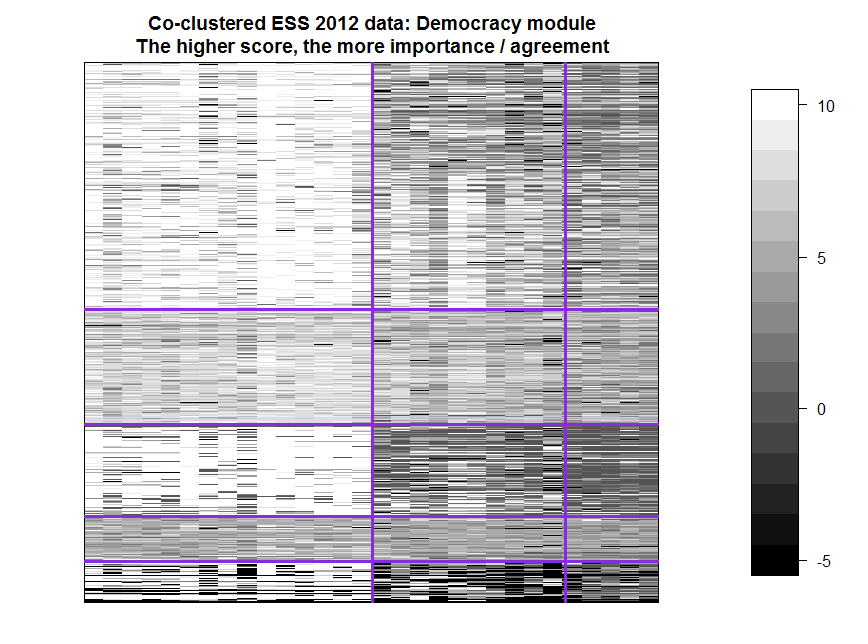
# block.e.names are names of Democracy module variables that were taken from questionnaire. data <- subset(srv.data, cntry %in% c("FR", "RU") & gndr =='Male', select = c('cntry', block.e.names[1:30])) command <- paste("data.m <- data[,as.numeric(c(", paste(block.e.names[1:30], collapse = ","), ")) - 1]") eval(parse(text=command)) dim(data.m) <- c(length(data.m)/30, 30) data.m[is.na(data.m)] <- -1 data.clusters <- cocluster(data.m, datatype = "categorical",model = "pik_rhol_multi", nbcocluster =c(5,3), strategy = cocluststrategy(nbinititerations=100, nbxem = 40, nbtry = 40 )) When outputting results to a block map, we replace the missing values (NA) by -5, so that they differ more from 0.
Clusters are numbered from left to right and from top to bottom.
First about vertical clusters. The first (light) cluster got the first 15 questions about common (hypothetical) values for democracy. The only out of 16 questions about basic values for democracy that did not fall into the first cluster is the question of consolidation (“Is it important that before adopting policy decisions take into account the opinions of other European governments”), it falls into the second cluster. The third vertical cluster is darker than the second, primarily for the first and third horizontal clusters. This third cluster consists of the following judgments.
Those respondents who emphasize the importance of basic civil and political values for democracy - 1 and 3 horizontal clusters are more critical of reality - 2 and 3 vertical clusters. The third horizontal cluster is more pessimistic than the first.
Horizontal clusters 2 and 4 are more uniform in vertical components, but the fourth is darker than the second, especially in the first vertical component. The fourth cluster respondents do not consider it important to have any values for the democratic life of the country.
In the fifth horizontal cluster there are many respondents who did not give answers to a number of questions, mostly from the second and first vertical clusters. The lower left corner is very contrasted - either there is no answer to the question, or a high degree of importance of a certain value is stated.
More about examples. In this pdf , at the very end of the article, examples of the results of block clustering of images and abstracts of scientific articles are presented.
Literature:
[1] G. Govaert, M. Nadif, Block clustering, Computational Statistics & Data Analysis, Volume 52, Issue 6, February 20, 2008, Pages 3233-3245.
[2] C. Ding et al. Orthogonal nonnegative matrix t-factorizations for clustering / / Proceedings of the 12th ACM SIGKDD international conference on Knowledge Discovery and Data Mining. - ACM, 2006. - p. 126-135.
[3] C. Keribin et al. Estimation and selection for the latent block model on categorical data // Statistics and Computing. - 2014. - p. 1-16.
[4] PS Bhatia et al. blockcluster: Coclustering package for binary, contingency, continuous and categorical data-sets. R package version 3.0.2
Update: In the R code for (5.3) co-clustering, a line was skipped replacing the NA values of the input matrix.
Source: https://habr.com/ru/post/265489/
All Articles