Kaggle. Prediction of sales, depending on weather conditions

Not later than last Friday I had an interview in one company at Palo Alto for the position of Data Scientist and this many hours of technical and not-so-many marathon had to start with my presentation about some project in which I was engaged in data analysis. Duration - 20-30 minutes.
Data Science is a vast area that includes a lot of things . Therefore, on the one hand, there is something to choose from, but, on the other hand, it was necessary to choose a project that would be correctly accepted by the public, that is, so that the listeners understand the task, understand the logic of the solution and at the same time can get into how the approach Which I used can be related to what they do every day at work.
')
A few months before, my friend Hindu was trying to get a job at the same company. He told them about one of his tasks, on which he worked in graduate school. And, without thinking, it looked good: on the one hand, it is connected with what he has been doing for the last few years at the university, that is, he can explain the details and nuances at a deep level, and on the other hand, the results of his work were published in a peer-reviewed magazine, that is, it is a contribution to the world of piggy bank knowledge. But in practice it worked quite differently. First, to explain what you want to do and why, you need a lot of time, and he has 20 minutes to everything about everything. And secondly, his story about how some graph with some parameters is divided into clusters, and how it all looks like a phase transition in physics, caused a legitimate question: “Why do we need this?”. I didn’t want the same result, so I didn’t tell about the “Quantum Monte Carlo simulations in fermionic Hubbard model.”
I decided to tell about one of the competitions on kaggle.com, in which I participated.
The choice fell on the task in which it was necessary to predict the sale of goods that are sensitive to weather conditions, depending on the date and these very weather conditions . The competition was held from April 1 to May 25, 2015. Unlike conventional competitions, in which prize-winners get big and not so much money and where it is allowed to share code and, more importantly, ideas, the prize in this competition was simple: job recruiter will look at your resume. And since the recruiter wants to evaluate your model, it was forbidden to share code and ideas.
Task:
- 45 hypermarkets in 20 different places on the world map (we do not know the geographical coordinates)
- 111 products whose sales may theoretically depend on the weather, such as umbrellas or milk (products are anonymized. That is, we are not trying to predict how many galoshes were sold on a given day. We are trying to predict how many goods were sold, say, index 31)
- Data from January 1, 2012 to September 30, 2014
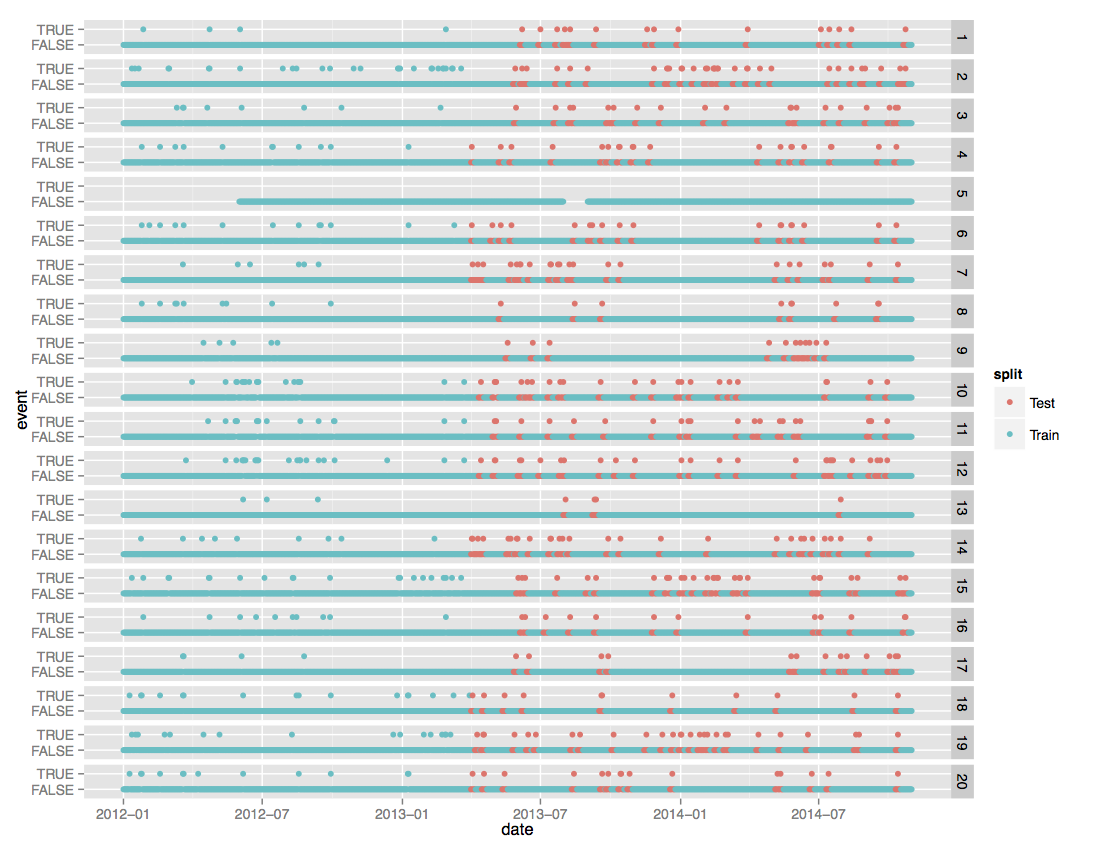
This not very clear picture, which is borrowed from the page with the description of the data for this competition, shows:
- The column with numbers on the right is meteorological stations.
- Each meteorological station has two rows: the bottom one - all dates, the top one - dates with non-standard weather conditions: storm, strong wind, heavy rain or hail, etc.
- Blue dots - train set, for which the weather and sales are known. Red - test set. Weather conditions are known, but there is no sale.
Data is presented in four csv files:
- train.csv - sales of each of 111 products in each of 45 stores each day from the train set
- test.csv - dates on which it is necessary to predict sales in each of the 45 stores for each of 111 products
- key.csv - which meteorological stations are located next to which stores
- weather.csv - weather conditions for each of the days in the range from January 1, 2012 to September 30, 2012 for each of the 20 weather stations
Meteorological stations provide the following data (Percentage of missing values in brackets.):
- Maximum temperature [degrees Fahrenheit] (4.4%)
- Minimum temperature [degrees Fahrenheit] (4.4%)
- Average temperature [degrees Fahrenheit] (7.4%)
- Deviation from the expected temperature [degrees Fahrenheit] (56.1%)
- Dew point [Fahrenheit] (3.2%)
- Wet thermometer temperature [degrees Fahrenheit] (6.1%)
- Rise time (47%)
- Sunset time (47%)
- Summary description of the type of rain, fog, tornado (53.8%)
- Precipitation of snow [inches] (35.2%)
- Precipitation in the form of rain [inches] (4.1%)
- Atmospheric pressure at station [inches of mercury] (4.5%)
- Atmospheric pressure at sea level [inches of mercury] (8.4%)
- Wind speed [mph] (2.8%)
- Wind direction [degrees] (2.8%)
- Average wind speed [mph] (4.2%)
Obvious data problems:
- We do not know the geographical coordinates of the stores. And that's bad. Rain or sun is important, but most likely Alaska and San Francisco will show different sales dynamics.
- Product names are anonymized. We do not know if the item with ID = 35 is milk, whiskey or cotton pants.
- The organizers of the competition decided to aggravate the previous item and wrote in English and white that there are no guarantees that ID = 35 in one store will mean the same as in the other.
- Meteorological stations measure not everything and not always. The weather data is pretty leaky. And the question of how to fill these gaps will need to somehow be addressed.
For me, the main thing in any task in machine learning, on which I work - is the "question". In the sense that you need to understand the question to find the answer. It seems to be a tautology, but I have examples in scientific activities and in third-party projects like Kagla, when people tried to find an answer not to the question that was asked, but to some kind of invented by themselves, and this did not end well .
The second most important is the metric. I do not like how it sounds: "My model is more precisely yours." It will be much more pleasant to sound similar in meaning, but a little more accurate: “My model is more accurate than yours if we apply this metric for evaluation.”
We need to predict how many goods will be sold, that is, this regression task. The standard regression metric of the standard deviation can be used, but it is illogical. The problem is that the algorithm, which will try to predict how many pairs of rubber boots will be sold, can predict negative values. And then the question will be what to do with these negative values? Reset? Take absolute value? It is a chore. You can do better. Let's make a monotonous transformation of what needs to be predicted, so that the transformed values can take on any real, including negative, values. Predict them, and then perform the inverse transform on the interval of non-negative real numbers.
This can be thought of as if our error function were defined like this:
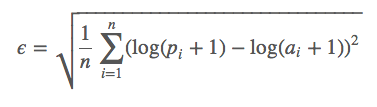
Where:
- a - real value
- p is our prediction
- the natural logarithm of the argument shifted by 1 is a monotone map with a non-negative real axis to the whole axis, with an obvious inverse transformation.
But, more importantly, in this competition, the accuracy of our prediction is estimated by this very metric. And I will use it exactly: what the organizers want, then I will give them to them.
Zero iteration or base model.
When working on various tasks, this approach showed itself well: as soon as you started working on a task, you create a clumsy script that makes a prediction on our test set. It is clumsy because it is created stupidly, without thinking, without looking at the data. And not building any distributions. The idea is that I need a lower estimate of the accuracy of the model that I can offer. As soon as I have such a "clumsy" script, I can check out some new ideas, create new signs, adjust the model parameters. I usually carry out the assessment of accuracy in two ways:
- The result of the evaluation of the prediction on the test set, which shows us the Public Leaderboard on kaggle.
- hold out set if the train set is large and uniform, or 5 fold cross validation if the train set is small or uneven
The first is good because it does not take much time. Made a prediction, sent to the site - got the result. The bad news is that the number of attempts per day is limited. In this competition, it is 5. He is also good at showing the relative accuracy of the model. Error 0.1 - is it a lot or a little? If many of them have a smaller prediction error on the Public Leaderboard, this is a lot.
The second is good because you can evaluate different models as many times as you like.
The problem is that the model is evaluated, using the same metric can give different accuracy in these two approaches:
Inconsistencies may be caused by:
- data in train and test are collected from different distributions
- very small train or test
- tricky metric does not allow human cross validation
In practice, it is enough that the improvement in accuracy of the cross validation model corresponds to the improvement in the results on the Public Leaderboard; exact numerical matching is not necessary.
So here. The first thing I wrote a script that:
- It surpasses the time of dawn / dusk from hours and minutes to the number of minutes since midnight.
- Summary of weather conditions in dummy variables.
- Instead of all missing values, -1.
- We connect the corresponding train.csv / test.csv, key.csv and weather.csv
- Littered train set - 4,617,600 objects.
- The resulting test set is 526,917 objects.
Now we need to feed this data to some algorithm and make a prediction. There is a sea of different regression algorithms, each with its own pros and cons, that is, there is plenty to choose from. My choice in this case for the base model is Random Forest Regressor . The logic of this choice is that:
- Random Forest has all the advantages of algorithms from the Decision Tree family. For example, theoretically he is indifferent to whether a numerical or categorical variable.
- It works fast enough. If my memory serves me, the complexity is O (n log (n)), where n is the number of objects. This is worse than the stochastic gradient descent method with its linear complexity, but better than the support vector method with a nonlinear core, in which O (n ^ 3).
- Evaluates the importance of attributes, which is important for the interpretation of the model.
- Indifferent to multicollinearity and correlated data.
Prediction => 0.49506
Iteration 1.
Usually in all online classes there is a lot of discussion about which graphs to build, in order to try to understand what is happening. And this idea is correct. But! In this case there is a problem. 45 stores, 111 products, and there is no guarantee that the same ID in different stores corresponds to the same product. That is, it turns out that it is necessary to investigate, and then predict 45 * 111 = 4995 different pairs (store, product). For each pair, weather conditions may work differently. The correct, simple, but not obvious idea is to build a heatmap for each pair (store, product), on which to display how many units of goods were sold for all the time:

- In the vertical - the index of the goods.
- Horizontally - Intex store.
- Brightness points - Log (how many units of goods sold for all time).
And what do we see? The picture is quite pale. That is, it is possible that some goods in some stores in principle were not sold. I associate this with the geographical location of the stores. (Who will buy a down sleeping bag in Hawaii?). And let's exclude from our train and test those goods that have never been sold in this store.
- train from 4617600 reduced to 236038
- test from 526917 is reduced to 26168
that is, the size of the data has been reduced by almost 20 times. And as a consequence:
- We removed some noise from the data. As a result, the algorithm will be easier to train and predict, that is, the accuracy of the model should increase.
- The model trains much faster, that is, it is much easier to test new ideas.
- Now we train on a reduced train (236038 objects), we predict on a reduced test (26168 objects), but since Kagl wants a prediction with a size (526917 objects), we score the rest with zeros. The logic is that if a product has never been sold in this store, then either it will never be sold or it will be sold, but we cannot predict this in any way.
Prediction -> 0.14240 . The error has decreased three times.
Iteration 2.
The train / test size reduction worked great. Is it possible to aggravate? It turns out that you can. After the previous iteration, I only got 255 non-zero pairs (store, product), and this is already foreseeable. I looked at the graphics for each pair and it turned out that some products were not sold not because of bad / good weather conditions, but simply because they were not available. For example, here's a picture for item 93, in store 12:
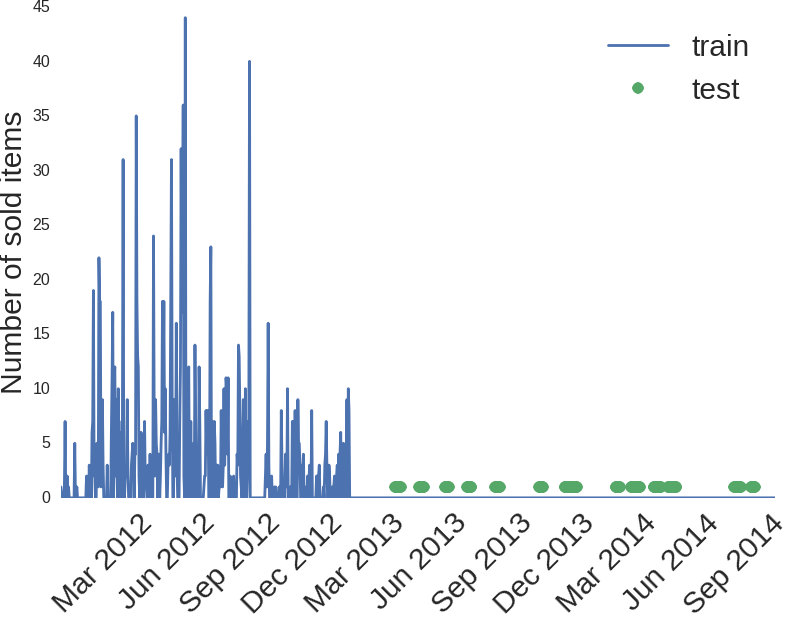
I do not know what kind of product, but there is a suspicion that its sales ended at the end of 2012. You can try to remove these products from the train and put 0 in all of them in the test, as our prediction.
- train is reduced to 191,000 objects
- test decreases to 21272 objects
Prediction -> 0.12918
Iteration 3.
The name of the competition involves prediction based on weather data, but, as usual, they are cunning. The task we are trying to solve sounds different:
"You have a train, you have a test, spin as you wish, but make the most accurate prediction with this metric."
What's the difference? The difference is that we have not only weather data, but also a date. And the date is a source of very powerful signs.
- Data for three years => annual frequency => new signs year and number of days from new year
- People get paid once a month. It is possible that there is a monthly frequency in purchases. => new sign month
- The way people make purchases can be related to the day of the week. Rain is, of course, yes, but Friday evening is Friday evening => a new sign the day of the week .
Prediction -> 0.10649 (by the way, we are already in the top 25%)
What about the weather?
It turns out that the weather is not very important. I honestly tried to add weight to her. I tried to fill in the missing values in various ways, such as average values on the basis of various tricky subgroups, and tried to predict the missing values using various machine learning algorithms. Slightly helped, but at the level of error.
The next stage is linear regression.
Despite the seeming simplicity of the algorithm, and a bunch of problems that this algorithm has, it also has significant advantages that make it one of my favorite regression algorithms.
- Category attributes such as day of the week, month, year, store number, product index are distilled in dummy variables
- Scaling to increase convergence rate and results interpretability.
- Twist the L1 and L2 parameters of regularization.
Prediction -> 0.12770
This is worse than Random Forest, but not so much.
The question is, why do I even need linear regression on nonlinear data? There is a reason. And the reason for this - an assessment of the importance of signs.
I use three different approaches for this assessment.
The first is what RandomForest issues after we have trained it:

What do we see in this picture? The fact that the type of goods sold, as well as the store number is important. And the rest is much less important. But this we could say, even without looking at the data. Let's remove the item type and store number:
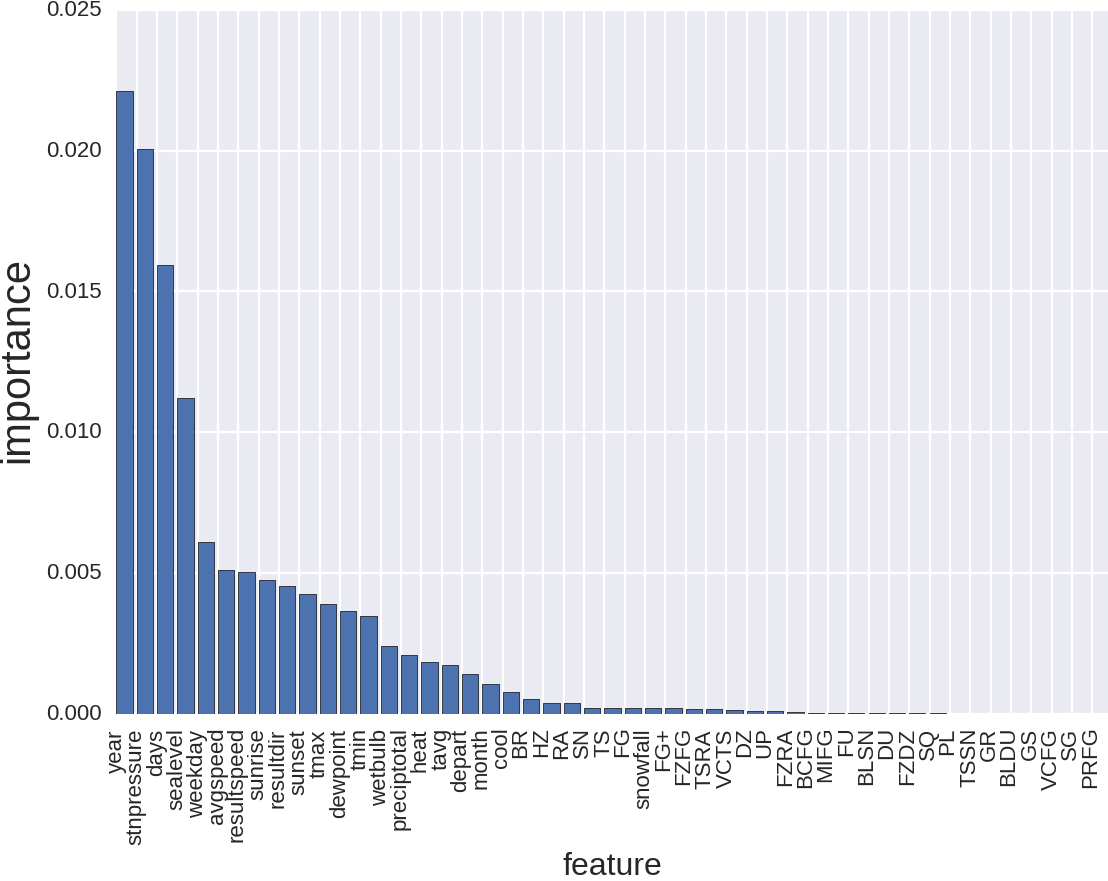
And what is it? Year - perhaps it is logical, but it is not obvious to me. The pressure was clear to me, by the way, but the people to whom I was speaking were not very good. Still, in St. Petersburg, the frequent change of weather, which is accompanied by a change in atmospheric pressure, and how it changes mood and health, especially in older people, I was aware of. To people living in California, with its stable climate, this was not obvious. What's next? The number of days from the beginning of the year is also logical. Cuts off what season we are trying to predict sales. And the weather, anyway, with the season may be connected. Then the day of the week is also understandable. Etc.
The second method is the absolute value of the coefficients that the linear regression produces on the scaled data. The greater the coefficient - the more influence it has.
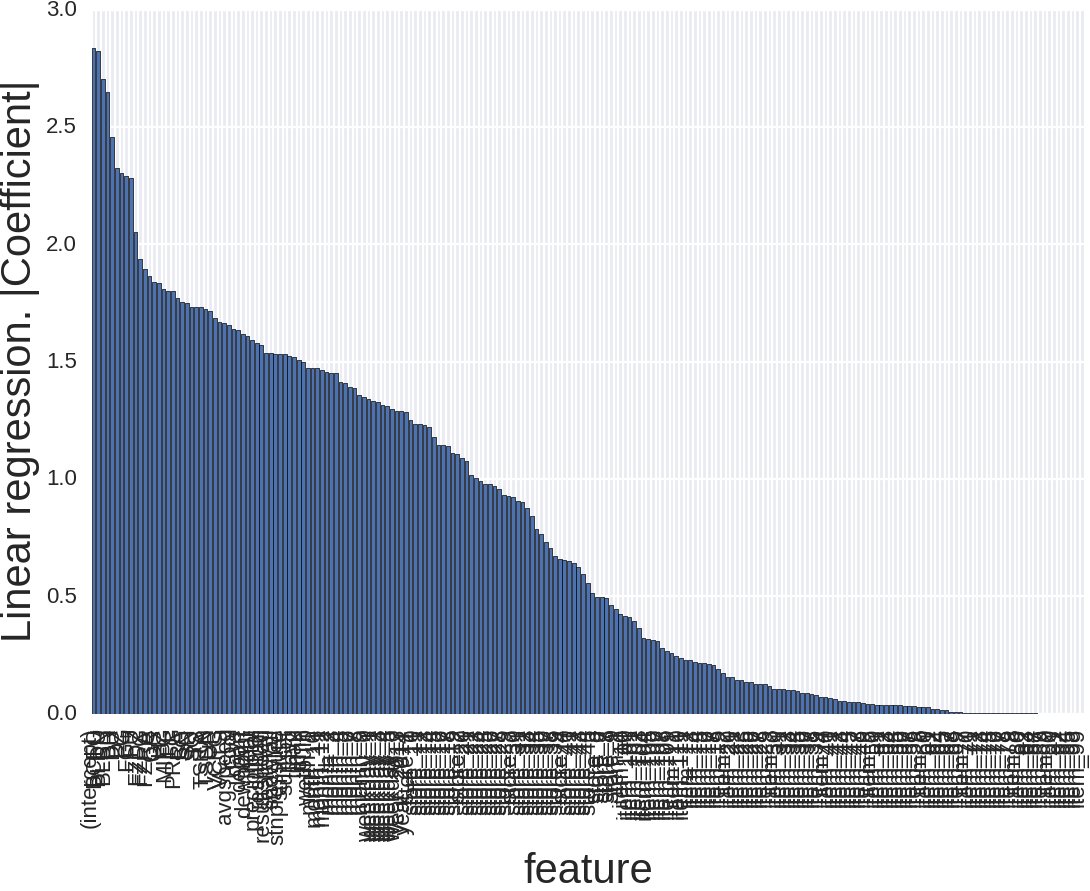
The picture looks like this and there is little that is clear. The reason that there are so many signs is that, for example, the type of goods for RandomForest is one sign, and here there are as many as 111, the same with the store number, month and day of the week. Let's remove the item type and store number.
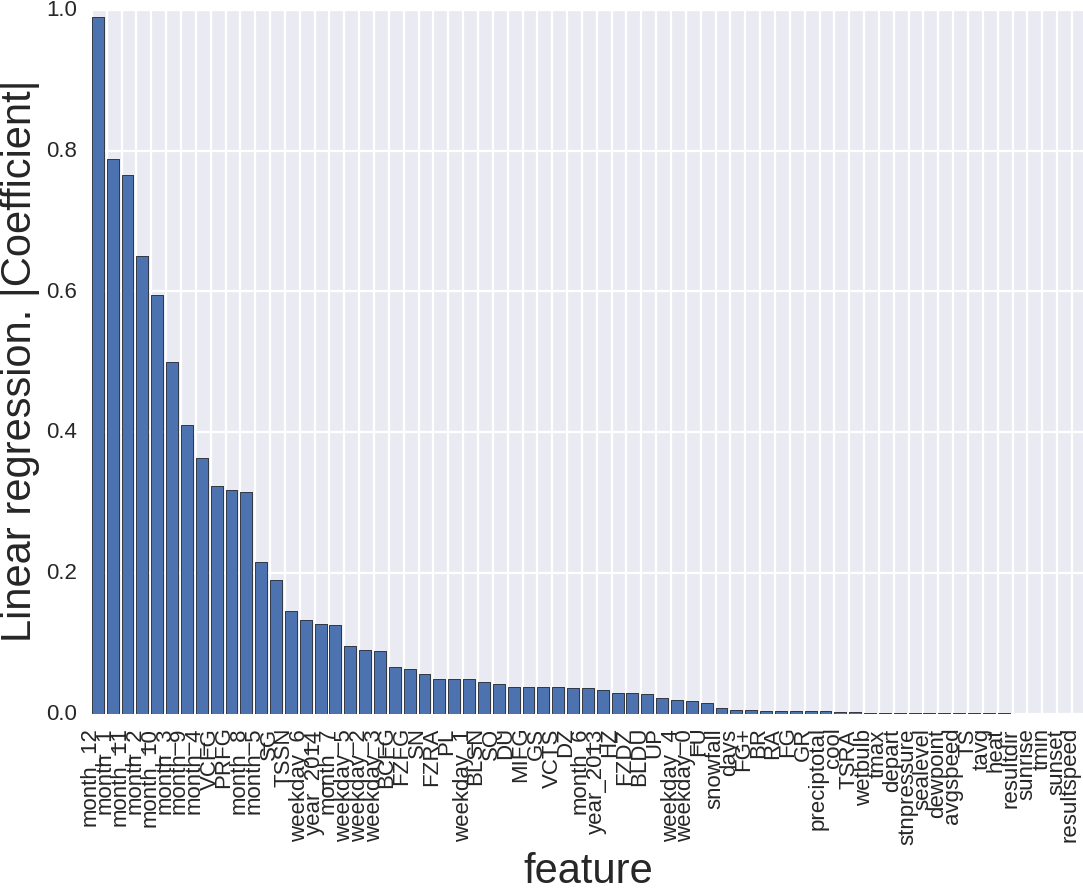
That's better. What's going on here? Month is important, and especially if it is December, January or November. It seems also logical. Winter. Weather. And, importantly, the holidays. There is a new year, thanksgiving, and christmas.
The third method is the brute force method, throwing out the signs one by one and see how this will affect the prediction accuracy. The most reliable, but the most dreary.
With the finding of signs and their interpretation, we seem to have finished, now numerical methods. It's all straightforward. We try different algorithms, find the optimal parameters manually or using GridSearch. We combine. Predict.
- Linear regression ( 0.12770 )
- Random Forest ( 0.10649 )
- Gradient Boosting ( 0.09736 )
I did not particularly invent. Took a weighted average of these predictions. Weight calculated by predicting these algorithms on holdout set, which bit off the train set.
It turned out something like 0.85% Gradient Boosting, 10% Random Forest, 5% Linear regression.
Result: 0.09532 (15th place, top 3%)

On this chart, the best known result is the first place on Private LeaderBoard.
What did not work:
- kNN is a simple algorithm, but often performs well as part of an ensemble. I couldn’t squeeze less of it (0.3)
- Neural networks - with the right approach, even on such disparate data, they show a decent result, and what is important, often show themselves remarkably well in assemblies. Here I didn’t have enough directness of hands, something somewhere I was too smart.
- I tried to build separate models for each weather station, product and store, but the data becomes very small, so the prediction accuracy falls.
- An attempt was made to analyze time series and the selection of the trend, and periodic components, but this prediction accuracy also did not increase.
Total:
- Clever algorithms are important, and now there are algorithms that produce very accurate results out of the box. (For example, I was pleased with the convolutional neural network of 28 layers, which itself isolates the vital signs from the images. )
- Data preparation and the creation of literate traits are often (but not always) much more important than complex models.
- Often ingenious ideas don't work.
- Sometimes completely stupid and hopeless ideas work great.
- People are those creatures who like to be in the comfort zone and follow their time-tested schedule, which is based on the calendar, and not on the momentary impulse caused by weather conditions.
- I tried to squeeze as much of this data as possible, but if we knew the price of the goods, or their names, or the geographical location of the stores, the solution would be different.
- I did not try to add the weather before and after the day for which the prediction should be made. Also, I did not try to create a separate feature to describe the holidays. It is possible that this would help.
- I spent a week on everything about everything, from time to time looking up from completing my thesis and starting another iteration. Perhaps the prediction accuracy could be increased if I spent more time, although on the other hand, since I did not do it in a week, then so be it. On kaggle.com a lot of interesting competitions, and to focus on one thing is not very correct in terms of the effectiveness of obtaining knowledge.
- Anyone who has not tried to participate in competitions on kaggle.com - I recommend. It is interesting and informative.
UPDATE:
The comments asked a very correct question about overfitting, and I decided to add a text describing how the accuracy of your model is evaluated on kaggle.com.
When interviewing me, people often ask me where my machine learning experience comes from. Previously, I replied that the theoretical preparation of online classes, reading books, scientific articles and forums of relevant topics. A practical of attempts to use machine learning in condensed matter physics and the experience of participating in competitions at Kagla. Moreover, in fact from the point of view of knowledge, kaggle gave me much more. At least because there I worked with more than 20 different tasks, and each has its own nuances and troubles. For example:
- Otto Group Product Classification Challenge - The data was prepared in such a way that no one really could create any signs. The emphasis in this competition was on numerical methods. Algorithms, model parameters, ensembles. In this competition, I figured out the algorithms: Gradient Boosting, met Neural Networks, and learned how to make simple ensembles. Began to actively use scikit-learn, graphlab, xgboost.
- Search Results Relevance - Here is Natural Language Processing with all the relevant theoretical and practical problems. Theoretical base and practical experience of using SVM, bag of words, word2vec, glove, nltk.
- Avito Context Ad Clicks - There is a question of scalability. 300 million objects with lots of signs. And here Apache Spark went with me, all the power and shortcomings of the logistic regression showed up. (Unfortunately, my hands did not reach FFM)
- Diabetic Retinopathy Detection - Image processing, feature extraction from images, neural networks, advantages and disadvantages of using GPUs. Experience with Theano and ImageMagic.
and so on, another 15 different problems. It is very important that thousands of people with different knowledge and experience worked on these tasks at the same time, sharing ideas and code. Sea of knowledge. In my opinion, this is a very effective training, especially if you simultaneously get acquainted with the relevant theory. Each competition teaches something, and in practice. For example, in our faculty, many have heard of PCA, and these many believe that it is a magic wand that can be used almost blindly to reduce the number of signs. And in fact PCA is a very powerful technique, if used correctly. And very powerful shoots in the foot, if wrong. But until I tried it on various types of data, you really don't feel it.
And, due to my inherent naivety, I assumed that those who heard about Kagl heard it that way. It turned out that no. Communicating with familiar Data Scientists, as well as slightly discussing my experience on different languages, I realized that people do not know how the accuracy assessment of the model takes place at these competitions, and the general opinion about kaglerah are overfitters, and this experience participation in competitions is more negative than positive.
So, I will try to explain how it is and what:
Most (but not all) tasks that are offered to those who wish are training with a teacher. That is, we have a train set, there is a test set. And you need to make a prediction on the test. The accuracy of the model is estimated by how correctly we predicted the test. And that sounds bad. In the sense that experienced Data Scientists will immediately see the problem. Making a bunch of predictions on test, we aggressively overfit. And the model that works exactly on test can work disgustingly on new data. And that's exactly how most of those who heard about Cagle, but did not try, think about this process. But! In fact, everything is not so.
The idea is that the test set is divided into two parts: Public and Private. Usually in the proportion of 30% on Public, and 70% on Private. You make a prediction on the whole test set, but until the competition ends, you can see the accuracy of your prediction only on Public. And after the end of the competition, the accuracy on Private becomes available to you, and this Private is the final accuracy of your model.
An example of a competition that I described in this text.
The competition ends on May 25th. => Until 17:00, PST you have a prediction error of 30% test set, that is, the public part. In my case it was 0.09486 and 10th place on the Public Leaderboard. At five in the evening the PST contest ends. And the prediction on the remaining 70% (Private) becomes available.
I have this 0.09532 and 15th place. That is, I slightly overfitit.
The final accuracy of your Private model is estimated by the two predictions you selected. As a rule, I choose one of them - the one that gives the smallest error on the Public Leaderboard, and the second is the one that gives the smallest error on the Cross Validation calculated by the train set.
I usually work in this mode: if the error on the local cross validation has decreased => I send the prediction to Cagl. That is a strong overfit does not occur. Model parameters are also selected based on the magnitude of the error on cross validation. For example, the weights with which I averaged Linear Regression, Random Forest and Gradient Boosting were determined by a piece of data that I bit off the train and did not use for training the model, nor did I use the test set.
As Owen correctly noted, in one of his presentations , the correct assessment of the accuracy of the model is much more important than the complexity of the model. Therefore, when I create my naive script (zero iteration) mentioned above, I do not focus on data analysis and model accuracy, but on the fact that the cross validation error on the train set matches the error on the Public Leaderboard.
This is not always easy, and often simply impossible.
Examples:
- Facebook Recruiting IV: Human or Robot? - here I have something not fused. Moreover, the people at the forum discussed how to do it humanly, that is, I am not the only one. I was at war with reviewers on my dissertation topic, so here I’m just a Public Leaderboard overfit, but neatly. My place on Private is 91st place higher than on Public. Most likely because the rest overfit more aggressively. But in general, this is an example of competition when Public and Private come from slightly different distributions.
- Restaurant Revenue Prediction is generally ahtung. train set - 137 objects, including outliers. test set - 10,000. Here, simply because of the small size of the train, you can think of nothing more than overfitting the Public Leaderboard. , Private Public. , , , .
- ECML/PKDD 15: Taxi Trajectory Prediction (I) ECML/PKDD 15: Taxi Trip Time Prediction (II) — , -, , , , cross validation. train/test . train test.
- ICDM 2015: Drawbridge Cross-Device Connections — semi-supervised learning . , . . 12 . : « ». - .
Morality - I tried to clarify that the people who participate in the kaggle.com demonstration are different publics. At first, the majority is engaged in adjusting the parameters, based on the results of the Public Leaderboard, and then howling on the forum that “the world is cruel, everyone is to blame,” when their final position on Private is much lower than expected. But, as a rule, after the first such puncture, the chakras open and the public approaches the issue of assessing the accuracy of the model very carefully, with an understanding of where KFold is needed, where StarifiedKFold is, and where it is enough to hold out set, how many folds you need to take, how to interpret the results, and in general, where are there any rakes, and when they can be stepped on, and when they are not worth it.
Source: https://habr.com/ru/post/264653/
All Articles