Analysis of the performance of the game on WebGL using about: tracing
That which is not measurable cannot be improved.
- Lord Kelvin
To speed up games written with HTML5, you first need to identify their bottlenecks. Counting FPS is a good method, but to see the full details, you need to understand the nuances of Chrome's behavior.
The about: tracing tool allows you to avoid unnecessary work related to increased speed, and based mostly on guesswork. You will save energy and money, if you clearly trace the work of the browser with this tool.
He shows you everything that Chrome does, and so detailed that at first it can even be overwhelming. Many of the features of Chrome are originally designed for tracing, so you can use about: tracing right out of the box to evaluate performance.
')
To do this, simply type about: tracing in the address bar.

The trace tool allows you to turn on recording, start the game for a few seconds and see the trace data. An example of what they might look like:
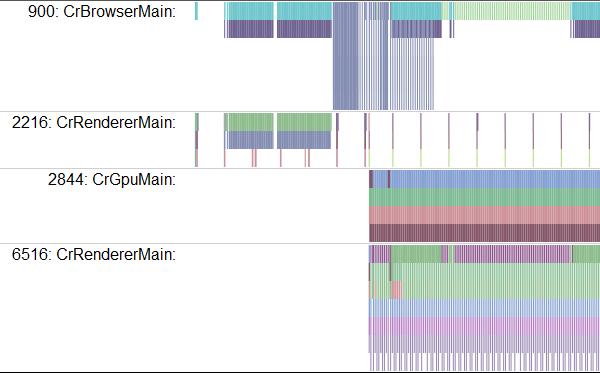
Yes, it looks confusing at first.
Each row is a process that we track. The axis from left to right denotes time, and the colored rectangle indicates a function call. The series are presented for a variety of resources, but most of all we are interested in CrGpuMain, which shows how the GPU works, and CrRendererMain. Each trace contains CrRendererMain lines for each open tab (including the about: tracing tab itself).
Your first task is to determine which series of CrRendererMain matches the game.
In this example, there are two candidates — 2216 and 6516. Unfortunately, for now there is no easy way to select your application, except to look for the line that periodically performs updates (or, if you study the code using tracking points, the line containing the tracking data ). In our example, you can see that the 6516 performs many updates. If you close all the extra tabs, the search process will be easier. But all the same, CrRendererMain ranks from other processes can get here.
Looking for a frame
Having found the desired series, you need to start searching for the main cycle. It looks like a repeating pattern. You can walk along the tracking data using the WASD - A and D buttons to move left and right (back and forth in time), W and S to zoom in and out. The main loop must be repeated every 16 ms, if your game goes to 60 Hz.

Having found your "heartbeats", you can begin a detailed study of the activity of the code. Use W, A, S, D to enlarge the picture until the text appears on it.
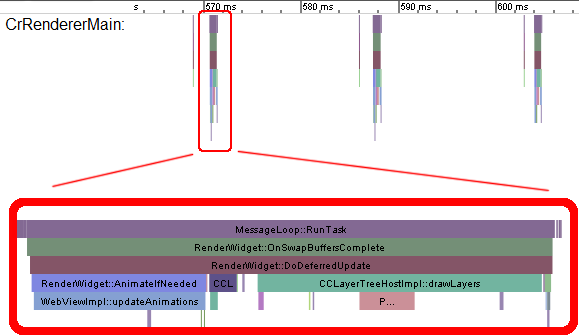
The rectangles show the sequence of function calls, each of which is represented by its colored rectangle. Each function was called from the top rectangle, so in our case, you can see that MessageLoop :: RunTask called RenderWidget :: OnSwapBuffersComplete, which caused RenderWidget :: DoDeferredUpdate, and so on. So it turns out the full picture of what is happening.
True, this information is “raw” calls from Chrome source code. Of course, one can guess what each of the functions does, but the information is not particularly convenient. Something more human readable is required.
Add tracking tags
And this possibility exists - it is console.time and console.timeEnd.
console.time("update"); update(); console.timeEnd("update"); console.time("render"); update(); console.timeEnd("render"); This code creates new rectangles with the specified names, so you will see in the report “update” and “render”, which will show how much time has passed between the calls of these labels.

GPU or CPU?
When you have a graphics accelerator, one of the main questions about profiling is what is overloading our code, GPU or CPU? Each frame takes resources from both one and the other. To understand where the brakes are hiding, you need to look at the balance of their work.
Find the line named CrGPUMain, which shows the busyness of the GPU.

It can be seen that in each frame both the CPU in the CrRendererMain and the GPU work. The picture shows a very simple case when both processors are idle most of the time.
This schedule becomes useful when your game starts to really slow down, and you are not sure which of its resources is missing. Take the previous example and add the load for the update loop.
console.time("update"); doExtraWork(); update(Math.min(50, now - time)); console.timeEnd("update"); console.time("render"); render(); console.timeEnd("render"); Now the trace looks like this:

What does it mean? The frame takes in time from the time of 2270ms to the time of 2320ms, that is, each of them is rendered at 50 ms (frequency 20 Hz). Long narrow stripes represent the render function next to the update rectangle, but mostly all the time is occupied by the update function itself.
At the same time, it is clear that the GPU rests almost all the time. To optimize the code, you need to look for those operations that can be done through shaders, and give them to the GPU.
But what if the shader code slows down and overloads the GPU? Let's remove unnecessary work from the CPU and add work to the shaders. Here is an example of useless shader loading:
#ifdef GL_ES precision highp float; #endif void main(void) { for(int i=0; i<9999; i++) { gl_FragColor = vec4(1.0, 0, 0, 1.0); } } How then does the code trace look like?

Note the frame duration. From 2750 ms to 2950 ms, that is 200 ms (5 Hz). The CrRendererMain line is almost empty, that is, the CPU is resting, and the GPU is overloaded. This is a clear sign of shader congestion.
Life examples
Check what the real game tracking data looks like. One of the great features of open source technology is that you can delve into your favorite products. You can take any game on WebGL from the Chrome Web Store and profile it through about: tracing. Here is an example of the Skid Racer tracing game:

Apparently, each frame is rendered 20 ms, that is, the frequency is about 50 Hz. You can see how balanced the work is between the CPU and the GPU, but the GPU works more. Try using real-world examples to study the tracing of the following products from the Chrome Web Store:
Conclusion
If you want your game to go with an FPS of 60 Hz, each frame of it must be created no more than 16 ms in both CPU and GPU time. These two resources can be used in parallel, and work can be divided between them to maximize productivity.
What's next?
In addition to the GPU, you can track and other components of Chrome. Read the Chromium article to better understand the current traceability of Chrome.
WebGL game developers recommend watching the following video - this is the presentation of the Google's Game Developer Advocate team from GDC 2012 about optimizing game performance for Chrome:
Source: https://habr.com/ru/post/264639/
All Articles