Optimize the Android game mTricks Looting Crown for the Intel Atom platform
The most popular category of mobile apps is games. In the old days, the capabilities of processors and graphic accelerators of portable devices were very limited, which affected their performance. As a result, most of the games had to be made fairly simple. Today, the computing power of smartphones and tablets has grown significantly, which means that it has become possible to create high-quality, resource-intensive games. However, mobile CPUs and GPUs are still inferior to those installed in personal computers.
The growth of the mobile application market has led many PC game manufacturers to create games for mobile platforms. However, traditional approaches to designing games do not work well in a mobile environment. The same applies to the graphics resources of PC games, which are too “heavy” for mobile hardware.

')
In this article, you will learn how to analyze and improve mobile game performance and how to optimize graphics resources for mobile platforms.
All this we consider the example of the game mTricks Looting Crown. IA-version of the game has already been published, here is a link to it .

Game mTricks Looting Crown.
The company mTricks has extensive experience in the development of computer games using various commercial engines. Planning the next project, the company's experts, given the growth in mobile device performance, predicted the readiness of the mobile market for complex MMORPGs. As a result, the company has aimed its new project at mobile platforms, and not at ordinary computers.
For starters, mTricks transferred its PC-based experience to Android. However, the performance of the solution left much to be desired. In particular, one of the hardware platforms on which the development was oriented was devices based on Intel Atom (Bay Trail) processors.
The mTricks company faced two problems that usually arise before PC developers moving on to the creation of mobile applications.
Looting Crown is the so-called SNRPG (Social Network + RPG), that is, a role-playing game with social network functions. It supports three-dimensional graphics and various multiplayer game modes (PvP, PvE, Clan vs Clan). In developing and optimizing the game, mTricks used a reference device built on the Bay Trail platform. Below are the technical specifications of this device.
Device characteristics and test results
The company mTricks in the development of the game used Intel Graphics Performance Analyzers (Intel GPA) to find bottlenecks in the CPU and GPU. The results of the analysis were used to solve problems with graphic resources and performance.
The reference point from which the optimization and performance analysis was started was 23 frames per second (FPS, Frame per Second). Below are the graphics core loading characteristics (GPU Busy) and processor load statistics generated by the application (Target App CPU Load). Data received in 2 minutes of the application. The average load of the graphics core was 91%. The load on the processor was about 27%.

The reference point for measuring the load on the processor and graphics core. Data obtained using Intel GPA System Analyzer.
There are two ways to find out what exactly is the bottleneck of the system: CPU or GPU. One of them is to use override modes. The second implies a change in the CPU clock frequency.
One of the bypass modes provided in the Intel GPA System Analyzer is Disable Draw Calls mode. It helps to understand whether the processor or video core is the bottleneck of the system. After testing in this mode, it is necessary to compare the results obtained with those obtained in the standard state of the system. The following table will help to interpret these results.
How to analyze games using the bypass mode Disable Draw Calls
Intel GPA System Analyzer allows you to explore the performance of an application with different CPU settings. This is very useful in finding bottlenecks. In order to determine whether the game's performance is tied to the CPU, you need to do the following:

Modification of the processor frequency in the Platform Settings panel.
The following table shows the results of experiments with Looting Crown. In Disable Draw Calls mode, the frame rate does not change. This leads to the conclusion that the performance of the game is tied to the CPU. However, when setting the maximum possible processor frequency (Highest CPU Frequency mode), the FPS also does not change. This, in turn, suggests that the performance of the Looting Crown is tied to the video core. In order to resolve this contradiction, we must return to the reference point of measurement, to the data on the load on the processor and video core, which we cited above. Namely, we see that on the reference device built on the Bay Trail platform, the video core is loaded by 91%, and the processor - by 27%. As a result, the processor cannot reach its full potential as long as the video chip runs at its limit. The GPU, in our case, is the bottleneck of the system. Therefore, for a start, we will start optimizing the use of the video core, after which we will repeat testing.
FPS measurement results in various modes
As already mentioned, we found out that the bottleneck of the game is in the GPU. Let's analyze the situation with the help of Intel GPA Frame Analyzer. Here is the frame information for the reference measurement point.

View data using Intel GPA Frame Analyzer.
We reduced the number of calls to the drawing function by combining hundreds of static grids into one and applying larger textures.
Consider the performance before optimization and after. In measurements, we use a unit of measurement called erg (erg). Erg is a command that performs some work on the graphics core during frame output. For example, ergs are functions of drawing, cleaning, other calls to the graphic API.
Reference Measurement Indicators
Estimated cost of displaying the image for the reference point of measurement
The total time of the “Terrain” output is 20 ms, while on the “Grass”, with which this “Terrain” is overgrown, is 18 ms. This is about 90% of the time required to process the “Earth”. Therefore, we continue the analysis in order to understand why the conclusion of the “Grass” takes so much time.

The process of building "terrain".

Texture "Grass".
Looting Crown fills most of the "land" with small squares of "grass." As a result, the number of calls to the drawing function in the “Terrain” column (in the table below) is 960. The time for drawing one such fragment is very small. However, the output of all fragments overload the system. A relatively simple operation consumes an unreasonably large amount of resources. Therefore, we stopped at the need to reduce the number of calls to the drawing function by combining several hundred static grids into one. In addition, we decided to use a larger texture. Here is what happened after this optimization:
Comparing the cost of image output when using small and large textures

Changed "Terrain".
The derivation of a “terrain” consisting of small-sized textures requires a large number of drawing function calls. Therefore, we have reduced the number of such calls and saved 12 milliseconds at the conclusion of the “grass”.
Here are the results obtained when using a large texture for “Grass”.
Performance data obtained after the first optimization
Estimating the cost of displaying the image after the first optimization
After the first pass of optimization, we again checked whether the performance of the game is tied to the GPU. The same measurements as before were performed in the Disable Draw Calls and Highest CPU Frequency modes.
FPS measurement results after the first optimization
The table shows that when the drawing functions are disabled, the FPS grows, and when setting the maximum processor frequency, it does not change. This suggests that the performance of Looting Crown is still tied to the graphics core. In addition, we again checked the load that the game creates on the CPU and GPU.

The load on the processor and the graphics core after the first optimization. Data obtained using Intel GPA System Analyzer.
Here you can see that on the reference system built on the Bay Trail platform, the processor load is about 13%, while the graphics core is loaded at 99%. Thus, the optimization regarding the use of the CPU will not increase the performance of the game until we figure out how to overload the video core.
Looting Crown was originally created for the PC. Its graphics resources are not suitable for mobile devices that have less powerful CPUs and GPUs than desktop devices. Therefore, we have subjected the graphic resources of a series of optimizations.
1. Minimizing Draw Calls
From 10 to 2 reduced the number of materials objects.
Reduced the number of layers of particles.
2. Reduced the number of polygons
With the help of Simplygon reduced the level of detail (LOD, Level Of Details) characters.
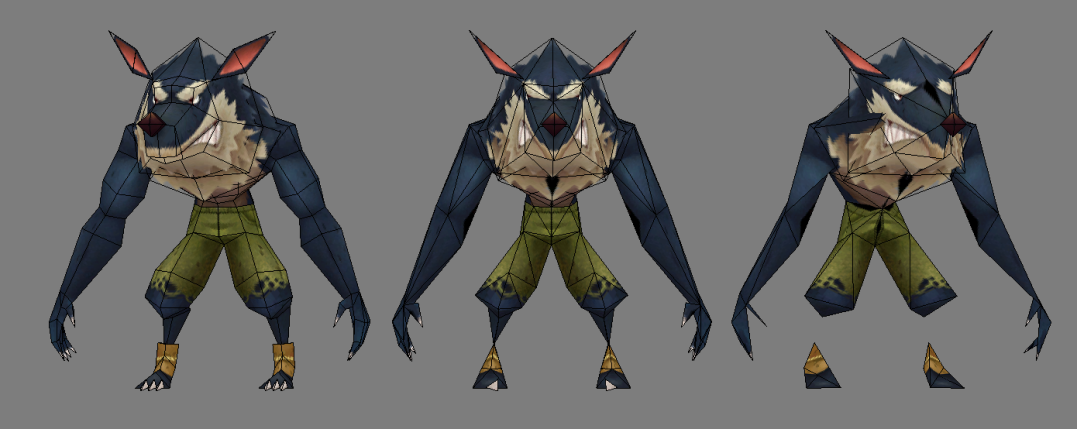
Character at different stages of reducing the level of detail.
The number of polygons used to display "terrain" has been reduced. To begin with, we reduced the detail of the mountains, which are located far away and do not require high detail. Then they reduced the number of polygons for a flat "earth", for which modeling a pair of triangles is enough.
3. Optimized lighting maps used.
Disable dynamic lighting for "Time of Day."
The size of the irradiance map for each of the grids is minimized, in particular, for the background.
4. Minimized change in the state of rendering elements.
Reduced the number of materials, which reduced the number of changes in the state of rendering elements and changes in textures.
5. Separated animated parts of static grids.
The Havoc engine that was used to create the game does not support updating only the area of the object that is being animated. If the object has only a small part of it, then it is, all the same, updated entirely. In order to cope with this, we separated the moving parts (smoke, highlighted by a red circle in the following figure) from the fixed part of the objects. The result was two separate models of game objects.

Separating animated smoke from a static grid.
When a 3D video card displays objects, a three-dimensional scene (the points at which have x, y, z coordinates) is projected onto a plane (transition to the x, y coordinate model). In order to save information about the depth of each pixel (that is, the z-coordinate data), a so-called Z-buffer or depth buffer is used. If at the same point of the plane you need to display two three-dimensional objects, the GPU compares the data by the depths of these objects. The video core will overwrite the current pixel if the new object is closer to the observer than the previous one. Thus, the use of Z-buffer allows you to correctly reproduce the usual depth of space. Z-clipping technique (Z-culling) consists in the fact that at first those objects that are located closer are drawn, they overlap distant objects, which are not necessary to be drawn only in order to “paint over” later. Z-clipping can improve performance when rendering hidden surfaces.
In Looting Crown, part of the terrain is covered by the ocean, and part by grass. Most of the ocean is behind the grass, that is, these areas are hidden. However, the ocean is derived earlier than grass, which does not effectively apply Z-clipping. Below are the data from the analysis of the operating time of the GPU at the conclusion of the ocean and grass. Drawing on the ocean requires 18 ergs, on the grass - 19. If the grass was displayed before the ocean, then, since it is located closer to the viewer, most of the pixels of the ocean simply would not need to be displayed. This would lead to a decrease in the time it takes the GPU to draw objects. After the second optimization, as shown in the corresponding figure, the operating time of the GPU during the output of the ocean decreased from 6 ms. up to 0.3 ms

The cost of drawing the ocean after the first optimization.

The cost of drawing grass after the first optimization.

The cost of drawing the ocean after the second optimization.
By taking the steps above, mTricks has optimized all graphics resources for mobile devices. At the same time managed to maintain a high level of quality. The number of ergs was reduced from 1726 to 124. The number of primitives decreased from 122204 to 9525.

Changes in graphic resources.
Below are the optimization results. So, after all the improvements, the FPS index changed from 23 to 60 frames per second on a device built on the Bay Trail platform.

Increased FPS during optimization.
Change FPS, load on GPU and CPU
After the first optimization, the analysis of the game on the Bay Trail device showed that its performance is still tied to the GPU. The purpose of the second optimization was to reduce the load on the graphics core due to optimization of graphics resources and more efficient use of the Z-buffer. As a result, we managed to achieve 60 frames per second. Since Android uses Vsync, 60 FPS is the maximum that is achievable on this platform.
If you want to analyze your own Android application using Intel tools, you will need the appropriate tools. In particular, a full-fledged working environment for creating and analyzing Android applications can be organized using Intel INDE and Intel GPA . Intel GPA can be installed either independently or with the INDE installation.
When booting Intel GPA, you need to select a file that matches your work environment and the platform on which you plan to do graphics research. In our case, provided that Windows is used as the OS of the computer on which the development is being performed, the Windows 7 / 8.1 (x64) Graphics Frame Analyzer for OpenGL package is selected.
Let's see how to start analyzing applications using the Intel Graphics Frame Analyzer for OpenGL. Before carrying out the analysis, you need to prepare the application accordingly. Namely, in the AndroidManifest.xml file, you need to enter the following permission:
Also, in the <application> section of this file, you need to enable the debugging feature of the application:
Without such preparation, even if you install a debug-version of the application on your device, the Graphics Frame Analyzer will not be able to work with it. In addition, it is important that the device is determined by ADB.
Once the application is installed on an Android device, you can run the Graphics Frame Analyzer for OpenGL. If you see a mobile device connected to a computer in the title of the application window, then everything has been done correctly up to this point. Now you can use the Add button, which is located in the working area of the window.
The Graphics Frame Analyzer will perform a device analysis and, in the Analyzable applications section, show a list of applications that can be analyzed.

List of applications received from the device.
In our case, the tablet is Asus Fonepad 8 with an Intel Atom Z3530 CPU. Android 5.0 is installed on the device.
The list contains an application example of working with OpenGL, which is prepared as stated above. The original application can be found here . In addition, you can download a project in which all the necessary settings are made.
After double-clicking on the application icon in the left part of the program window, the Capture button will appear. After clicking on this button, the application data will be captured and a thumbnail will appear in the right-hand part of the window, corresponding to the application screen. Clicking on this thumbnail opens the page with a list of the results of previous tests. On this page, click on the desired icon - and we get to the window, where the results of the analysis are presented.

Analysis results window.
Starting to optimize the game, first determine the bottlenecks. Intel GPA is able to help in this matter. It gives the developer powerful analytical tools. If game performance is tied to a CPU, valuable information can be obtained using the Intel VTune Amplifier. If the performance of the game "rests" in the possibility of a GPU, you can search for bottlenecks using Intel GPA.
In order to fix the problems of the game, tied to the GPU, it is worthwhile to look for effective ways to reduce calls to the drawing function, the number of polygons, changes in the state of the rendering elements. In addition, you can check the dimensions of the terrain textures, the animation of objects, the irradiance maps, find out whether the work with the Z-buffer is organized properly.
The growth of the mobile application market has led many PC game manufacturers to create games for mobile platforms. However, traditional approaches to designing games do not work well in a mobile environment. The same applies to the graphics resources of PC games, which are too “heavy” for mobile hardware.
')
In this article, you will learn how to analyze and improve mobile game performance and how to optimize graphics resources for mobile platforms.
All this we consider the example of the game mTricks Looting Crown. IA-version of the game has already been published, here is a link to it .
Game mTricks Looting Crown.
1. Preliminary information
The company mTricks has extensive experience in the development of computer games using various commercial engines. Planning the next project, the company's experts, given the growth in mobile device performance, predicted the readiness of the mobile market for complex MMORPGs. As a result, the company has aimed its new project at mobile platforms, and not at ordinary computers.
For starters, mTricks transferred its PC-based experience to Android. However, the performance of the solution left much to be desired. In particular, one of the hardware platforms on which the development was oriented was devices based on Intel Atom (Bay Trail) processors.
The mTricks company faced two problems that usually arise before PC developers moving on to the creation of mobile applications.
- PC-based graphics resources and design approaches are not suitable for mobile applications. The thing is that mobile processors and video cards are still lagging behind similar components of personal computers.
- Mobile devices create on the basis of a wide range of components that have different characteristics. This includes the computational capabilities of the CPU and GPU, the amount of RAM, and the screen size. As a result, various resources are available to the various target platforms, which affects the appearance and performance of the application.
2. The main provisions
Looting Crown is the so-called SNRPG (Social Network + RPG), that is, a role-playing game with social network functions. It supports three-dimensional graphics and various multiplayer game modes (PvP, PvE, Clan vs Clan). In developing and optimizing the game, mTricks used a reference device built on the Bay Trail platform. Below are the technical specifications of this device.
Device characteristics and test results
| Indicator | Characteristic of the device (screen diagonal - 10 inches) |
| CPU | Intel Atom Quad Core 1.46 Ghz |
| Ram | 2Gb |
| Screen resolution | 2560 x 1440 |
| Points in the test 3DMark ICE Storm Unlimited | 15094 |
| Graphics test | 13928 |
| Physical effects test | 21348 |
The company mTricks in the development of the game used Intel Graphics Performance Analyzers (Intel GPA) to find bottlenecks in the CPU and GPU. The results of the analysis were used to solve problems with graphic resources and performance.
The reference point from which the optimization and performance analysis was started was 23 frames per second (FPS, Frame per Second). Below are the graphics core loading characteristics (GPU Busy) and processor load statistics generated by the application (Target App CPU Load). Data received in 2 minutes of the application. The average load of the graphics core was 91%. The load on the processor was about 27%.
The reference point for measuring the load on the processor and graphics core. Data obtained using Intel GPA System Analyzer.
3. Who is to blame, the processor or video core?
There are two ways to find out what exactly is the bottleneck of the system: CPU or GPU. One of them is to use override modes. The second implies a change in the CPU clock frequency.
One of the bypass modes provided in the Intel GPA System Analyzer is Disable Draw Calls mode. It helps to understand whether the processor or video core is the bottleneck of the system. After testing in this mode, it is necessary to compare the results obtained with those obtained in the standard state of the system. The following table will help to interpret these results.
How to analyze games using the bypass mode Disable Draw Calls
| Performance Change in Disable Draw Call Mode | Interpretation |
| FPS changes slightly | The speed of the game is tied to CPU performance. Use the tools of the Intel GPA Platform Analyzer or the Intel VTune Amplifier to find out which functions are the most stressful for the system. |
| FPS is noticeably improving | The speed of the game is tied to the performance of the GPU. Use the Intel GPA Frame Analyzer to find out which requests for image output take the most time. |
Intel GPA System Analyzer allows you to explore the performance of an application with different CPU settings. This is very useful in finding bottlenecks. In order to determine whether the game's performance is tied to the CPU, you need to do the following:
- Make sure that the frame rate of your application is not tied to vertical sync (Vertical Sync, Vsync). To do this, take a look at the Intel GPA System Analyzer notification bar. If this mode is enabled, you will see the word Vsync highlighted in gray:

- Try setting different CPU frequencies using the sliders on the Platform Settings panel in the Intel GPA System Analyzer window. If the FPS changes as the processor frequency changes, it’s very likely that the application’s performance is tied to the CPU
Modification of the processor frequency in the Platform Settings panel.
The following table shows the results of experiments with Looting Crown. In Disable Draw Calls mode, the frame rate does not change. This leads to the conclusion that the performance of the game is tied to the CPU. However, when setting the maximum possible processor frequency (Highest CPU Frequency mode), the FPS also does not change. This, in turn, suggests that the performance of the Looting Crown is tied to the video core. In order to resolve this contradiction, we must return to the reference point of measurement, to the data on the load on the processor and video core, which we cited above. Namely, we see that on the reference device built on the Bay Trail platform, the video core is loaded by 91%, and the processor - by 27%. As a result, the processor cannot reach its full potential as long as the video chip runs at its limit. The GPU, in our case, is the bottleneck of the system. Therefore, for a start, we will start optimizing the use of the video core, after which we will repeat testing.
FPS measurement results in various modes
| Mode | FPS |
| Usual | 23 |
| Disable Draw Calls | 23 |
| Highest CPU Frequency | 23 |
4. Search for GPU bottlenecks
As already mentioned, we found out that the bottleneck of the game is in the GPU. Let's analyze the situation with the help of Intel GPA Frame Analyzer. Here is the frame information for the reference measurement point.
View data using Intel GPA Frame Analyzer.
4.1. Reducing the number of calls to the paint function
We reduced the number of calls to the drawing function by combining hundreds of static grids into one and applying larger textures.
Consider the performance before optimization and after. In measurements, we use a unit of measurement called erg (erg). Erg is a command that performs some work on the graphics core during frame output. For example, ergs are functions of drawing, cleaning, other calls to the graphic API.
Reference Measurement Indicators
| Indicator | Value |
| Total number of ergs | 1726 |
| Total number of primitives | 122204 |
| GPU duration, ms | 23 |
| The time required to display the frame, ms | 48 |
Estimated cost of displaying the image for the reference point of measurement
| Type of transaction | Number of ergs | Time, ms | % |
| Cleaning | 0 | 0.2 | 0.5 |
| Ocean | one | 6 | 13.7 |
| Terrain | 2 ~ 977 | 20 | 41.9 |
| Grass | 19 ~ 977 | 18 | 39.0 |
| Character, buildings, effects | 978 ~ 1676 | nineteen | 40.6 |
| User interface | 1677 ~ 1725 | one | 3.4 |
The total time of the “Terrain” output is 20 ms, while on the “Grass”, with which this “Terrain” is overgrown, is 18 ms. This is about 90% of the time required to process the “Earth”. Therefore, we continue the analysis in order to understand why the conclusion of the “Grass” takes so much time.
The process of building "terrain".
Texture "Grass".
Looting Crown fills most of the "land" with small squares of "grass." As a result, the number of calls to the drawing function in the “Terrain” column (in the table below) is 960. The time for drawing one such fragment is very small. However, the output of all fragments overload the system. A relatively simple operation consumes an unreasonably large amount of resources. Therefore, we stopped at the need to reduce the number of calls to the drawing function by combining several hundred static grids into one. In addition, we decided to use a larger texture. Here is what happened after this optimization:
Comparing the cost of image output when using small and large textures
| Indicator | Value |
| Small texture, ms. | 18 |
| Number of ergs | 960 |
| Large texture, ms. | 6 |
| Number of ergs | one |
Changed "Terrain".
The derivation of a “terrain” consisting of small-sized textures requires a large number of drawing function calls. Therefore, we have reduced the number of such calls and saved 12 milliseconds at the conclusion of the “grass”.
4.2. Graphics resource optimization
Here are the results obtained when using a large texture for “Grass”.
Performance data obtained after the first optimization
| Indicator | Value |
| Total number of ergs | 179 |
| Total number of primitives | 27537 |
| The duration of the GPU, ms. | 24 |
| The time required to display the frame, ms. | 27 |
Estimating the cost of displaying the image after the first optimization
| Type of transaction | Number of ergs | Time, ms | % |
| Cleaning | 0 | 2 | 10.4 |
| Ocean | 18 | 6 | 23.6 |
| Terrain | 1 ~ 17, 19, 23 ~ 96 | 14 | 53.4 |
| Grass | nineteen | 6 | 23.2 |
| Character, buildings, effects | 20 ~ 22, 97 ~ 131 | one | 5.9 |
| User interface | 132 ~ 178 | one | 5.7 |
After the first pass of optimization, we again checked whether the performance of the game is tied to the GPU. The same measurements as before were performed in the Disable Draw Calls and Highest CPU Frequency modes.
FPS measurement results after the first optimization
| Mode | FPS |
| Usual | 40 |
| Disable Draw Calls | 60 |
| Highest CPU Frequency | 40 |
The table shows that when the drawing functions are disabled, the FPS grows, and when setting the maximum processor frequency, it does not change. This suggests that the performance of Looting Crown is still tied to the graphics core. In addition, we again checked the load that the game creates on the CPU and GPU.
The load on the processor and the graphics core after the first optimization. Data obtained using Intel GPA System Analyzer.
Here you can see that on the reference system built on the Bay Trail platform, the processor load is about 13%, while the graphics core is loaded at 99%. Thus, the optimization regarding the use of the CPU will not increase the performance of the game until we figure out how to overload the video core.
Looting Crown was originally created for the PC. Its graphics resources are not suitable for mobile devices that have less powerful CPUs and GPUs than desktop devices. Therefore, we have subjected the graphic resources of a series of optimizations.
1. Minimizing Draw Calls
From 10 to 2 reduced the number of materials objects.
Reduced the number of layers of particles.
2. Reduced the number of polygons
With the help of Simplygon reduced the level of detail (LOD, Level Of Details) characters.
Character at different stages of reducing the level of detail.
The number of polygons used to display "terrain" has been reduced. To begin with, we reduced the detail of the mountains, which are located far away and do not require high detail. Then they reduced the number of polygons for a flat "earth", for which modeling a pair of triangles is enough.
3. Optimized lighting maps used.
Disable dynamic lighting for "Time of Day."
The size of the irradiance map for each of the grids is minimized, in particular, for the background.
4. Minimized change in the state of rendering elements.
Reduced the number of materials, which reduced the number of changes in the state of rendering elements and changes in textures.
5. Separated animated parts of static grids.
The Havoc engine that was used to create the game does not support updating only the area of the object that is being animated. If the object has only a small part of it, then it is, all the same, updated entirely. In order to cope with this, we separated the moving parts (smoke, highlighted by a red circle in the following figure) from the fixed part of the objects. The result was two separate models of game objects.
Separating animated smoke from a static grid.
4.3. Effective Z-clipping application
When a 3D video card displays objects, a three-dimensional scene (the points at which have x, y, z coordinates) is projected onto a plane (transition to the x, y coordinate model). In order to save information about the depth of each pixel (that is, the z-coordinate data), a so-called Z-buffer or depth buffer is used. If at the same point of the plane you need to display two three-dimensional objects, the GPU compares the data by the depths of these objects. The video core will overwrite the current pixel if the new object is closer to the observer than the previous one. Thus, the use of Z-buffer allows you to correctly reproduce the usual depth of space. Z-clipping technique (Z-culling) consists in the fact that at first those objects that are located closer are drawn, they overlap distant objects, which are not necessary to be drawn only in order to “paint over” later. Z-clipping can improve performance when rendering hidden surfaces.
In Looting Crown, part of the terrain is covered by the ocean, and part by grass. Most of the ocean is behind the grass, that is, these areas are hidden. However, the ocean is derived earlier than grass, which does not effectively apply Z-clipping. Below are the data from the analysis of the operating time of the GPU at the conclusion of the ocean and grass. Drawing on the ocean requires 18 ergs, on the grass - 19. If the grass was displayed before the ocean, then, since it is located closer to the viewer, most of the pixels of the ocean simply would not need to be displayed. This would lead to a decrease in the time it takes the GPU to draw objects. After the second optimization, as shown in the corresponding figure, the operating time of the GPU during the output of the ocean decreased from 6 ms. up to 0.3 ms
The cost of drawing the ocean after the first optimization.
The cost of drawing grass after the first optimization.
The cost of drawing the ocean after the second optimization.
results
By taking the steps above, mTricks has optimized all graphics resources for mobile devices. At the same time managed to maintain a high level of quality. The number of ergs was reduced from 1726 to 124. The number of primitives decreased from 122204 to 9525.
Changes in graphic resources.
Below are the optimization results. So, after all the improvements, the FPS index changed from 23 to 60 frames per second on a device built on the Bay Trail platform.
Increased FPS during optimization.
Change FPS, load on GPU and CPU
| Indicator | Reference point | First optimization | Second optimization |
| FPS | 23 | 45 | 60 |
| Download GPU,% | 91 | 99 | 71 |
| CPU load,% | 27 | 13 | 22 |
After the first optimization, the analysis of the game on the Bay Trail device showed that its performance is still tied to the GPU. The purpose of the second optimization was to reduce the load on the graphics core due to optimization of graphics resources and more efficient use of the Z-buffer. As a result, we managed to achieve 60 frames per second. Since Android uses Vsync, 60 FPS is the maximum that is achievable on this platform.
Getting Started with Intel Graphics Frame Analyzer for OpenGL
If you want to analyze your own Android application using Intel tools, you will need the appropriate tools. In particular, a full-fledged working environment for creating and analyzing Android applications can be organized using Intel INDE and Intel GPA . Intel GPA can be installed either independently or with the INDE installation.
When booting Intel GPA, you need to select a file that matches your work environment and the platform on which you plan to do graphics research. In our case, provided that Windows is used as the OS of the computer on which the development is being performed, the Windows 7 / 8.1 (x64) Graphics Frame Analyzer for OpenGL package is selected.
Let's see how to start analyzing applications using the Intel Graphics Frame Analyzer for OpenGL. Before carrying out the analysis, you need to prepare the application accordingly. Namely, in the AndroidManifest.xml file, you need to enter the following permission:
<uses-permission android:name="android.permission.INTERNET" /> Also, in the <application> section of this file, you need to enable the debugging feature of the application:
<application android:debuggable="true" ... > Without such preparation, even if you install a debug-version of the application on your device, the Graphics Frame Analyzer will not be able to work with it. In addition, it is important that the device is determined by ADB.
Once the application is installed on an Android device, you can run the Graphics Frame Analyzer for OpenGL. If you see a mobile device connected to a computer in the title of the application window, then everything has been done correctly up to this point. Now you can use the Add button, which is located in the working area of the window.
The Graphics Frame Analyzer will perform a device analysis and, in the Analyzable applications section, show a list of applications that can be analyzed.
List of applications received from the device.
In our case, the tablet is Asus Fonepad 8 with an Intel Atom Z3530 CPU. Android 5.0 is installed on the device.
The list contains an application example of working with OpenGL, which is prepared as stated above. The original application can be found here . In addition, you can download a project in which all the necessary settings are made.
After double-clicking on the application icon in the left part of the program window, the Capture button will appear. After clicking on this button, the application data will be captured and a thumbnail will appear in the right-hand part of the window, corresponding to the application screen. Clicking on this thumbnail opens the page with a list of the results of previous tests. On this page, click on the desired icon - and we get to the window, where the results of the analysis are presented.
Analysis results window.
findings
Starting to optimize the game, first determine the bottlenecks. Intel GPA is able to help in this matter. It gives the developer powerful analytical tools. If game performance is tied to a CPU, valuable information can be obtained using the Intel VTune Amplifier. If the performance of the game "rests" in the possibility of a GPU, you can search for bottlenecks using Intel GPA.
In order to fix the problems of the game, tied to the GPU, it is worthwhile to look for effective ways to reduce calls to the drawing function, the number of polygons, changes in the state of the rendering elements. In addition, you can check the dimensions of the terrain textures, the animation of objects, the irradiance maps, find out whether the work with the Z-buffer is organized properly.
Source: https://habr.com/ru/post/264511/
All Articles