Define key products using linear regression
Retail, after all, is an interesting thing. Especially if you develop a service for its analytics. Each trip to the store turns into a mini-study. You walk along the shelves and think:
“What is the best sausage correlated with ketchup or pickled cucumbers? Damn, okay, I take both, and that! ”
“Hoegaarden was almost sold out, and in fact there are still half a day until Friday evening. Eh, why are you so bad the demand is predicted? "
I wonder what managers are used to predict sales?
And sometimes you come to the retailers with this question, and in response, people say “Nuuuuu, usually something like that ...” and begin to make broad gestures with their hands. Yes, that's about, such as in the picture.
')

So, we at Datawiz.io , strongly disagree with this approach.
In the previous article on the correlation in retail, we looked at the possibilities of determining the impact of sales of product categories on others, and on the total turnover of the store.
But is it possible to more accurately find key products? What is the significance of sales of certain categories of goods and how exactly do they affect the turnover of the store?
Help linear models. We construct a simple equation that describes the structure of the store’s sales and which is easy to model.
We will use all the same source data for two stores: Grocery Store and Supermarket:
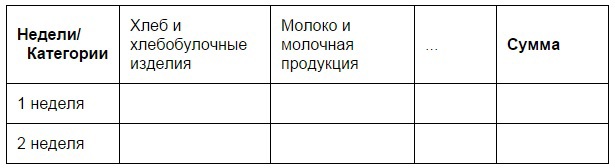
We make tables:
rows - weeks;
columns - categories;
cells - the number of goods sold or mentions in checks.
Apply:
We get a list of product categories for gastronomy:
We determine the necessary number of features to analyze the sales volume of the Deli .
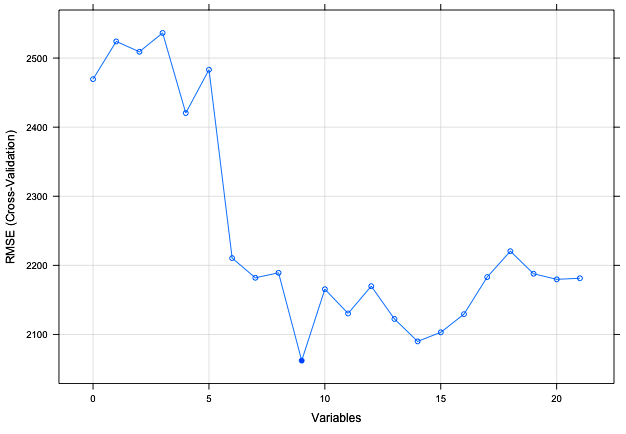
We can determine the most effective number of features for building a model. As you can see, using 9 is optimal, but top 6 will be convenient for us.
Use linear regression:
The model presents the coefficients of the value, the higher the coefficient 0, the more it affects the result.
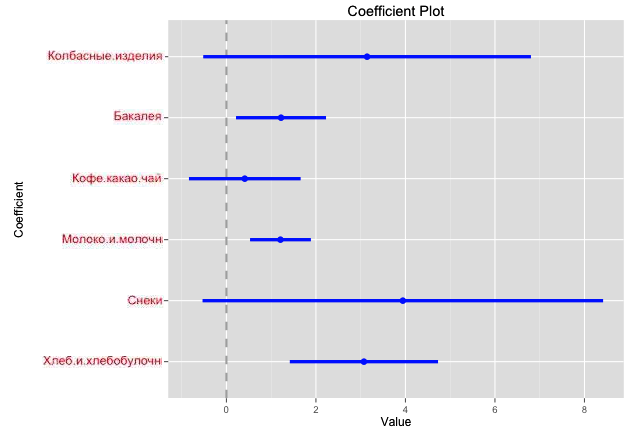
Using the data of the Deli we get the following formula:
Turnover + - 1277 = 5530 + 3.2 * Bread and bakery products + 4.6 * Snacks +1.18 * Milk and dairy products + 0.0934 * Coffee, cocoa, tea + 1.23 * Groceries + 3.58 * Sausages
After analyzing it, we see that the category “Coffee, cocoa, tea” has too little effect on the result, which means we can eliminate it without loss of accuracy.
We get:
Turnover + - 1277 = 5530 + 3.2 * Bread and bakery products + 4.6 * Snacks +1.18 * Milk and dairy products + 1.23 * Groceries + 3.58 * Sausages
So, now we see the products of which categories significantly affect the turnover of the selected store. Any fluctuations in their sales will significantly affect the final result.
If we want to consider the effect of product categories not on turnover, but on the number of checks, we use other data on the number of references to goods in checks.
Determine the right amount of features to analyze the number of checks at the Deli
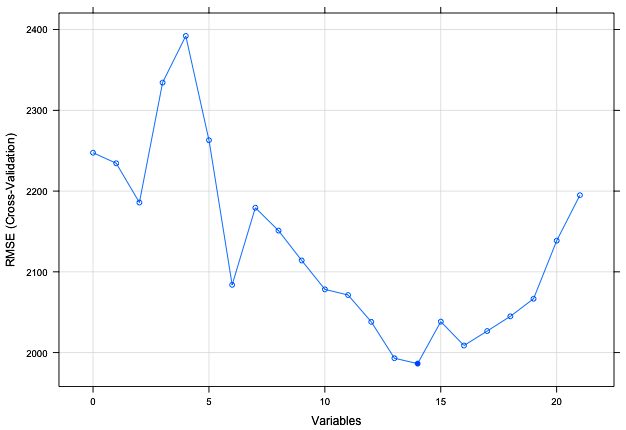
Use 6 variables.
We get this equation
receipt_qty + -1017 = 840 + 3.79 * Bread and Bakery Products + 3.29 * Snacks + 0.7 * Grocery + 0.92 * Milk and Dairy Products + 0.14 * Confectionery +2.358 * Sausages
Compare 2 equations of turnover and the number of mentions in checks for gastronom
Turnover + - 1277 = 5530 + 3.2 * Bread and bakery products + 4.6 * Snacks +1.18 * Milk and dairy products + 1.23 * Groceries + 3.58 * Sausages
and
receipt_qty + -1017 = 840 + 3.79 * Bread and Bakery Products + 3.29 * Snacks + 0.7 * Grocery + 0.92 * Milk and Dairy Products + 0.14 * Confectionery +2.358 * Sausages
The coefficients in the first equation are significantly higher than in the second, which means that an increase in sales of these categories of goods will have a greater effect on the turnover of the store than on the number of checks. But at the same time, the number of checks may be affected by an increase in sales of Confectionery, albeit with a small factor. The data obtained can and should be actively used.
At the same time, the situation in another store may differ significantly.
Analyze the results of the supermarket
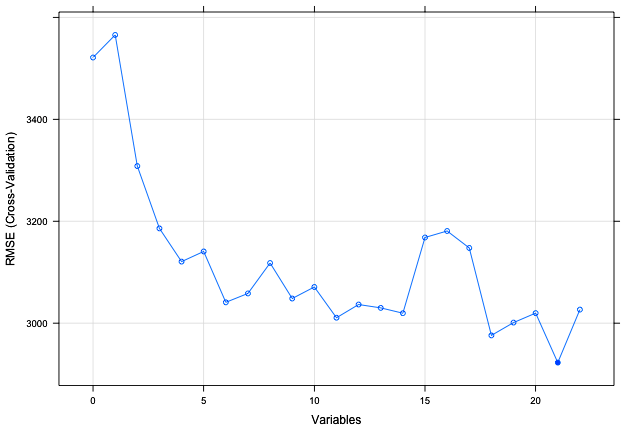
Choosing products for the analysis of turnover at the supermarket.
We use 3 features.
Turnover + - 3097 = -1612.10 + 27.77 * Diabetic nutrition + 5.24 * Bread and bakery products + 1.44 * Preserved
An interesting selection of products, what it means is discussed below.
Data on the number of references to goods in checks at the supermarket
If we look at the situation in the supermarket, we will see a situation that is clearly different from the Deli.
Turnover + - 3097 = -1612.10 + 27.77 * Diabetic nutrition + 5.24 * Bread and bakery products + 1.44 * Preserved
and
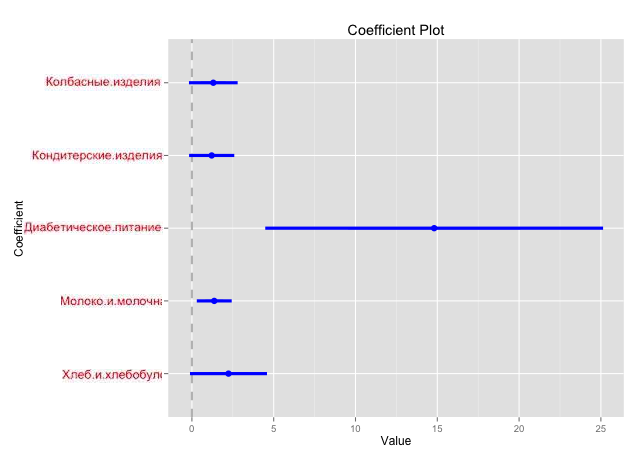
Receipt_qty + -1839 = 270.43 + 2.24 * Bread and Bakery Products + 1.37 * Milk and Dairy Products + 14.81 * Diabetic Nutrition + 1.21 * Confectionery + 1.31 * Sausage Products
Only 3 categories of products affect the turnover of the store, and Diabetic nutrition especially, is almost 5 times more than Bread and bakery products. How could this happen? We also became interested. We dug deeper, looking at the list of products included in the supermarket in this category. Everything turned out to be very simple. In the category of Diabetic Nutrition, the Supermarket included the entire line of baby food, which, naturally, significantly increased sales of this particular category.
But the number of checks on the supermarket affects already 5 categories of goods. But, for example, Conservation affects the turnover of the store, but does not affect the number of checks. Confectionery and Sausages affect the number of checks, but less so on the total turnover of the store.
What is the essence? All the examples used in the article are quite simple, but their practical application gives a lot of room for analysis, sales forecast, retailer planning, stock organization, ... Not only one or two stores, but the entire retail chain.
So let's approach the forecasting process in retail not only creatively, but also analytically. Sincerely, Datawiz.io .
“What is the best sausage correlated with ketchup or pickled cucumbers? Damn, okay, I take both, and that! ”
“Hoegaarden was almost sold out, and in fact there are still half a day until Friday evening. Eh, why are you so bad the demand is predicted? "
I wonder what managers are used to predict sales?
And sometimes you come to the retailers with this question, and in response, people say “Nuuuuu, usually something like that ...” and begin to make broad gestures with their hands. Yes, that's about, such as in the picture.
')
So, we at Datawiz.io , strongly disagree with this approach.
In the previous article on the correlation in retail, we looked at the possibilities of determining the impact of sales of product categories on others, and on the total turnover of the store.
But is it possible to more accurately find key products? What is the significance of sales of certain categories of goods and how exactly do they affect the turnover of the store?
Help linear models. We construct a simple equation that describes the structure of the store’s sales and which is easy to model.
We will use all the same source data for two stores: Grocery Store and Supermarket:
- sales of goods of a certain category;
- the number of mentions in the checks of goods of a certain category.
We make tables:
rows - weeks;
columns - categories;
cells - the number of goods sold or mentions in checks.
Apply:
feature_selection <- function(df){ drops <- c('.','','.') df <- df[,!names(df) %in% drops] control <- rfeControl(functions=rfFuncs, method="cv", number=10) results <- rfe(df[1:ncol(df)-1], df$sum, sizes=c(1:ncol(df)-1), rfeControl=control) return(results) } results <- feature_selection(df=Gastronom_df) predictors(results) plot(results, type=c("g", "o")) output We get a list of product categories for gastronomy:
- Bread and Bakery Products
- Snacks
- Milk and dairy products
- Coffee, cocoa, tea
- Grocery
- Sausages
- Preservation
- Confectionery
- Soft drinks
- Meat
- Diabetic nutrition
- Tobacco products
- Related Food Products
- Frost
- Vegetable oil
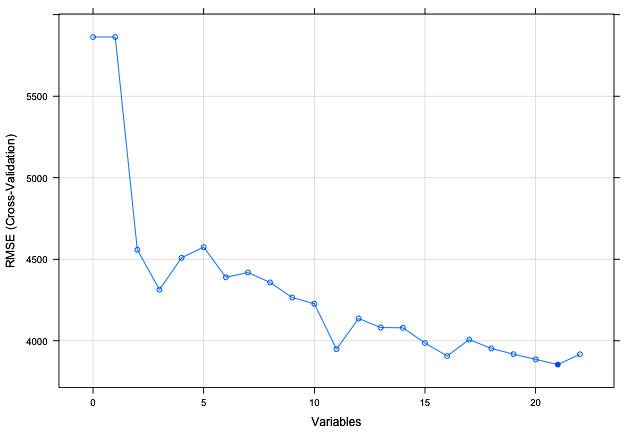
We determine the necessary number of features to analyze the sales volume of the Deli .
We can determine the most effective number of features for building a model. As you can see, using 9 is optimal, but top 6 will be convenient for us.
create formula Gastronom_formula <- sum~ + + + , , + + Use linear regression:
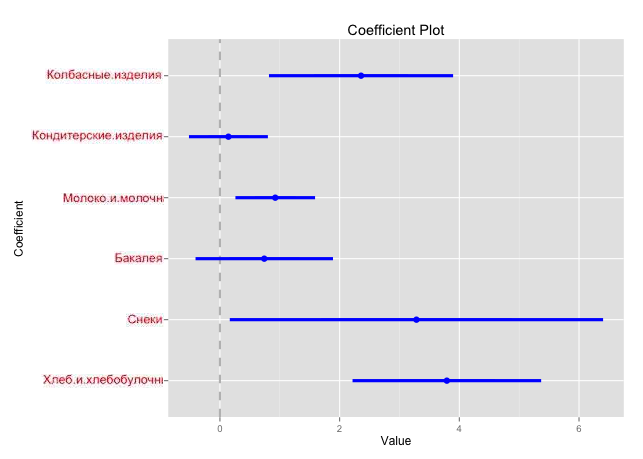
Gastronom_lm <- linear_models(Gastronom_formula,Gastronom_df) coefplot(Gastronom_lm, intercept=FALSE, outerCI=1.96, lwdOuter=1.5) The model presents the coefficients of the value, the higher the coefficient 0, the more it affects the result.
cv.lm(df=Gastronom_df, Gastronom_lm, m=10) #run cross validation test > sqrt(1629697) #mse [1] 1277 #square root from mse Print coefficients >Gastronom_lm$coefficients (Intercept) 5.53e+02 3.20e+00 4.60e+00 1.18e+00 , , 9.34e-03 1.23e+00 3.58e+00 Using the data of the Deli we get the following formula:
Turnover + - 1277 = 5530 + 3.2 * Bread and bakery products + 4.6 * Snacks +1.18 * Milk and dairy products + 0.0934 * Coffee, cocoa, tea + 1.23 * Groceries + 3.58 * Sausages
After analyzing it, we see that the category “Coffee, cocoa, tea” has too little effect on the result, which means we can eliminate it without loss of accuracy.
We get:
Turnover + - 1277 = 5530 + 3.2 * Bread and bakery products + 4.6 * Snacks +1.18 * Milk and dairy products + 1.23 * Groceries + 3.58 * Sausages
So, now we see the products of which categories significantly affect the turnover of the selected store. Any fluctuations in their sales will significantly affect the final result.
If we want to consider the effect of product categories not on turnover, but on the number of checks, we use other data on the number of references to goods in checks.
Determine the right amount of features to analyze the number of checks at the Deli
- Bread and Bakery Products
- Snacks
- Grocery
- Milk and dairy products
- Confectionery
- Sausages
- Coffee, cocoa, tea
- Preservation
- Tobacco products
- Soft drinks
- Meat
- Related Food Products
- Diabetic nutrition
- Alcohol
Use 6 variables.
Gastronom_formula <- sum~ + + + + + > sqrt(1033597) [1] 1017 > Gastronom_lm$coefficients (Intercept) 840.105 3.792 3.283 0.741 0.924 0.142 2.358 We get this equation
receipt_qty + -1017 = 840 + 3.79 * Bread and Bakery Products + 3.29 * Snacks + 0.7 * Grocery + 0.92 * Milk and Dairy Products + 0.14 * Confectionery +2.358 * Sausages
Compare 2 equations of turnover and the number of mentions in checks for gastronom
Turnover + - 1277 = 5530 + 3.2 * Bread and bakery products + 4.6 * Snacks +1.18 * Milk and dairy products + 1.23 * Groceries + 3.58 * Sausages
and
receipt_qty + -1017 = 840 + 3.79 * Bread and Bakery Products + 3.29 * Snacks + 0.7 * Grocery + 0.92 * Milk and Dairy Products + 0.14 * Confectionery +2.358 * Sausages
The coefficients in the first equation are significantly higher than in the second, which means that an increase in sales of these categories of goods will have a greater effect on the turnover of the store than on the number of checks. But at the same time, the number of checks may be affected by an increase in sales of Confectionery, albeit with a small factor. The data obtained can and should be actively used.
At the same time, the situation in another store may differ significantly.
Analyze the results of the supermarket
Choosing products for the analysis of turnover at the supermarket.
- Diabetic nutrition
- Bread and Bakery Products
- Preservation
- Milk and dairy products
- Coffee, cocoa, tea
- Grocery
- Sausages
- Related Food Products
- Cakes and pies
- Goods for pets
- Eggs
- Frost
- Soft drinks
- Tobacco products
- Goods without VAT
- Confectionery
- Alcohol
- Vegetable oil
- Snacks
- Fish and seafood
- Meat
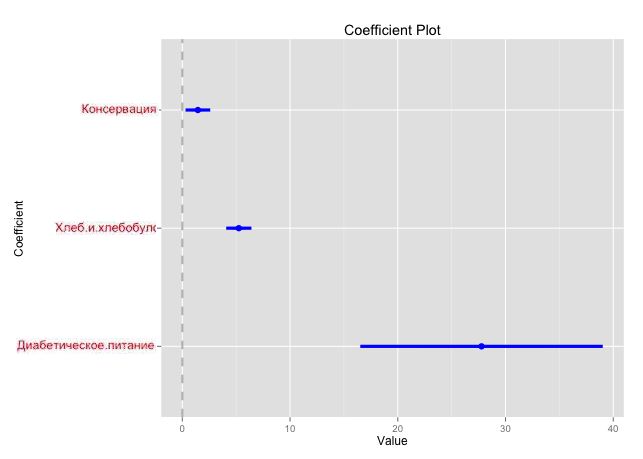
We use 3 features.
universam_formula = sum ~ + + + > sqrt(9591095) [1] 3097 > universam_lm$coefficients (Intercept) -1612.10 27.77 5.24 1.44 Turnover + - 3097 = -1612.10 + 27.77 * Diabetic nutrition + 5.24 * Bread and bakery products + 1.44 * Preserved
An interesting selection of products, what it means is discussed below.
Data on the number of references to goods in checks at the supermarket
- Bread and Bakery Products
- Milk and dairy products
- Diabetic nutrition
- Confectionery
- Sausages
- Preservation
- Coffee, cocoa, tea
- Grocery
- Eggs
- Cakes and pies
- Related Food Products
- Frost
- Snacks
- Tobacco products
- Soft drinks
- Vegetable oil
- Alcohol
- Goods without VAT
- Goods for pets
- Meat
- Fish and seafood
universam_formula = sum ~ + + + + > sqrt(3382240) [1] 1839 > universam_lm$coefficients (Intercept) 270.43 2.24 1.37 14.81 1.21 1.31 If we look at the situation in the supermarket, we will see a situation that is clearly different from the Deli.
Turnover + - 3097 = -1612.10 + 27.77 * Diabetic nutrition + 5.24 * Bread and bakery products + 1.44 * Preserved
and
Receipt_qty + -1839 = 270.43 + 2.24 * Bread and Bakery Products + 1.37 * Milk and Dairy Products + 14.81 * Diabetic Nutrition + 1.21 * Confectionery + 1.31 * Sausage Products
Only 3 categories of products affect the turnover of the store, and Diabetic nutrition especially, is almost 5 times more than Bread and bakery products. How could this happen? We also became interested. We dug deeper, looking at the list of products included in the supermarket in this category. Everything turned out to be very simple. In the category of Diabetic Nutrition, the Supermarket included the entire line of baby food, which, naturally, significantly increased sales of this particular category.
But the number of checks on the supermarket affects already 5 categories of goods. But, for example, Conservation affects the turnover of the store, but does not affect the number of checks. Confectionery and Sausages affect the number of checks, but less so on the total turnover of the store.
What is the essence? All the examples used in the article are quite simple, but their practical application gives a lot of room for analysis, sales forecast, retailer planning, stock organization, ... Not only one or two stores, but the entire retail chain.
So let's approach the forecasting process in retail not only creatively, but also analytically. Sincerely, Datawiz.io .
Source: https://habr.com/ru/post/264333/
All Articles