Data Science: the path to professionalism
Hello everyone!
In the wake of the incessant discussions about Hadoop and other big data, we could not pass by Jerry Overton's remarkable publication, which tells about a professional approach to analyzing big data in companies of any size. Clear images provided by the author, as well as a brief parade of technologies, without which the modern Data scientist is indispensable. Therefore, even if the article begins with the (erroneous!) Premise: “Do not read books on Data Science,” it deserves publication in the blog of our publishing house.
If among the esteemed readers there are those who want to discuss Hadoop and other technologies from its ecosystem, as well as the literature on specific algorithms mentioned by the author, let's talk about it in the comments.
')
My experience as a data researcher does not at all resemble stories that can be read in books and blogs. They talk about my colleagues who work in supergiants. They seem to be superheroes, they write automated (consider, animate) algorithms that produce a continuous stream of insights. I read about data explorers, crafty as agent MacGyver, able to save the day, extracting useful data from almost everything that surrounds them.
The data solutions developed by my team are not so critical as to build a huge infrastructure for the whole company for them. In our case, giant investments in ultra-efficient automation and production management simply would not pay off. On the other hand, our products influence important decisions made at the enterprise, and, most importantly, our decisions are scaled. We cannot afford to do everything manually all the time, and we need effective mechanisms to share the results of our work with tens of thousands of people.
There are many “most ordinary data researchers” in the world, such as us. We are more organized compared to hackers, but, unlike all superheroes, we do without the "secret headquarters." We just get together and brainstorm , during which we discuss the best ways to create a reliable code. This article outlines the quintessence of our conversations; I tried to collect our knowledge, cut off all unnecessary and briefly present our achievements in one publication.
How to become a professional
A data researcher must have the skills of a programmer — but not all that a programmer uses in his work. I call data researchers with fundamental skills in developing information products “datologist programmers.” Professionalism is not just a skill that can be backed up with a certificate or gained by experience; I mean professionalism as a course of action.
A professional research programmer is able to correct himself when developing solutions for working with data. He knows the general strategies that allow him to recognize where his product is clearly pumped up and how to fix the problem.
A professional data researcher should be able to turn a hypothesis into a program that would test this hypothesis. Such specialization is unique for the entire IT-sphere, since there are unique problems that data researchers have to deal with. The most important challenge is connected with the fact that the science of data is experimental in nature. Its tasks are often complex, and the data itself is messy. Strategies for solving many such problems have not yet been worked out, the path to a solution is not known in advance, and possible solutions are best explained as a sequence of small steps. Next, I will describe the basic strategies that fit into an organized and productive trial and error method. The problem is decomposed into small stages, solutions are tested, corrections are made in the course of work.
Think like a pro
To become a professional data programmer, it is not enough to know the general principles of structuring systems. You need to understand how to design a solution, be able to recognize when you have a solution, and also distinguish between cases in which you do not fully understand your own solution. The last point is critical so that you can adjust your own work. When you recognize fundamental gaps in your own approach, you can fill them in yourself. In order to choose such a solution to a data problem that can be corrected in the course of work, I prefer to adhere to the basic paradigm of “ watch, see, imagine, show ”.
Stage 1 : Watch. To get started, navigate the terrain. Do a preliminary study, familiarize yourself with all the components that may be associated with your task. Consider the problem in its widest context. Try to deal with the maximum number of aspects of the task, put in order the fragmented pieces of information.
Stage 2 : See. Take the above-mentioned fragmented fragments and summarize them in the form of abstractions corresponding to the elements of the blackboard pattern . At this stage, you will transform the elements of the problem into meaningful technical concepts. The vision of the problem is the most important preparatory step towards the creation of a viable project.
Stage 3 : Imagine. Based on the technical concepts that you already see at this stage, imagine an implementation that will allow you to go from the initial state to the target state. If you can’t imagine the implementation, you probably missed something when considering the problem.
Stage 4 : Show. Explain the resulting solution, first to yourself, then to a colleague, then to the boss and, finally, to the potential user. They require minimal formalization - no more than is needed to convey your idea. Let's say it can be done when talking over coffee, by mail, during a short walk. This is the most important regular practice that helps a professional data researcher learn how to correct their own work. If there are flaws in your strategy, they are likely to manifest as soon as you try to explain it. It is at this stage that you can eliminate the gaps and make sure that you can thoroughly explain both the problem and its solution.
Design like a professional
The work on creating and releasing a data product is diverse and complex, however, most of what you have to do corresponds to a specific link in the “ big data supply chain ” described by Alistair Kroll.
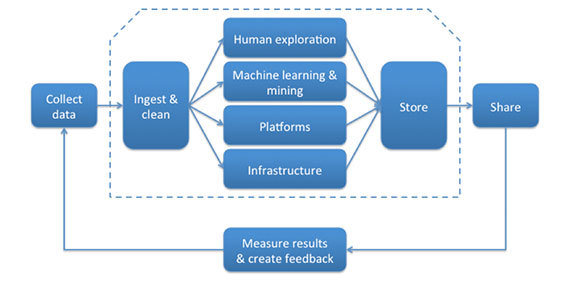
Since data products are operated in accordance with a specific paradigm (in real time, in batch mode or in accordance with some hybrid model), you are likely to be involved both in supporting the aforementioned supply chain and in implementing the paradigm this product: receive and delete batch-updated data, build an algorithm for real-time data analysis, organize data sharing, etc. Fortunately, the architectural pattern of the “blackboard” is similar to the basic drawing, which helps to implement any of these scenarios qualitatively at the programming level.
Chalkboard Pattern
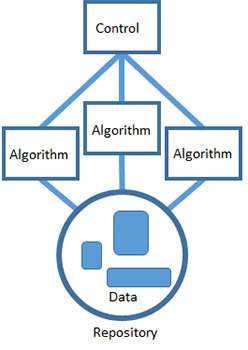
According to the chalkboard pattern, problems are solved in this way: the task is divided into many small self-sufficient subtasks, and then a solution is selected for each of them. Each subtask brings your hypothesis to a more digestible form, and for some of these hypotheses, ready-made solutions are already known. Each task gradually improves the solution and probably leads to a viable outcome.
Data science has many tools, each with its own unique strengths. Productivity is an important thing, and I prefer that the guys from my team select for themselves exactly the tools with which they can best handle. When using a chalkboard pattern, it is perfectly acceptable to build products for working with data based on several different technologies at once. The interaction between the algorithms is organized through a shared repository. Each algorithm can access the data, process them as input, and write the results back to the repository, where they can again serve as input for another algorithm.
Finally, the work of all algorithms is coordinated with the help of a single control component representing the heuristics you have chosen to solve the problem. Control is the implementation of the strategy you have developed. This is the highest level of abstraction and understanding of the problem, and it is implemented with the help of technology that can interact with all other algorithms and set the order of their execution. Monitoring can be automated by using, for example, a cron task or a script. You can perform it manually - let it be done by a person who will perform the various steps in the right order. But the most important is the overall problem solving strategy. It is at the level of control that you can take a look at the whole decision from the beginning to the end.
This basic approach has proven itself in the creation of software systems designed to solve fuzzy, hypothetical problems based on incomplete data. The most important thing is that in this way we can move towards solving a fuzzy problem, working with clear, deterministic components. Unfortunately, it is not guaranteed that your efforts will really solve the problem. The sooner you learn that you are going along a dead-end path, the better.
Professional assembly
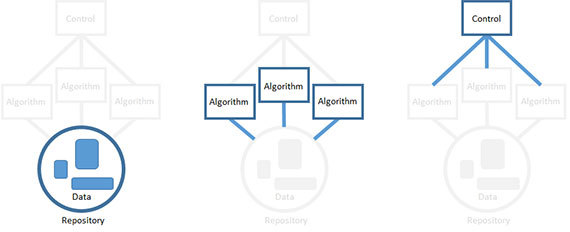
You are not required to collect the elements of your product in a strictly defined order (that is, first create a repository, then algorithms, and finally, a controller). Professionals organize the assembly in order to reduce technical risk. That is, the element for which such risk is highest is realized first. An element can represent technical risk for a variety of reasons. The most risky may be a component under the highest load, or one that you understand the worst.
You can create components in any order, focusing on only one of them, and leaving the stubs for the rest. For example, if you decide to start with the development of an algorithm, make a formal implementation of the input data, and also determine the place where the output of the algorithm will be temporarily recorded.
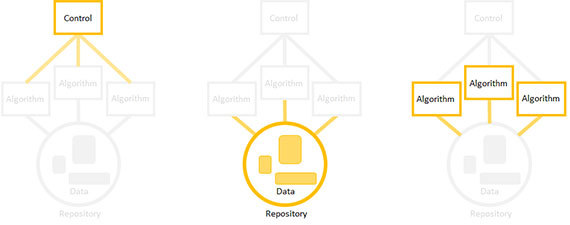
Next, sell the product in the same order: first, the riskiest items. Focus on one element, for the rest put a plug, you will always have time to replace them.
The key to success is to build and run in small portions. Write algorithms in small parts that you understand , add one data source to the repository at a time, and each step of the control should capture one step of the algorithm. Your goal is a product for working with data that will always be operational, and fully functional only at the time of its final implementation.
Professional tools
This professional can not do without a set of high-quality tools. Below is a list of the most common languages and technologies, as well as links where you can get acquainted with each of the topics in more detail.
Visualization
Version control
Programming languages
Hadoop Ecosystem
In the wake of the incessant discussions about Hadoop and other big data, we could not pass by Jerry Overton's remarkable publication, which tells about a professional approach to analyzing big data in companies of any size. Clear images provided by the author, as well as a brief parade of technologies, without which the modern Data scientist is indispensable. Therefore, even if the article begins with the (erroneous!) Premise: “Do not read books on Data Science,” it deserves publication in the blog of our publishing house.
If among the esteemed readers there are those who want to discuss Hadoop and other technologies from its ecosystem, as well as the literature on specific algorithms mentioned by the author, let's talk about it in the comments.
')
My experience as a data researcher does not at all resemble stories that can be read in books and blogs. They talk about my colleagues who work in supergiants. They seem to be superheroes, they write automated (consider, animate) algorithms that produce a continuous stream of insights. I read about data explorers, crafty as agent MacGyver, able to save the day, extracting useful data from almost everything that surrounds them.
The data solutions developed by my team are not so critical as to build a huge infrastructure for the whole company for them. In our case, giant investments in ultra-efficient automation and production management simply would not pay off. On the other hand, our products influence important decisions made at the enterprise, and, most importantly, our decisions are scaled. We cannot afford to do everything manually all the time, and we need effective mechanisms to share the results of our work with tens of thousands of people.
There are many “most ordinary data researchers” in the world, such as us. We are more organized compared to hackers, but, unlike all superheroes, we do without the "secret headquarters." We just get together and brainstorm , during which we discuss the best ways to create a reliable code. This article outlines the quintessence of our conversations; I tried to collect our knowledge, cut off all unnecessary and briefly present our achievements in one publication.
How to become a professional
A data researcher must have the skills of a programmer — but not all that a programmer uses in his work. I call data researchers with fundamental skills in developing information products “datologist programmers.” Professionalism is not just a skill that can be backed up with a certificate or gained by experience; I mean professionalism as a course of action.
A professional research programmer is able to correct himself when developing solutions for working with data. He knows the general strategies that allow him to recognize where his product is clearly pumped up and how to fix the problem.
A professional data researcher should be able to turn a hypothesis into a program that would test this hypothesis. Such specialization is unique for the entire IT-sphere, since there are unique problems that data researchers have to deal with. The most important challenge is connected with the fact that the science of data is experimental in nature. Its tasks are often complex, and the data itself is messy. Strategies for solving many such problems have not yet been worked out, the path to a solution is not known in advance, and possible solutions are best explained as a sequence of small steps. Next, I will describe the basic strategies that fit into an organized and productive trial and error method. The problem is decomposed into small stages, solutions are tested, corrections are made in the course of work.
Think like a pro
To become a professional data programmer, it is not enough to know the general principles of structuring systems. You need to understand how to design a solution, be able to recognize when you have a solution, and also distinguish between cases in which you do not fully understand your own solution. The last point is critical so that you can adjust your own work. When you recognize fundamental gaps in your own approach, you can fill them in yourself. In order to choose such a solution to a data problem that can be corrected in the course of work, I prefer to adhere to the basic paradigm of “ watch, see, imagine, show ”.
Stage 1 : Watch. To get started, navigate the terrain. Do a preliminary study, familiarize yourself with all the components that may be associated with your task. Consider the problem in its widest context. Try to deal with the maximum number of aspects of the task, put in order the fragmented pieces of information.
Stage 2 : See. Take the above-mentioned fragmented fragments and summarize them in the form of abstractions corresponding to the elements of the blackboard pattern . At this stage, you will transform the elements of the problem into meaningful technical concepts. The vision of the problem is the most important preparatory step towards the creation of a viable project.
Stage 3 : Imagine. Based on the technical concepts that you already see at this stage, imagine an implementation that will allow you to go from the initial state to the target state. If you can’t imagine the implementation, you probably missed something when considering the problem.
Stage 4 : Show. Explain the resulting solution, first to yourself, then to a colleague, then to the boss and, finally, to the potential user. They require minimal formalization - no more than is needed to convey your idea. Let's say it can be done when talking over coffee, by mail, during a short walk. This is the most important regular practice that helps a professional data researcher learn how to correct their own work. If there are flaws in your strategy, they are likely to manifest as soon as you try to explain it. It is at this stage that you can eliminate the gaps and make sure that you can thoroughly explain both the problem and its solution.
Design like a professional
The work on creating and releasing a data product is diverse and complex, however, most of what you have to do corresponds to a specific link in the “ big data supply chain ” described by Alistair Kroll.
Since data products are operated in accordance with a specific paradigm (in real time, in batch mode or in accordance with some hybrid model), you are likely to be involved both in supporting the aforementioned supply chain and in implementing the paradigm this product: receive and delete batch-updated data, build an algorithm for real-time data analysis, organize data sharing, etc. Fortunately, the architectural pattern of the “blackboard” is similar to the basic drawing, which helps to implement any of these scenarios qualitatively at the programming level.
Chalkboard Pattern
According to the chalkboard pattern, problems are solved in this way: the task is divided into many small self-sufficient subtasks, and then a solution is selected for each of them. Each subtask brings your hypothesis to a more digestible form, and for some of these hypotheses, ready-made solutions are already known. Each task gradually improves the solution and probably leads to a viable outcome.
Data science has many tools, each with its own unique strengths. Productivity is an important thing, and I prefer that the guys from my team select for themselves exactly the tools with which they can best handle. When using a chalkboard pattern, it is perfectly acceptable to build products for working with data based on several different technologies at once. The interaction between the algorithms is organized through a shared repository. Each algorithm can access the data, process them as input, and write the results back to the repository, where they can again serve as input for another algorithm.
Finally, the work of all algorithms is coordinated with the help of a single control component representing the heuristics you have chosen to solve the problem. Control is the implementation of the strategy you have developed. This is the highest level of abstraction and understanding of the problem, and it is implemented with the help of technology that can interact with all other algorithms and set the order of their execution. Monitoring can be automated by using, for example, a cron task or a script. You can perform it manually - let it be done by a person who will perform the various steps in the right order. But the most important is the overall problem solving strategy. It is at the level of control that you can take a look at the whole decision from the beginning to the end.
This basic approach has proven itself in the creation of software systems designed to solve fuzzy, hypothetical problems based on incomplete data. The most important thing is that in this way we can move towards solving a fuzzy problem, working with clear, deterministic components. Unfortunately, it is not guaranteed that your efforts will really solve the problem. The sooner you learn that you are going along a dead-end path, the better.
Professional assembly
You are not required to collect the elements of your product in a strictly defined order (that is, first create a repository, then algorithms, and finally, a controller). Professionals organize the assembly in order to reduce technical risk. That is, the element for which such risk is highest is realized first. An element can represent technical risk for a variety of reasons. The most risky may be a component under the highest load, or one that you understand the worst.
You can create components in any order, focusing on only one of them, and leaving the stubs for the rest. For example, if you decide to start with the development of an algorithm, make a formal implementation of the input data, and also determine the place where the output of the algorithm will be temporarily recorded.
Next, sell the product in the same order: first, the riskiest items. Focus on one element, for the rest put a plug, you will always have time to replace them.
The key to success is to build and run in small portions. Write algorithms in small parts that you understand , add one data source to the repository at a time, and each step of the control should capture one step of the algorithm. Your goal is a product for working with data that will always be operational, and fully functional only at the time of its final implementation.
Professional tools
This professional can not do without a set of high-quality tools. Below is a list of the most common languages and technologies, as well as links where you can get acquainted with each of the topics in more detail.
Visualization
- D3.js : D3.js (or simply D3, Data-Driven Documents) is a JavaScript library for creating dynamic, interactive visualizations of data in the browser. It uses the widely accepted standards of SVG, HTML5 and CSS.
Version control
- GitHub is a Git web hosting repository that provides a full range of functions for distributed version control and source code management (SCM). At the same time, GitHub not only works with Git, but also adds its own capabilities. GitHub provides both a browser-based web interface and a local PC interface, and also integrates with mobile platforms.
Programming languages
- R : is a programming language and software environment for statistical calculations and their graphical representation. The R language is widely used by statisticians and data-mining specialists both for developing statistical software and for analyzing data.
- Python : This is a widespread universal high-level programming language. The Python philosophy focuses on the readability of the code, and the syntax allows programmers to express concepts more succinctly than in languages like C ++ or Java.
- Scala : is a functional object-oriented general purpose language. All functional programming features are fully supported in Scala, there is a very strong static type system. Therefore, programs created on Scala are very short and more compact than programs in other more common universal languages.
- Java : this is an extremely common universal object-oriented programming language that provides competitive processing, has a class system, specially designed with such an eye that the programs on it contain as few dependencies as possible. It is designed so that the application can “write once and run everywhere” (the WORA principle).
Hadoop Ecosystem
- Hadoop : this is a free software framework written in Java and intended for distributed storage and distributed processing of very large data sets in computer clusters built from relatively cheap hardware.
- Pig : This is a high-level platform for creating MapReduce programs used with Hadoop.
- Hive : this is a data storage infrastructure built on the basis of Hadoop that provides summation, query and analysis of data.
- Spark : Spark primitives stored in memory increase performance, for some applications, 100 times.
Source: https://habr.com/ru/post/264285/
All Articles