Apply correlation in retail
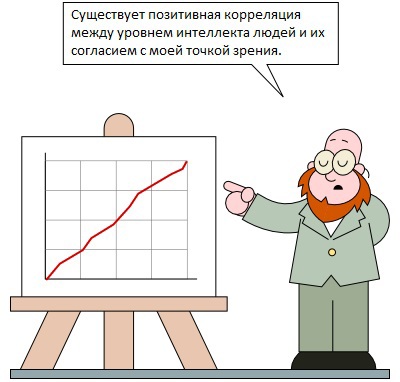
At the moment, the higher education system has reduced mathematics to a single use - to break the brains of undergraduate students of non-core specialties and will safely disappear by the next session. Some, however, still remember that such sciences as mathematics and statistics are a real force, but few understand this and even more so apply it in their work.
In Datawiz.io , having gathered several mathematicians, we decided to try to change the situation. It is interesting to use your knowledge on something real, measurable, and even, perhaps, beneficial to society. We stopped at the retail industry. Retail offers a wealth of data for processing, just a waterfall of numbers: sales, checks, pricing, buyers, loyalty programs, ... There is something to frolic about.
Simple visualization of retail data is also quite boring. Traditional analytics can show yesterday’s data and look cool in reports, but it will never show tomorrow.
Machine learning models work differently. They give you control and interaction. You can play with models, change the parameters and see how this affects the result, study the possible consequences of various combinations of factors. What is not communication with the oracle?
')
Let's start with the simple.
Is it possible to determine the sales of which products may affect the total revenue of the store?
We have the initial data for two stores, let's call them Grocery Store and Supermarket:
1. sales of goods of a certain category;
2. the number of mentions in the checks of goods of a certain category.
We make tables:
rows - weeks;
columns - categories;
cells - the number of goods sold or mentions in checks.
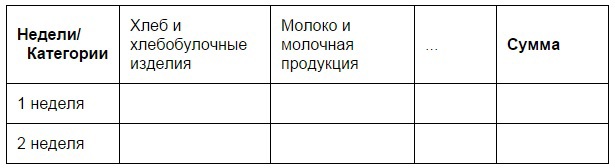
Total - 4 tables, 2 for each store.
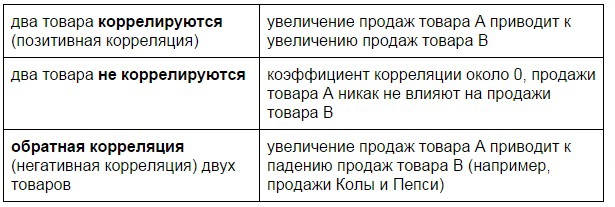
First, we will deal with the correlation of sales. how sales of goods affect the total turnover of the store and sales of other categories. There are 3 possible scenarios.
We know that almost every store sells large quantities of milk. We accept the hypothesis that the sales of milk and the turnover of the store are directly correlated. We denote milk sales data in blue, and turnover data in red.
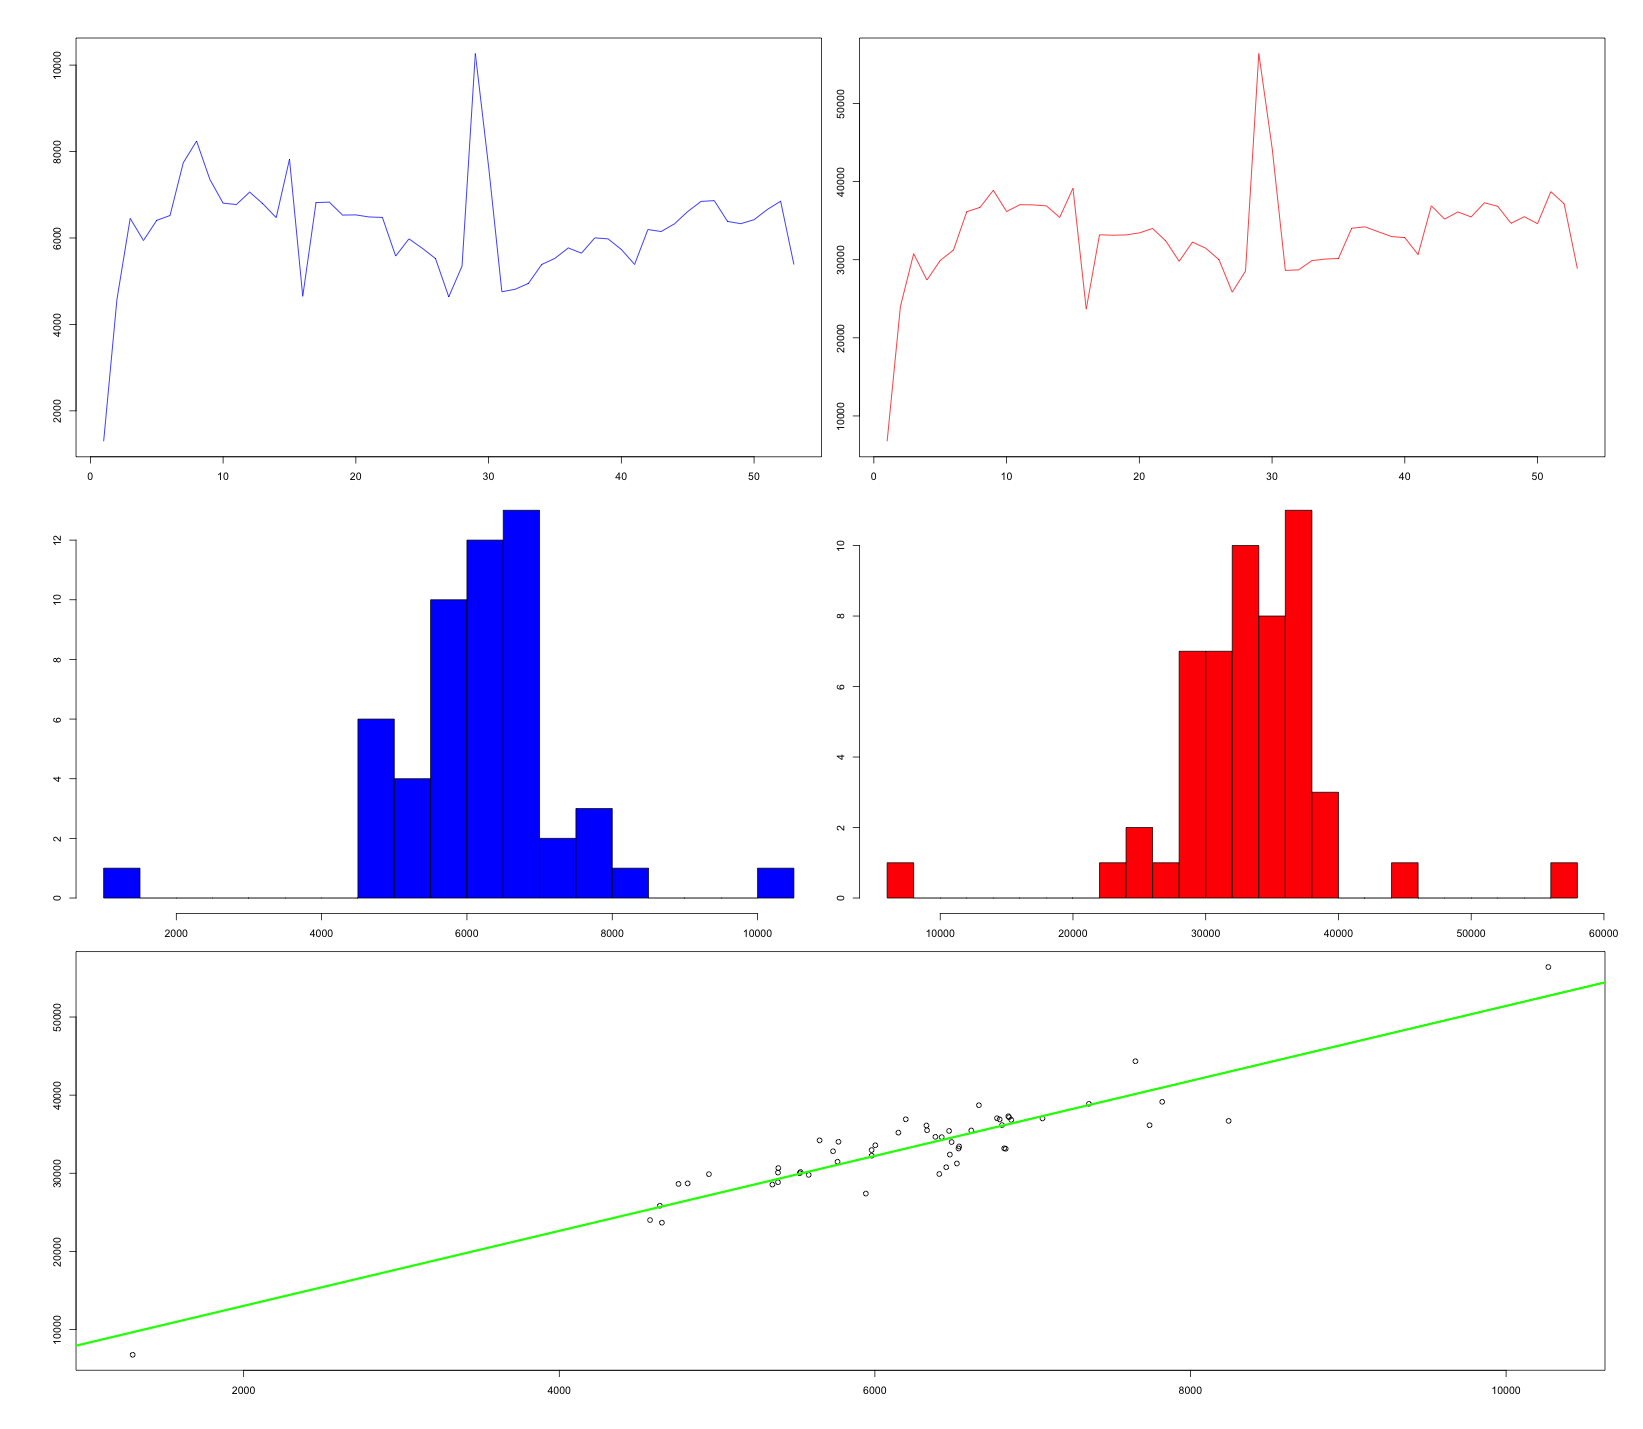
Compare the left and right graphics, they are almost the same, as seen in the figure.
In the bottom diagram, we displayed horizontally “Milk and dairy products”, and vertically “Turnover”, and here we can also observe a linear relationship. So our hypothesis was true.
Buyers come to the store to buy milk, but they also buy other products, which means it’s profitable for the store to attract buyers even by reducing the price of dairy products.
But now we are interested in the question of how to find all products subject to correlation, and how sales of goods correlate with the turnover of the store? We use the correlation matrix.
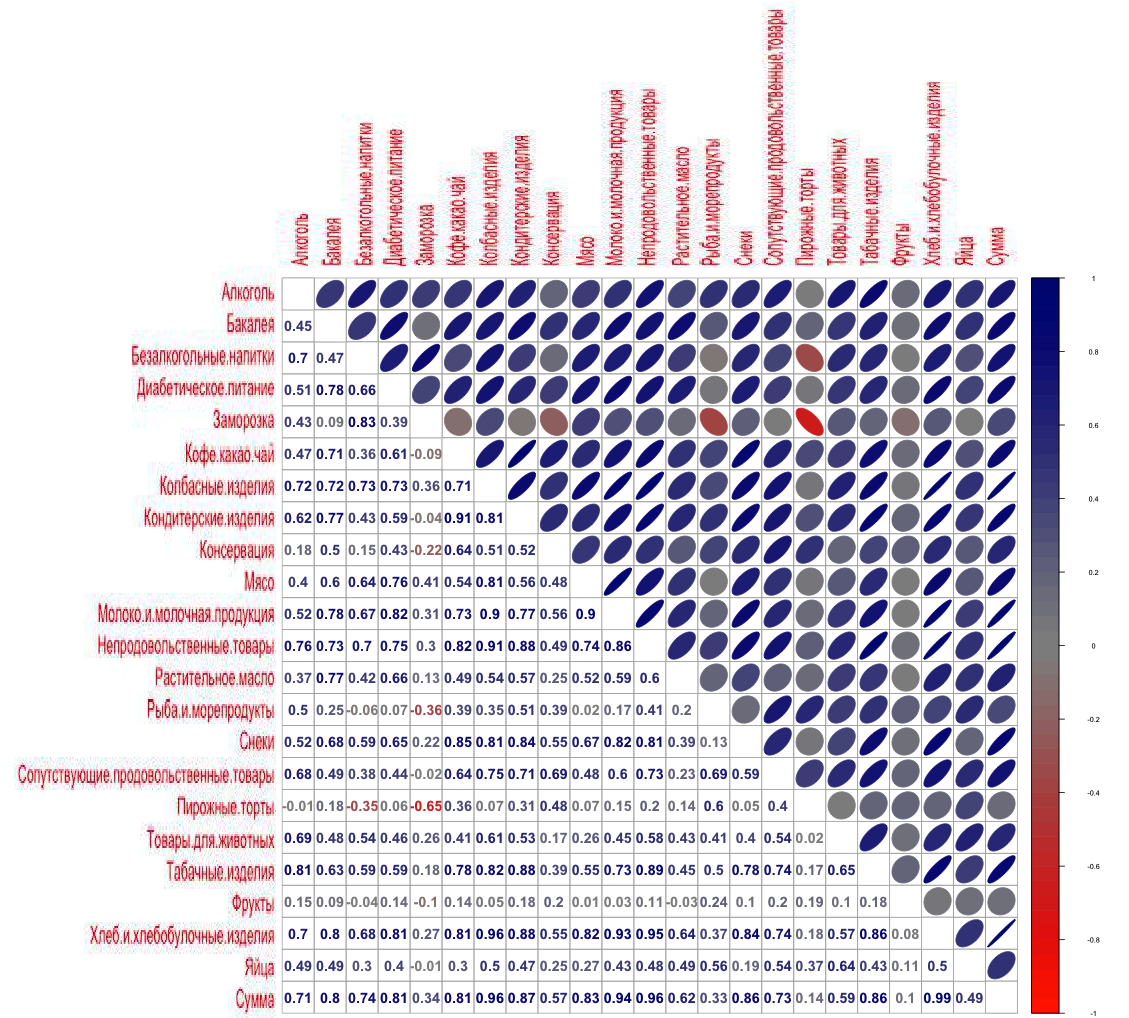
Correlation of sales of goods by gastronomy

* When constructing the matrix, the correlation close to zero is indicated by a circle and gray (using the color gamma chosen by us), and the fluctuation magnitude from zero is determined by the ellipse and its color: blue in the case of positive correlation, red in the case of negative.
Based on the matrix, we can identify the top products whose sales are correlated with the turnover of the store.
Bread and Bakery 0.977
Nonfoods 0.950
Milk and dairy products 0.934
Sausage products 0.930
Snacks 0.870
Tobacco Products 0.835
Confectionery 0.802
Diabetic nutrition 0.794
Groceries 0.782
In our experience, bread, packages (non-food items), milk and sausages have a high correlation coefficient in almost any store in the world. Everyone who comes to the store usually buys one or more of these products. But snacks, tobacco and confectionery products differ in this particular case, so the Deli has buyers who come to the store just for these groups of goods.
Now we apply the analysis on the frequency of mentions of goods in checks - focused on the buyer, not the product approach.
Correlation of the frequency of mentioning goods in checks for gastronomy
Select from this matrix the top frequency of mentions of goods in checks:
Bread and Bakery 0.986
Sausage products 0.961
Nonfoods 0.956
Milk. and dairy products 0.944
Pastry 0.867
Snacks 0.864
Tobacco Products 0.858
Meat 0.829
Diabetic nutrition 0.812
As you can see, the top categories and even the numbers by category are almost the same
Apply the same approach to the second store.
Correlation of sales of goods at the supermarket
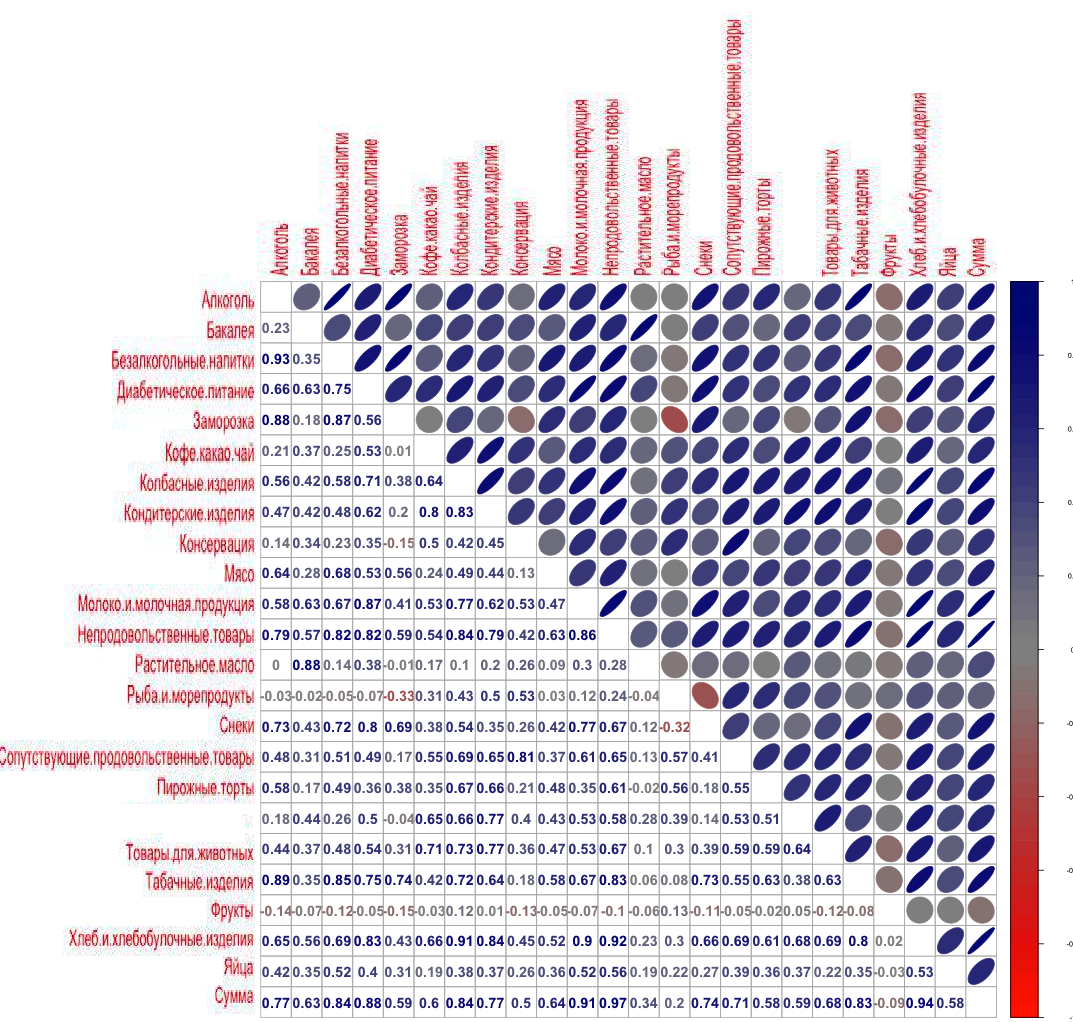
And here we already see a significant difference with the Deli.
The Supermarket Matrix shows another top selling product:
Nonfoods 0.966
Bread and Bakery 0.943
Milk and dairy products 0.908
Diabetic nutrition 0.882
Sausage products 0.840
Soft drinks 0.837
Tobacco Products 0.835
Pastry 0.775
Alcohol 0.773
Correlation of the frequency of mentions of goods in checks at the supermarket

Top frequency of references to goods in checks at the supermarket:
Nonfoods 0.975
Bread and Bakery 0.968
Milk and dairy products 0.948
Sausage products 0.927
Diabetic food 0.905
Pastry 0.899
Tobacco Products 0.858
Soft drinks 0.819
Alcohol 0.785
As you can see, in the supermarket 2 new categories entered the top - Non-alcoholic beverages and Alcohol instead of Groceries and Snacks at the Deli.
Perhaps it depends on the location of the stores and the competitive environment.
Correlation matrices give us ample opportunities for analysis.
What we would like to focus on, when analyzing these matrices, it is worth considering not only the correlation (positive or negative), non-correlated products, it is also worth analyzing. For example, vegetable oil does not correlate with any other category of goods, or with the general turnover of the store. Analysis of checks similarly shows that there are buyers who come to the store exclusively for vegetable oil. So the marketer can place it on the trading floor anywhere and the buyer will still find the product he needs.
Another aspect, some products have an inverse correlation, such as fish and snacks. This is easily explained by the fact that, as a rule, depending on their preferences, people either take beer + snacks or beer + fish. Very rarely, someone buys fish and snacks at the same time. The situation is similar with frozen and fresh fish, ice cream and cakes.
A detailed analysis of the relationship between the goods gives a large number of such facts that may be useful.
Correlation analysis shows the current situation, the goods significantly affecting the turnover of the store. But which ones are the most significant? It is easier to consider using linear model building, which will be the topic of our next article.
In Datawiz.io , having gathered several mathematicians, we decided to try to change the situation. It is interesting to use your knowledge on something real, measurable, and even, perhaps, beneficial to society. We stopped at the retail industry. Retail offers a wealth of data for processing, just a waterfall of numbers: sales, checks, pricing, buyers, loyalty programs, ... There is something to frolic about.
Simple visualization of retail data is also quite boring. Traditional analytics can show yesterday’s data and look cool in reports, but it will never show tomorrow.
Machine learning models work differently. They give you control and interaction. You can play with models, change the parameters and see how this affects the result, study the possible consequences of various combinations of factors. What is not communication with the oracle?
')
Let's start with the simple.
Is it possible to determine the sales of which products may affect the total revenue of the store?
We have the initial data for two stores, let's call them Grocery Store and Supermarket:
1. sales of goods of a certain category;
2. the number of mentions in the checks of goods of a certain category.
We make tables:
rows - weeks;
columns - categories;
cells - the number of goods sold or mentions in checks.
Total - 4 tables, 2 for each store.
First, we will deal with the correlation of sales. how sales of goods affect the total turnover of the store and sales of other categories. There are 3 possible scenarios.
We know that almost every store sells large quantities of milk. We accept the hypothesis that the sales of milk and the turnover of the store are directly correlated. We denote milk sales data in blue, and turnover data in red.
plotPair <- function(x,y,namesX,namesY){ par(mfrow=c(2,1)) plot(x,type='l',col='red',main=namesX,xlab='') plot(y,type='l',col='blue',main=namesY,xlab='') par(mfrow = c(3,2), oma = c(5,4,0,0) + 1, mar = c(0,0,1,1) + 1 ) layout(matrix(c(1,2,3,4,5,5), 3,2, byrow = TRUE)) plot(x,type='l',col='blue',ylab='log sales qty',main=namesX,xlab='') plot(y,type='l',col='red',main=namesY,xlab='') hist(x,col='blue',main=names(x),breaks=20) hist(y,col='red',main=names(y),breaks=20) m<-lm(y~x) plot(x,y,xlab=namesX,ylab=namesY) abline(m,col='green',lwd=3) } plotPair(x=moloko_df$...', y=moloko_df$sum, namesX='...', namesY='') Compare the left and right graphics, they are almost the same, as seen in the figure.
In the bottom diagram, we displayed horizontally “Milk and dairy products”, and vertically “Turnover”, and here we can also observe a linear relationship. So our hypothesis was true.
Buyers come to the store to buy milk, but they also buy other products, which means it’s profitable for the store to attract buyers even by reducing the price of dairy products.
But now we are interested in the question of how to find all products subject to correlation, and how sales of goods correlate with the turnover of the store? We use the correlation matrix.
corr<-function(df){ cr <-cor(df, use="complete.obs") par(cex = 0.9) corrplot.mixed(corr=cr,upper="ellipse", tl.pos="lt", col = colorpanel(50, "red", "gray60", "blue4"), cl.cex=0.5,tl.cex=1.1) } Correlation of sales of goods by gastronomy
* When constructing the matrix, the correlation close to zero is indicated by a circle and gray (using the color gamma chosen by us), and the fluctuation magnitude from zero is determined by the ellipse and its color: blue in the case of positive correlation, red in the case of negative.
Based on the matrix, we can identify the top products whose sales are correlated with the turnover of the store.
Bread and Bakery 0.977
Nonfoods 0.950
Milk and dairy products 0.934
Sausage products 0.930
Snacks 0.870
Tobacco Products 0.835
Confectionery 0.802
Diabetic nutrition 0.794
Groceries 0.782
In our experience, bread, packages (non-food items), milk and sausages have a high correlation coefficient in almost any store in the world. Everyone who comes to the store usually buys one or more of these products. But snacks, tobacco and confectionery products differ in this particular case, so the Deli has buyers who come to the store just for these groups of goods.
Now we apply the analysis on the frequency of mentions of goods in checks - focused on the buyer, not the product approach.
Correlation of the frequency of mentioning goods in checks for gastronomy
Select from this matrix the top frequency of mentions of goods in checks:
Bread and Bakery 0.986
Sausage products 0.961
Nonfoods 0.956
Milk. and dairy products 0.944
Pastry 0.867
Snacks 0.864
Tobacco Products 0.858
Meat 0.829
Diabetic nutrition 0.812
As you can see, the top categories and even the numbers by category are almost the same
Apply the same approach to the second store.
Correlation of sales of goods at the supermarket
And here we already see a significant difference with the Deli.
The Supermarket Matrix shows another top selling product:
Nonfoods 0.966
Bread and Bakery 0.943
Milk and dairy products 0.908
Diabetic nutrition 0.882
Sausage products 0.840
Soft drinks 0.837
Tobacco Products 0.835
Pastry 0.775
Alcohol 0.773
Correlation of the frequency of mentions of goods in checks at the supermarket
Top frequency of references to goods in checks at the supermarket:
Nonfoods 0.975
Bread and Bakery 0.968
Milk and dairy products 0.948
Sausage products 0.927
Diabetic food 0.905
Pastry 0.899
Tobacco Products 0.858
Soft drinks 0.819
Alcohol 0.785
As you can see, in the supermarket 2 new categories entered the top - Non-alcoholic beverages and Alcohol instead of Groceries and Snacks at the Deli.
Perhaps it depends on the location of the stores and the competitive environment.
Correlation matrices give us ample opportunities for analysis.
What we would like to focus on, when analyzing these matrices, it is worth considering not only the correlation (positive or negative), non-correlated products, it is also worth analyzing. For example, vegetable oil does not correlate with any other category of goods, or with the general turnover of the store. Analysis of checks similarly shows that there are buyers who come to the store exclusively for vegetable oil. So the marketer can place it on the trading floor anywhere and the buyer will still find the product he needs.
Another aspect, some products have an inverse correlation, such as fish and snacks. This is easily explained by the fact that, as a rule, depending on their preferences, people either take beer + snacks or beer + fish. Very rarely, someone buys fish and snacks at the same time. The situation is similar with frozen and fresh fish, ice cream and cakes.
A detailed analysis of the relationship between the goods gives a large number of such facts that may be useful.
Correlation analysis shows the current situation, the goods significantly affecting the turnover of the store. But which ones are the most significant? It is easier to consider using linear model building, which will be the topic of our next article.
Source: https://habr.com/ru/post/264217/
All Articles