HP Software - a modern approach to building an IT and business services monitoring system

HP software solutions allow you to see rare network problems, network bugs that are fraught with consequences. We can see all the events, where they can lead, what changes are caused, etc., - the program itself compares these events and shows the weak and problematic places of the network. Using these tools, we can see the network problem, even before its transition to the critical phase.
How the solution of HP Software for analytics reveals the hidden problems of the network and business applications and much more, under the cut
')
Software solutions, such as IT management, represent a wide range of products that include many interesting solutions for automating IT management, automating processes, solving monitoring problems, and managing data centers.
Today we will talk about solutions designed for monitoring: monitoring not only IT 'hardware', but also business services, which, in fact, interests business.
Now it is no secret to anyone; many companies build their business based on IT. Managers are not interested in what happens with a separate server, with a separate 'piece of iron'. It is primarily interested in the quality of the services provided, customer satisfaction, and the ability of business services to operate at a high level, and thus ensure the continuous operation of the company.
Accordingly, when our service deteriorates, (one thing, if it is an internal client or internal user, he may suffer a little), if this is a client of a bank, telecom, or no matter which company, when he is faced with a bad service, what does he do? He goes to a competitor.
Thus, one of the main tasks of this kind of monitoring is to provide a flexible tool that allows you to associate the events that occur in IT with the state of business services, the ability to predict problems, the ability to automate problem resolution to restore the service as quickly as possible and as qualitatively as possible. . Therefore, when we guarantee our customers and customers high-quality service, they continue to work with us, profits grow, we capture more and more of the market, and we look beautiful compared to our competitors.
What does Hewlett-Packard offer for solving such problems? In general, HP has a wide portfolio, HP has been involved in monitoring solutions for more than 25 years, started with network monitoring, Network Node Manager, maybe someone knows about it, then a number of interesting solutions were developed, some solutions were included in HP due to their purchase from other companies that were leaders in a particular industry.
HP Software Solutions
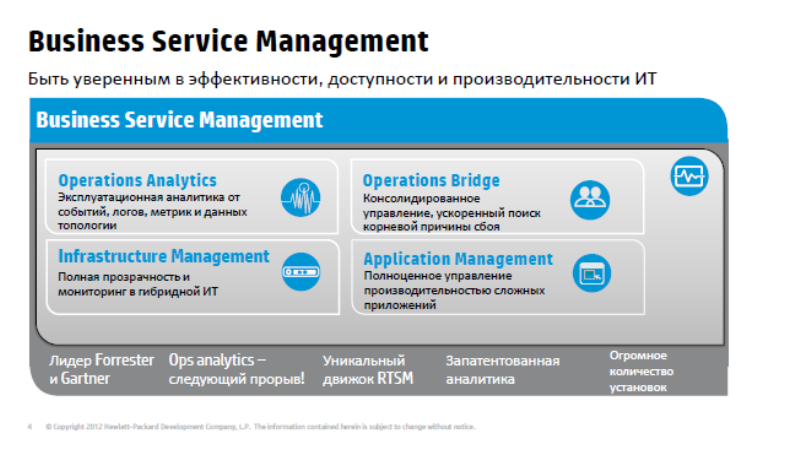
If we summarize, we can divide the proposed solutions into 4 categories:
The first is the simplest and most understandable - infrastructure monitoring (infrastructure management), here we are talking about monitoring networks, servers, software, i.e. IT resources. In principle, many companies have already solved these problems with commercial or free resources. For example, Nagios, Zabbix use Microsoft, so we will not dwell on this right now.
It will be more about such things as Application Performance Management - this is the ability to perform comprehensive monitoring of application availability, and accordingly everything under it is monitored from the end user's point of view, the ability to diagnose problems that are inside the application.
Further Operations Bridge is an unusual name, Umbrella, umbrella monitoring system, which allows you to combine monitoring data and a variety of tools from existing or new, and create a single console. The monitoring service is a console that provides a single view of how services feel, QPI is calculated, all events and performance metrics are dumped there.
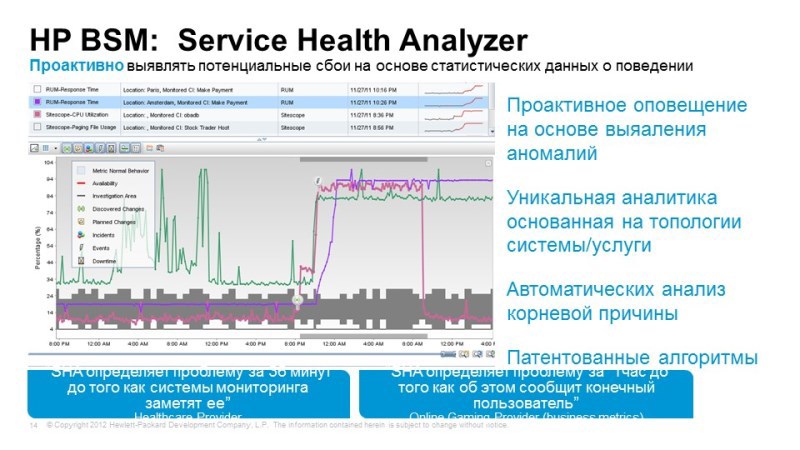
And Operations Analytics is HP's latest development, which entered the market just over a year ago, is a solution that allows you to find little-known problems.
When we talk about traditional monitoring, we know what we want to measure, most often we know what the threshold value should be, i.e. we are looking for those things that we already know, those failures that are expected. For example, the well-known events in the logs control the parameters of performance or availability of services that are important for us, for which we also set threshold values.
In fact, a lot of events occur in the IT infrastructure of a large enterprise that we cannot control everything. When we talk about, say, telephone operators, whose number of logs is growing in gigabytes per day, it is difficult to envisage all possible scenarios for the development of events, Operations Analytics uses BigData processing methods, artificial intelligence methods to identify non-standard problems, to search for those failures that are not It was before, non-standard solutions.
UCMDB platform
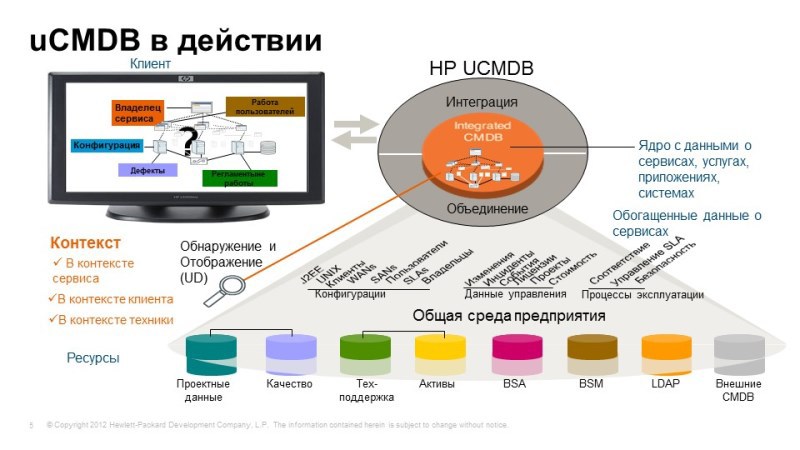
Before we proceed to the consideration of these products, we need to make a small lyrical digression, mention uCMDB - universal configuration database, it is one of the key components not only for monitoring solutions, but also in other solutions for managing IT productivity.
So, what it is is: it is a single configuration database that allows you to build models of services, combining all the components, interconnections, mutual influences, i.e. create a single point of service: what it consists of. uCMDB is a link between monitoring solutions, if we are talking about monitoring, then at uCMDB, at a separate facility, we can “hang” monitoring data and understand how a particular service “feels”, understand the relationship between components. When we build integration, for example, with a service desk, you have additional entities, for example, incidents, problems, we need to “attach” them to the same objects, when we talk about asset management, financial elements may be associated with these elements. components, contracts, contracts, the value of these assets, etc.
Thus, uCMDB is one of the important centers. And what is important, we have the ability to fill uCMDB automatically, there is an excellent method of agentless discovery, agentless detection of individual infrastructure components, connections between components, for example, we can connect to the database, look at the logs who addressed it, and thus rebuild interconnections between the database and its clients. Or, for example, when we talk about standard applications: Active Diary, Microsoft Exchange, the underlying template, we already know what this service consists of, and it remains for us to discover these components and build all the necessary interrelations. If there is some kind of non-standard service, internal development, we can create its model, and it will also automatically open. Automatic discovery is also important from the point of view that, as a rule, the IT infrastructure of a modern enterprise is very dynamic, changes rapidly, and if any changes occur, we also need to find them, to find uCMDB to be up-to-date .
For example, in monitoring tasks, one of the most important things that we solve with the help of uCMDB is the correlation of events. Topology Based Event Correlation - receiving a lot of events from various objects, we understand how infrastructure components affect services, respectively, when we receive a stream of events, we can determine which infrastructure events affect which services, identify the cause and effect of these events.
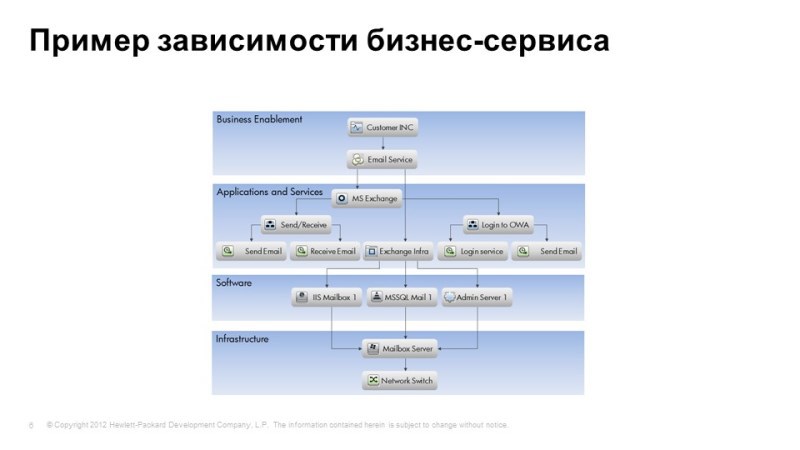
One of the uCMDB views: from infrastructure levels, applications to business services level.
Let's now move on to the products in more detail, and start with the Application Performance Management group. These are the products that allow you to set up monitoring of services in general, understand how well it works, whether it works, how quickly it responds, how quickly it performs certain functions.
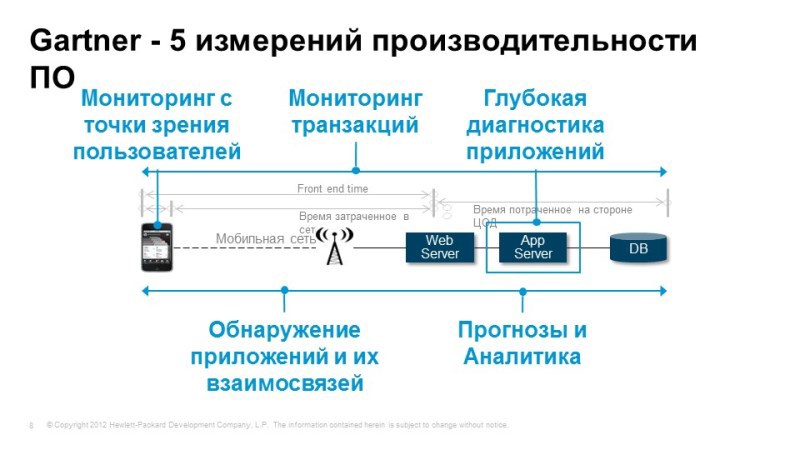
According to Gartner, these are the things that need to be implemented to meet the challenges of monitoring application performance. First of all, we need to be able to monitor from the end user's point of view. We need to understand whether the service is available to the user, how well it works, how fast all the necessary functions work and work?
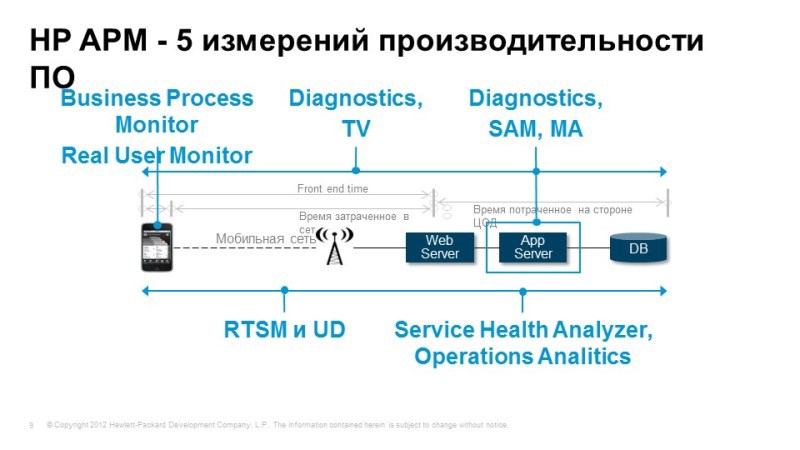
We should be able to track the progress of transactions when the user performs some action, for example, the client-bank: checking the balance, leaving the transaction, we need to understand where it went, and what processes take place inside the application server, and if any or difficulties, we can immediately understand where these difficulties arose. These could be problems with the application, maybe a problem with the network or database, etc.
If the problem occurs with the application, we need to be able to perform deep diagnostics, understand what happens inside this application, where delays occur, where transaction losses occur. Again, we need to understand what the services consist of, this is discovery, automatic model building. And of course, it is not bad to have the ability to predict, perform analytical tasks in order to solve non-standard problems and understand what we expect in the future, how our service will behave tomorrow or next week. All these tasks are perfectly solved with the help of Hewlett-Packard tools. Listed here are the modules that cover these tasks, and now we will consider them.
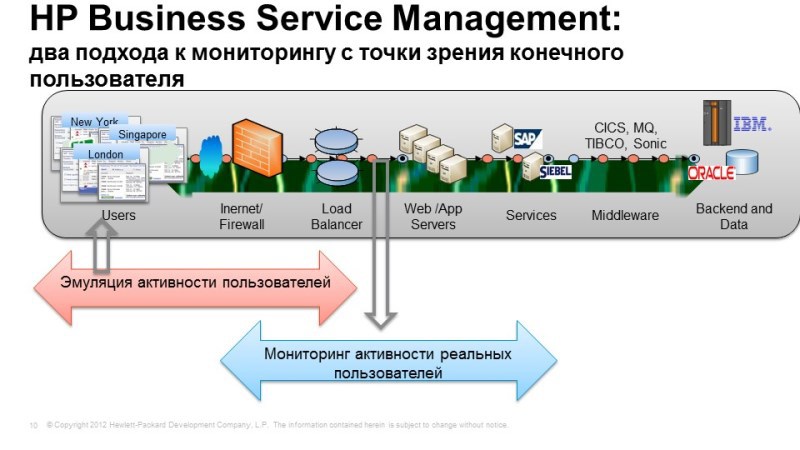
User Monitoring

Let's start with monitoring from the end user's point of view. This solution allows you to get the fastest results with little effort. Here we have two approaches, it is best of course to use them together, but it is also possible separately. The first option is an emulation of user actions, when we, under the guise of a real person, connect to the system, perform typical actions, and watch how they are worked out. Option 2 - monitoring the activity of real users, when we take, say, system traffic, which contains transaction elements, as a rule, data is taken from the switch that is closest to the application server. We copy traffic and configure it to parse and see user requests and see the response application so we monitor the availability of service applications for end users.
Let's see how it works. The 1st option is an emulation of actions and user activity. Here, the View Jam tool is used, possibly a familiar, way to create an emulation of user actions. When we take, for example, the console, we tell View Jam that now with this console we will connect to such applications using such protocols. It intercepts all our requests, all the answers of the application, turns this data into a script. Then we parameterize it, let's say that it connects under different users or executes different types of requests. Next, we use this script, we no longer need the application console, everything is emulated at the network level, we can arrange samples in any number of offices, inside our network, and even outside, and perform specified actions from these samples with a given periodicity. We select the necessary locations, set a list of those actions and transactions that we want to check, and at the output we have a consolidated view, which shows what locations are connected, how quickly certain transactions are processed, in one office, another, third, fourth ...
Thus, we see how our systems and services work in those points where they are the most important. In principle, this mechanism is the most optimal for calculating sules, since here we compare the similar with the similar. We constantly measure the availability and performance of applications for transactions of the same type, thus it is easy to calculate the quality of transactions. This mechanism is very good for controlling the availability of a service, for example, during off-hours, when there are no real users, and we want to be sure that our service is still available, for example, the working day began in the bank, a person came, looked that all the necessary types of transactions are processed, you can safely go to drink coffee and not be afraid that users will start to call now and something will work wrong for them.
Question: How many users can emulate as much as possible?
Unlimited how to tune. The same mechanism is used for load testing - weblearn scripts, we have a LoadRunner tool. If you need to make a load, you can use LoadRunner, and it will generate at least tens of thousands of simultaneous users, since this is all done at the network level, at the level of data exchange protocols, we do not need a console, this is a very easy solution. BPM (Business Process Monitor) is good because it is easy to set up, you can put it as a stand alone solution, quickly set up standard transactions and, even without monitoring infrastructure components, already understand how our services feel, for example, show business to real condition and quality of our services.
It supports a huge number of protocols, databases, application server, web interfaces, thick and thin clients, even for DOS applications you can use this kind of monitoring for very outdated ones. In Belarus, in one of the banks piloted, they have an old application, it’s not a problem even for this to be set up.
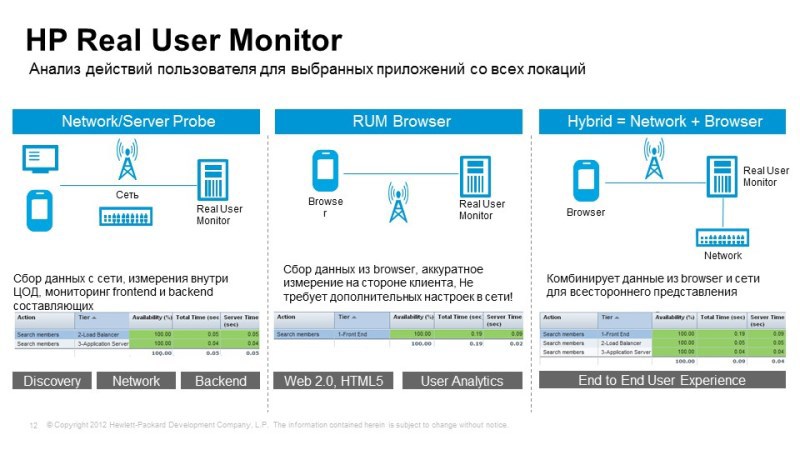
The second method that we talked about is monitoring the real actions of users, the Real User Monitor, when we take the necessary network traffic from the network traffic or from the browser, from the application server, it is not so easy to set up here, because you need to work with parsing traffic, in order to identify elements of certain transactions, many things are done automatically, a pilot was recently in one of the banks: they started traffic to the room, set up automatic detection of different types of requests, and he immediately began to show that some requests are being processed quickly, while others are processed and a half minutes. Further deeper tuning,
What is interesting here: here you can understand, for example, for which particular user there is a problem? If we identify users in the request, we can see that some user has a problem, we can call him, say to him: “Hello, we know that you have a problem, we are working on it, do not worry, in half an hour everything will work! "
Even this level of service can be done with similar decisions. Here you can make snapshots of queries. When we see, for example, information about an error, some kind of failure, we can take off the snapshot, and we can know what the user sees, he saw a specific error, and we don’t need to communicate with him for a long time on the phone, find out what problem he has in fact, it appeared before our eyes.
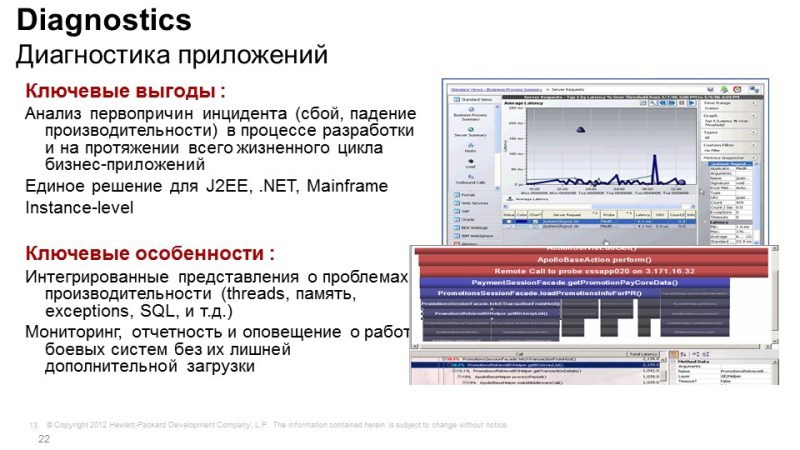
If the problems with the work of applications lie deep in the application itself, this is not a network problem, not a server problem, but specifically application work, then we need diagnostic tools, in fact, the solution is called HP Diagnostics - this is another module of the Business Service platform Management (BSM). Diagnostics understands Java applications, .NET applications, Python, is able to work with various databases, and it is needed to look into the depths. For example, the web server is running, the application is running, the memory is walking, the processor is free, the disks, it seems, are also not heavily loaded, and the response is slow. The problem lies inside, i.e. in the application itself.
By means of diagnostics, we can look inside and understand what exactly is happening: the transaction went, we understand what methods are used, what functions are used in this application, and we can understand how long it takes to process a particular request, we see external calls, database calls, we see memory leaks, we can point to the place in the code where the problem lies, if it is an internal development, if you work closely with a software provider, you can show him a record, poke him with a finger and say: "This is where you have a problem, decide yte ".
If it is Oracle, we don’t dig so deeply with Oracle, but we can also collect collector data from Oracle, collector allows you to remove data in an agentless way and see what happens with the databases, that is, Oracle also connects perfectly.
Comparison of user work and network components
Another aspect that we did not mention is the impact of the network. If we want to control how network performance, network equipment, communication channel load affects our services, then we can use Network Node Manager, it also closely integrates into our platform, allows us to understand how channels are loaded, how network operation or the state of that or other equipment and even changing the configuration of this equipment affects the operation and availability of our services.
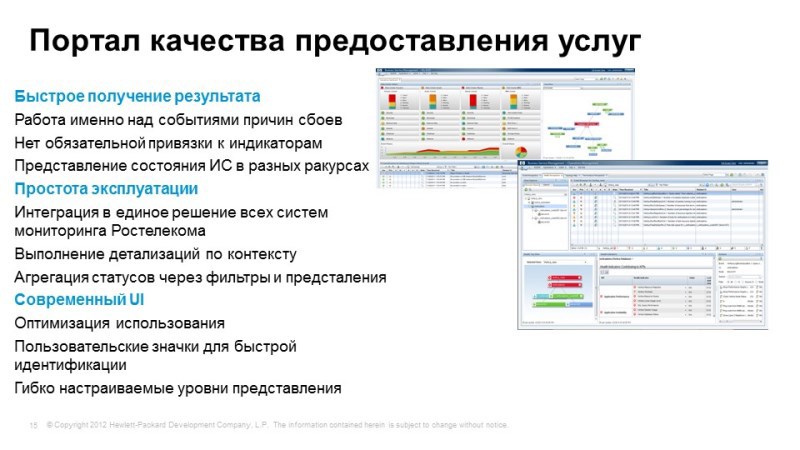
Thus, BSM (Business Service Manager) allows you to create a single consolidated view containing information about what services we use, how they feel, how individual components feel. This portal is well customized, in principle, for each specific role you can create one or more views. Users, of course, are limited to those services for which they are responsible and those tools that are available to them, even an ordinary user for himself, using a simple graphical designer, can sketch out a presentation that interests him. Or we can create for our users a number of representations that will be used to solve various tasks.
Operations Bridge
The next topic we'll talk about is Operations Bridge / Umbrella. Imagine that we have already solved the monitoring task in one way or another, we monitor the network, monitor data storage and transmission systems, software, and do it all with different tools. HP is not HP - no matter.
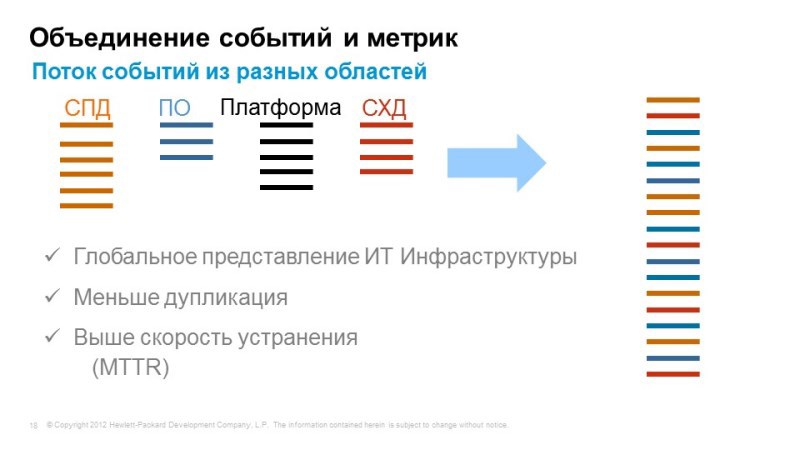
But we do not have a single console, which shows the work of all services in one window. In order to solve this problem, we suggest using Operations Bridge, which takes events, takes information about application topology from a wide variety of systems, integrates it all into a single console and allows you to correlate all these events in order to identify the causes and symptoms.
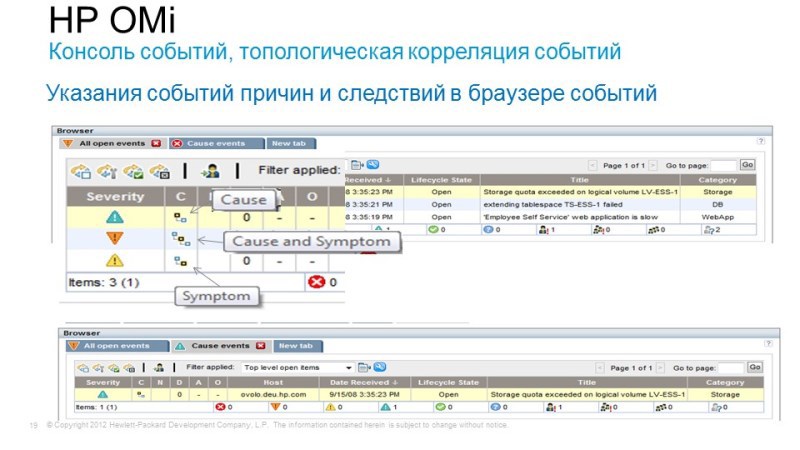
For example, a user logs on to Internet banking, tries to perform some kind of transaction - he fails. It does not work because the database fails, but it fails because it was not possible to expand the disk spaces on the disk arrays. Those. The problem that worries us is the inaccessibility or poor quality of Internet banking, and the reason lies somewhere far away in the storage system. Operations Bridge just allows you to combine and correlate all these events using interesting correlation methods: firstly, this is Topology Based Event Correlation, when we have the uCMDB service topology, and depending on what components a particular service is associated with, we can understand how certain events affect its availability. Since the uCMDB model is dynamic here, something has changed - by changing the discovery, the correlation rules are automatically rearranged. And the second method - Stream Based Event Correlation, when according to the time of occurrence of certain events, we can assume that they are related to each other, as well as identify what is the cause and effect.
Thus, we can combine all events in a single console, combine all QPIs that interest us, and make this console a central monitoring system. When we need more detailed information, we can delve into the system from which we obtained this monitoring data.

What else is interesting is that the Operations Bridge allows you to automate the monitoring settings using the Monitoring Automation tool built into the Operations Bridge. It allows, for example, to create typical monitoring settings for certain services.
For example, we have added Oracle DB, we can automatically send, put under monitoring using standard and standard templates. Or the service topology has changed, it moved to another platform, another hypervisor changed the monitoring rules so that the system monitors exactly what is happening now, not what happened a week ago.
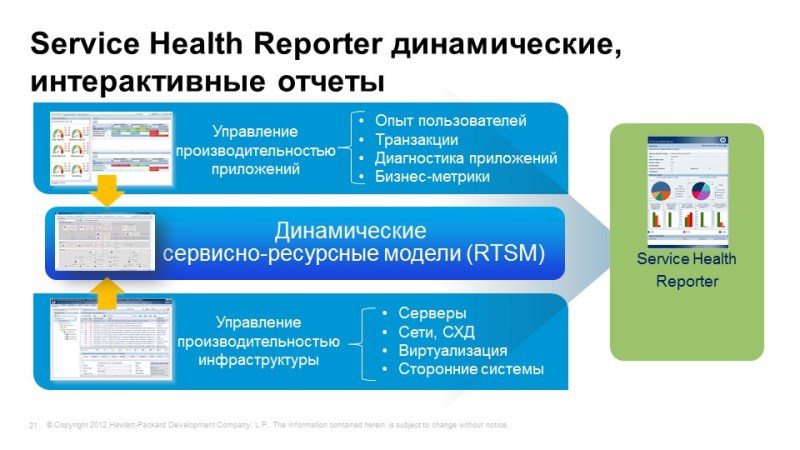
And, of course, reporting. Operations Bridge includes Service Health Reporter, which allows you to combine metrics from different systems and build consolidated reports, again, with reference to business services, to duty service models. Something has changed - reports, therefore, will also be automatically rebuilt. In the box a large number, about a thousand, various reports, and accordingly, you can create your own.
Operations Analytics

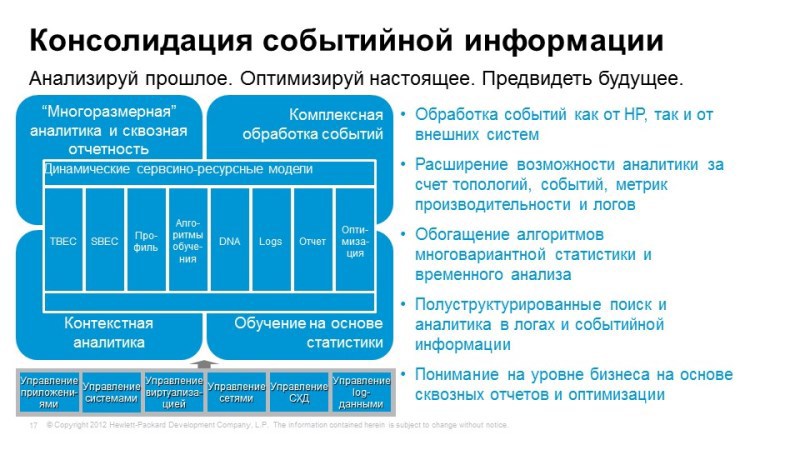
And the third thing you wanted to talk about: Operations Analytics. As I said, when we use traditional monitoring tools, we know that we want to monitor, the events themselves are much more than we can predict, it would be nice to have logs per gigabytes of logs that we have stored, or a huge amount of performance data combine them all, we need an intelligent and intelligent tool to work with all this information to identify unusual situations. Operations Analytics uses BigData technology, for example, vertical is used as a database (have you heard about vertical?). Let's tell in two words.

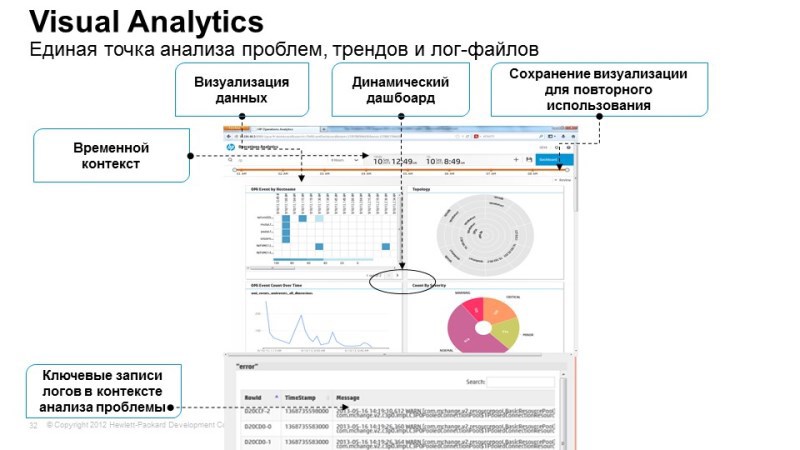
What does Operations Analytics do? We send all logs to it, all performance data. All these data are reduced to a single format. Operations Analytics allows you to store all logs, performance data and allows you to build a time correlation between events, allows you to look at how the service felt at any time.
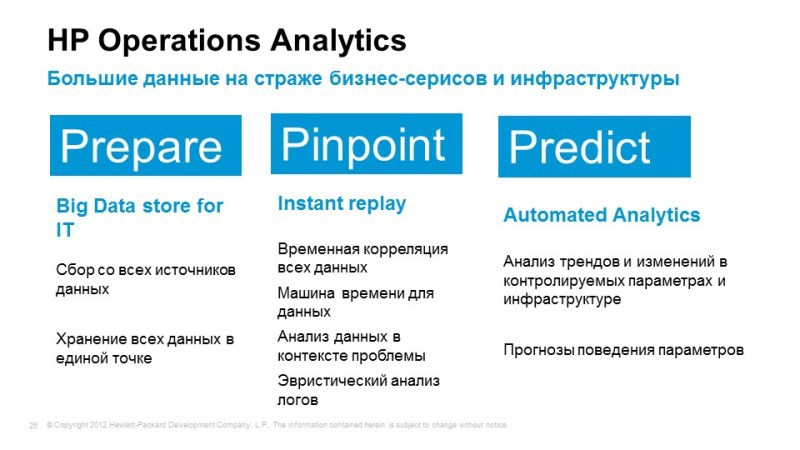
The mechanism of the time machine allows you to rewind at the moment when the failure occurred and see what events occurred at that moment, what, for example, were performance indicators, channel loading, etc. and identify trends, build forecasts on the status of our services.
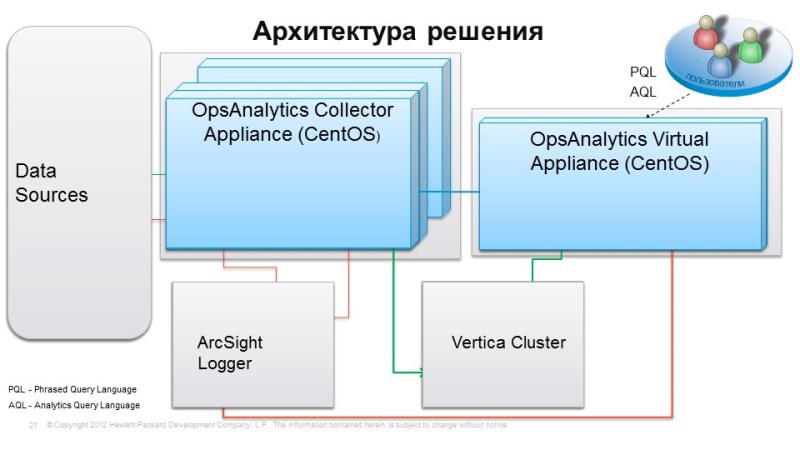
Architecture: Vertica

, : Vertica – , , , . Vertica , , , 86-, , , . , , 3 , 6, , , . , Facebook c ,
, OpsAnalytics ArcSight Logger. . ArcSight Logger , , , . data sources, .. , , .. , , , . , .
Vertica . . OpsAnalytics Vertica 4. , .
Conection Manager, , , . -, , . -. OpsAnalytics. Those. . , BPM, , OpsAnalytics . , , , .
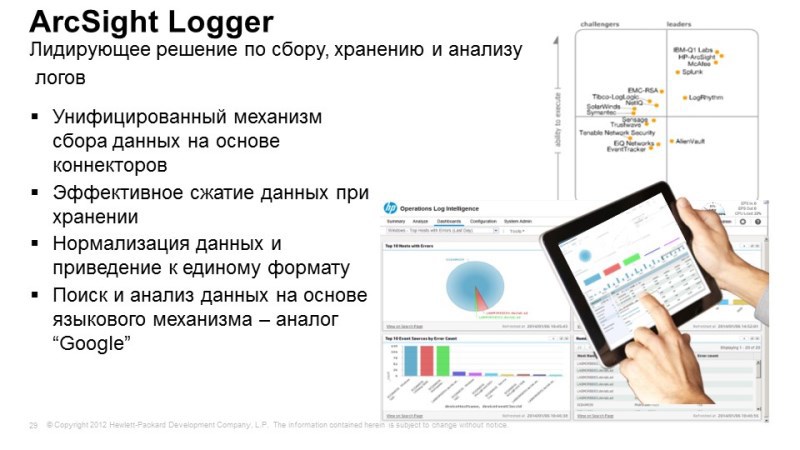
ArcSight Logger – , , , , , . , .

, ? , . , , , . , , , .. , — , , . , , , , - “” .

, , , , . - , , , . , , .
– . . , , , , . , , , , . .
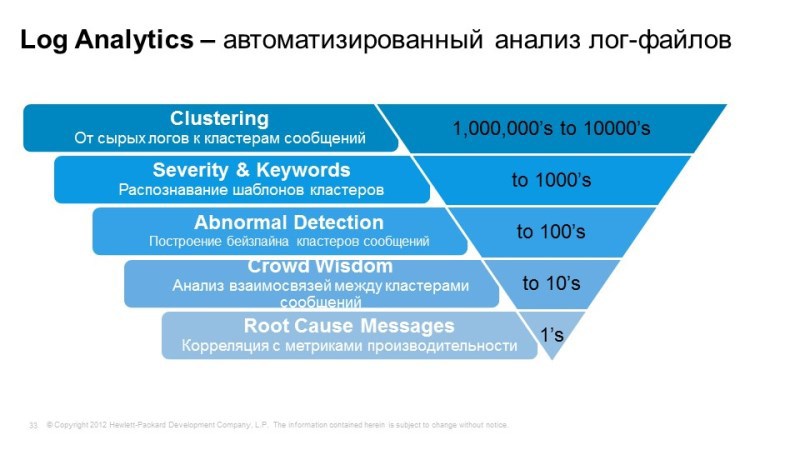
– , , . , , .
( )
, -. , -, , – . , , Application Performance Overtime, , .
, , , , , - . , , , , , , , , , , , . 93 20, . , , , , .
. . Transaction Performance Overtime , , . . , . . Application Transaction Response Time , .
, , .
, Predict , .
Advent Rebanking – -, . , , , , .
, - , , . error, .
, , , .
( )
MUK-Service - all types of IT repair: warranty, non-warranty repair, sale of spare parts, contract service
Source: https://habr.com/ru/post/263715/
All Articles