Introduction to the analysis of social networks on the example of VK API

Social media data is an inexhaustible source of research and business opportunities. Using the example of Vkontakte API and the Python language, we will analyze a couple of practical examples today that will help us learn:
- Basics of working with the Python library - networkx;
- how to access the Vkontakte API from the Python language through standard libraries, in particular, to get a list of friends and group members;
- some features of the program Gephi.
Disclaimer: this article does not pretend to any novelty, but only aims to help those who are interested in gathering their strength and begin to put their ideas into practice.
(hair ball to attract attention)
And we start immediately with the first task: to build an egocentric graph of friends, removing itself.
import requests import networkx import time import collections def get_friends_ids(user_id): friends_url = 'https://api.vk.com/method/friends.get?user_id={}' # access_token , OAuth 2.0 json_response = requests.get(friends_url.format(user_id)).json() if json_response.get('error'): print json_response.get('error') return list() return json_response[u'response'] graph = {} friend_ids = get_friends_ids(1405906) # user id, . for friend_id in friend_ids: print 'Processing id: ', friend_id graph[friend_id] = get_friends_ids(friend_id) g = networkx.Graph(directed=False) for i in graph: g.add_node(i) for j in graph[i]: if i != j and i in friend_ids and j in friend_ids: g.add_edge(i, j) pos=networkx.graphviz_layout(g,prog="neato") networkx.draw(g, pos, node_size=30, with_labels=False, width=0.2) The result of the work of the code was this graph:
')
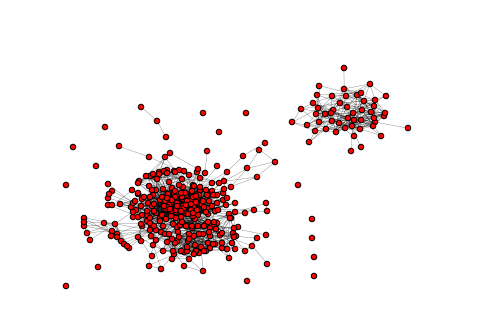
In my case, with my eyes we can distinguish 2 large components of connectedness: friends from two different cities of residence.
Some users may open this or that information only for registered users or for friends, so some of the methods may sometimes require authorization (transfer of an access token). In such cases, there is a limit in the form of limits on the API. The VK documentation states that the limit for a client application is 3rps, and for a server application a progressive scale depending on the number of application installations (rps / number of installations): 5 / <10,000, 8 / <100,000, 20 / <1,000,000. 35 /> 1,000,000.
Also in the documentation there is the following paragraph:
In addition to restrictions on the frequency of calls, there are also quantitative restrictions on calling methods of the same type. For obvious reasons, we do not provide information on exact limits.
So, for example, calling the users.search profile search method or the wall.get user wall viewing method when a certain limit is exceeded (but not exceeding the documented limits) begins to produce empty results. This situation can generate errors: for example, when searching for users, you may find that there are no results for this search query, but in fact there are no results.
Below is a code snippet to help you take into account documented limits, for example, 3 requests per second.
deq = collections.deque(maxlen=4) def trottling_request(url): deq.appendleft(time.time()) if len(deq) == 4: # 3 , - time.sleep(max(1+deq[3]-deq[0], 0)) On the same graph, we consider an example of using the Gephi program. Gephi is an open source program for analyzing and visualizing graphs, written in Java, originally developed by students of Compiegne University of Technology in France. Gephi was selected to participate in the Google Summer Code in 2009, 2010, 2011, 2012 and 2013 [wiki].
For a start, let's save our graph in .graphml format - a format for describing graphs based on XML.
networkx.write_graphml(g, 'graph.graphml') Having exported, load it into Gephi and get something like this:
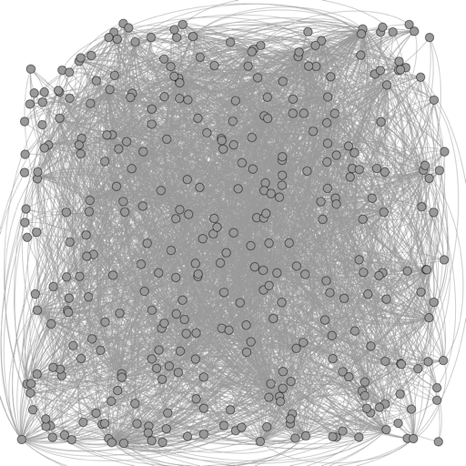
Gephi has great functionality that expands with a variety of plug-ins. Below are examples of visualization.
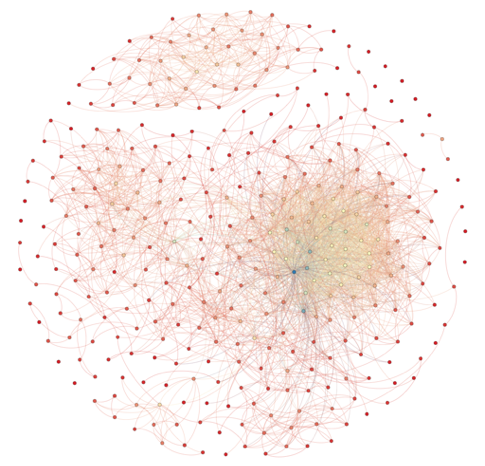
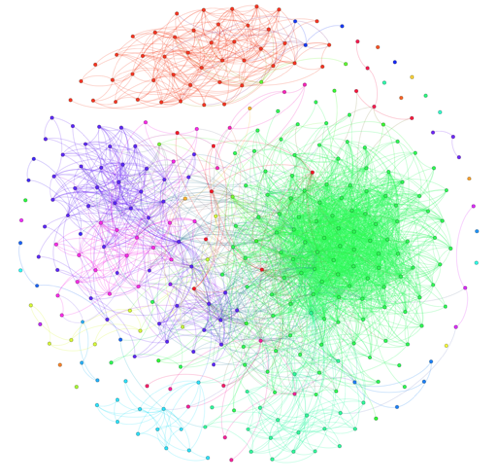
Centrality (PageRank centrality, Degree centrality, Eccentricity centrality). Different colors indicate different values of centrality.


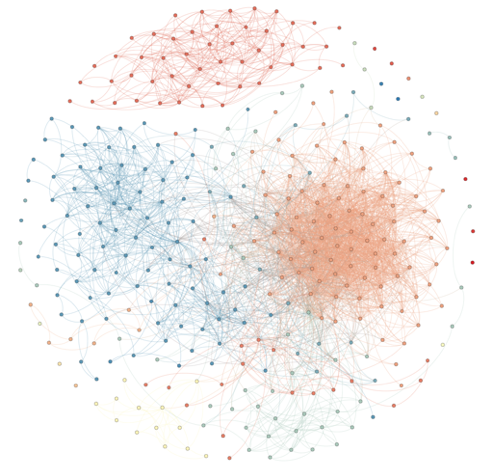
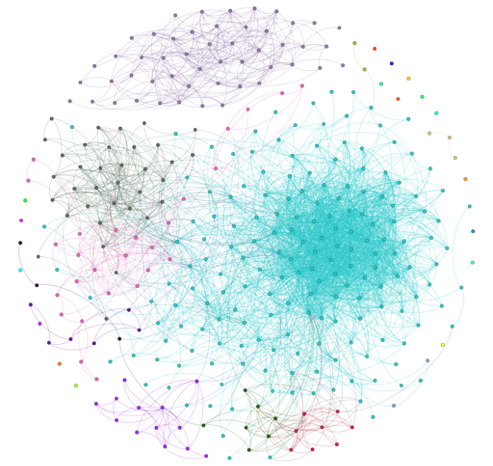
Clustering (Modularity lustering, Markov lustering, Chinese Whispers lustering). Different colors indicate different classes selected by the algorithm.
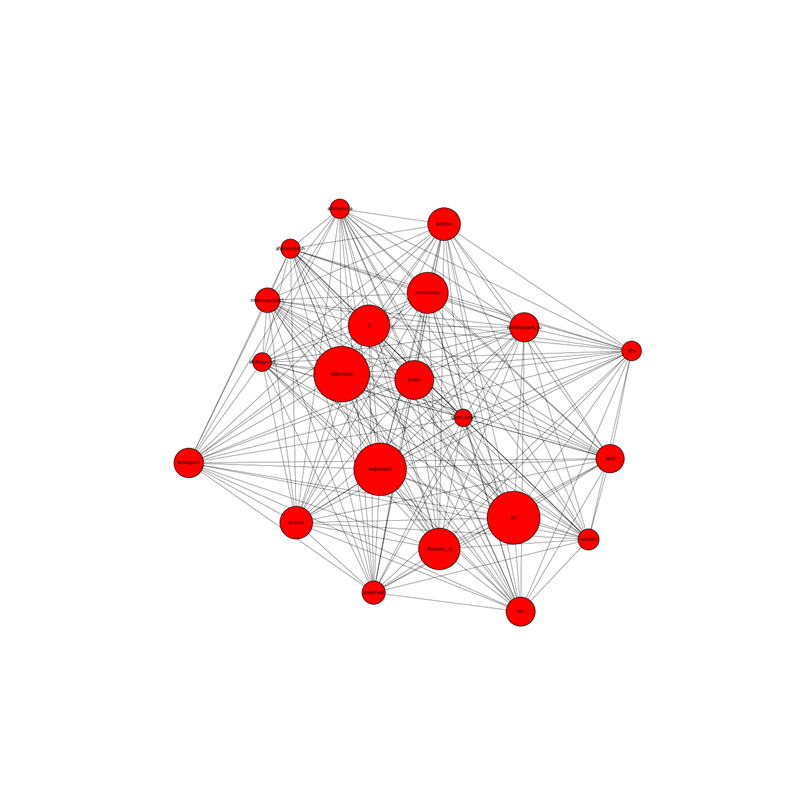
The latter task is inspired by one of the labs of the first set of the Big Data Specialist course from New Professions Lab. On the basis of a well-known list of groups of the social network Vkontakte, it is necessary to construct a graph:
- peaks - social network groups;
- edges - the presence of general subscriptions;
- the larger this group of subscribers, the larger the size of the vertex;
- the more groups of common followers, the closer the vertices are to each other.
As an example of groups we will consider groups of news publications, if you wish, you can try other groups.
%matplotlib inline import networkx import requests import json def getVKMembers(group_id, count=1000, offset=0): # http://vk.com/dev/groups.getMembers host = 'http://api.vk.com/method' if count > 1000: raise Exception('Bad params: max of count = 1000') response = requests.get('{host}/groups.getMembers?group_id={group_id}&count={count}&offset={offset}' .format(host=host, group_id=group_id, count=count, offset=offset)) if not response.ok: raise Exception('Bad response code') return response.json() def allCountOffset(func, func_id): set_members_id = set() count_members = -1 offset = 0 while count_members != len(set_members_id): # posible endless loop for real vk api response = func(func_id, offset=offset)['response'] if count_members != response['count']: count_members = response['count'] new_members_id = response['users'] offset += len(new_members_id) if set_members_id | set(new_members_id) == set_members_id != set(): # without new members print 'WARNING: break loop', count_members, len(set_members_id) break set_members_id = set_members_id.union(new_members_id) return set_members_id groups = ['http://vk.com/meduzaproject', 'http://vk.com/tj', 'http://vk.com/smmrussia', 'http://vk.com/vedomosti', 'http://vk.com/kommersant_ru', 'http://vk.com/kfm', 'http://vk.com/oldlentach', 'http://vk.com/lentaru', 'http://vk.com/lentasport', 'http://vk.com/fastslon', 'http://vk.com/tvrain', 'http://vk.com/sport.tvrain', 'http://vk.com/silverrain', 'http://vk.com/afishagorod', 'http://vk.com/afishavozduh', 'http://vk.com/afishavolna', 'http://vk.com/1tv', 'http://vk.com/russiatv', 'http://vk.com/vesti', 'http://vk.com/ntv', 'http://vk.com/lifenews_ru'] members = {} for g in groups: name = g.split('http://vk.com/')[1] print name members[name] = allCountOffset(getVKMembers, name) matrix = {} for i in members: for j in members: if i != j: matrix[i+j] = len(members[i] & members[j]) * 1.0/ min(len(members[i]), len(members[j])) max_matrix = max(matrix.values()) min_matrix = min(matrix.values()) for i in matrix: matrix[i] = (matrix[i] - min_matrix) / (max_matrix - min_matrix) g = networkx.Graph(directed=False) for i in members: for j in members: if i != j: g.add_edge(i, j, weight=matrix[i+j]) members_count = {x:len(members[x]) for x in members} max_value = max(members_count.values()) * 1.0 size = [] max_size = 900 min_size = 100 for node in g.nodes(): size.append(((members_count[node]/max_value)*max_size + min_size)*10) import matplotlib.pyplot as plt pos=networkx.spring_layout(g) plt.figure(figsize=(20,20)) networkx.draw_networkx(g, pos, node_size=size, width=0.5, font_size=8) plt.axis('off') plt.show() The result will be this graph:
Of course, the tasks presented here only demonstrate the simplicity and accessibility of working with social networks. In fact, it is necessary to solve more complex problems. So, for example, social profile data can enrich DMP system data (age, interests, social group): the main task will be to find and put a social profile in the user of a DMP system. There are also many startups that use social networks as a source for creating resumes: amazinghiring, entelo, profiscope, gild, etc. The main tasks here will be: to find the same user in different social networks and on the basis of data obtained from social networks, create a user summary, as most social networks, except, perhaps, linkedin, do not have enough information suitable for the summary.
Source: https://habr.com/ru/post/263313/
All Articles