We build a performance bench on the example of the server Set Retail 10
Hey. I want to tell you how we went along the way of understanding the performance of our Set Retail 10 system. Namely, how we learned to measure performance, and in what ways we monitored its changes.
For testing, we built a performance bench, and now we run load tests on it for several days. At the stage of development of the test stand, we broke a lot of copies on the boards of fierce disputes. But we managed to find answers to the most important questions - what and how to do, and in what sequence. I would be glad if our experience will be useful to you.
A few words about the Set 10 server. This is an Enterprise Java application for 500 bins, which are divided into about 100 modules. Each of the beans is more or less related to the others. This small army (more precisely, the battalion) of bins serves 20-30 data streams. Logically, they are independent of each other, however, since everything is spinning on one machine, when a stream of data begins to flow, this also affects other processes. I would compare this system with a boiler where bins are “boiled” and which can “digest” everything that is thrown into it.
')
Until recently, the issues of server performance Set 10 were solved "raids." We looked at places that from our point of view did not work quite optimally. For such places, one-time scripts were written, loading these places and somehow showing their “patency”. Then, work was done to optimize such “problem areas”, and the “load and measure” scripts were run again. According to the results, the difference looked, conclusions were made, how much the speed increased in this place. Then they reported to the authorities, everyone was happy, but we couldn’t answer one question (and we were often asked): “OK, you optimized it, and what did it give to the whole system? How much did she work faster? ”
It would have continued this way, but we needed to develop a systematic approach to the issue of productivity. The impetus for this was the need to put forward system requirements for iron, which will spin our complex system. And the difficulty here lies in the fact that there are many modules and a lot of data streams. Each user of the system can use some modules and not use others. For example, one client can use an external loyalty system, and this will in no way load most of the modules of our server, while the other will use it actively, having millions of client cards and actively issue bonuses, coupons, gifts, etc. to them.
One client can generate 1 check in half an hour from 300 cash registers, and another can actively trade in check speed per minute at each of the 20 cash registers. It turns out that the same version of such a “complex system” may have different requirements for different clients. It was then that the understanding came that the system of “raids” does not help to solve this problem. We can not set the requirements for the entire system as a whole. You need to know what the configuration of the client, and this is the first dependency we discovered.
To answer this question you need to take some equipment m1, m2, .... and some set of configurations k1, k2 ... and find for each such configuration ki equipment mj - in which this configuration will cope with the client's tasks, namely sales service. At once I will say that we separately identified 3-4 configurations, which we took as basic ones (in order to somehow reduce the number of options), and for which we will look for requirements. So, the main question is how well does a particular server work on a particular machine? That is, taking the Ki configuration on the Mj hardware, how to determine if the system works well?
Logically, this is the mapping function of the server working under load to the number of:
F (x) -> y
Having programmed such a function in the form of a code / script / stand - we will get a powerful tool that will help us answer all the questions put before us. But first things first.
F (x): what is this function and from which variables is it considered?
This feature counts how “well” our complex system works. Without going into the implementation, we can immediately say that it depends at least on hardware (the system will work better on fast machines than on slow machines), the configuration of a complex system (what I mentioned above, someone uses the same modules, someone else), versions of the code (with the release of new versions of the system, its performance may increase, or vice versa, decrease). Here you can come up with something specific for you, but in our company we agreed that these parameters reflect the performance dependencies well. Total function from 3 variables turned out.
-> y: what's the meaning?
A numeric measure of whether the server is working well. If the number is large, the server works well. If the number is small, the server does not work well. This number can be either something abstract (performance points) or very specific (speed in concrete units). It is important that it is one number, then it becomes clear why. We in the company have agreed that we will have this percentage of the business requirements achieved during this run. That is, if we get the result F (x) = 84%, this means that the system meets the requirements of the business by 84%.
So we got the description of the function as:
F (hardware, configuration, version) ->% of business requirements
If we are able to implement this function programmatically, then we will just get our performance testing booth, which will be able to issue the appropriate hardware for the configuration, and, based on the iron, say what configuration of the system we can count on. Among other things, at such a stand it will be possible (by fixing the hardware and configuration) to measure the performance from version to version, and if you fix the hardware and version, you can select the parameters inside the configuration that more than others affect performance.
Configuration
Of the 3 parameters of our performance function, only the configuration raises questions. Indeed, by running the same test on different equipment, we get different values of the performance function, this is understandable and does not cause any special questions. There are no problems with the version either - by running the test on different versions, we also have free dimension and can change it as we want. But with the configuration we had big questions. For example, what parameters should be included in the configuration? How to combine them? Who should formulate them - programmers or business? What to measure in a particular case?
After much debate, we came to the following conclusions:
1. Developers compile a list of factors within the system that affect performance (because developers are more knowledgeable in this matter). Each such factor should be understandable for all developers and businesses, should be able to load and measure it. The list of factors should be sorted in order of impact on performance according to the developers (real tests can confirm or deny this assumption).
2. Next, the business sets a requirement for each factor on the list. The requirement should not depend on other parts of the system, or on iron, or on other factors. We also used these requirements for quantification: the requirement is met - 100%, the requirement is met by half - 50%, etc.
3. Since the system works on the same machine, it is impossible to check them one by one (they can all work quickly in turn, but they all need to be slowed down by a real customer), so you need to load everything at once.
Example:
Examples of such factors in a retailer's sales automation system: The speed of loading goods, cards, the speed of delivery of checks from cash registers, the speed of generating reports, ...
Example of business requirements: speed of goods - 100 items / s for all cash registers, speed of cards 100 cards / s for all cash desks, check delivery time should not exceed 5 minutes.
An example of the configuration of these factors (average store): goods to load - 300,000, cards 10,000,000, cash desks - 20, checks are sent from cash desks - 1 check / cash desk / minute.
Implementation
To implement the performance bench, we looked at several ready-made solutions on which to base such a stand.
The requirements were quite simple:
1. Ability to run sh / bat scripts to install and configure the system on a remote machine before loading
2. Ability to run Java code to load the system on a remote machine
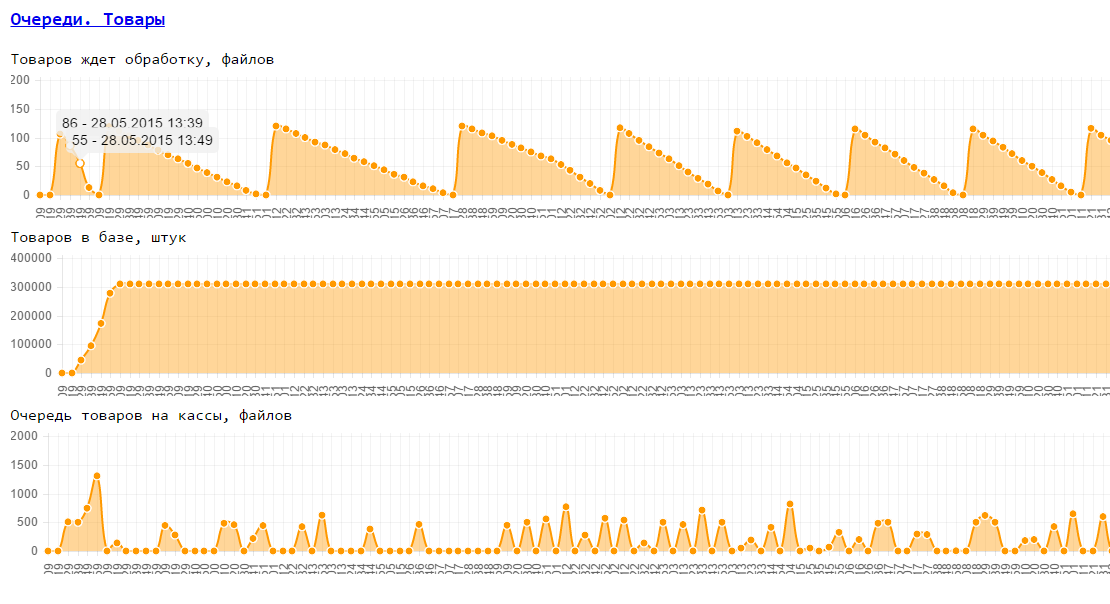
3. The possibility of removing both the base metrics of the machine (memory, disk, processor, network) and our internal metrics (accessibility via HTTP, internal queues in the database) during the test
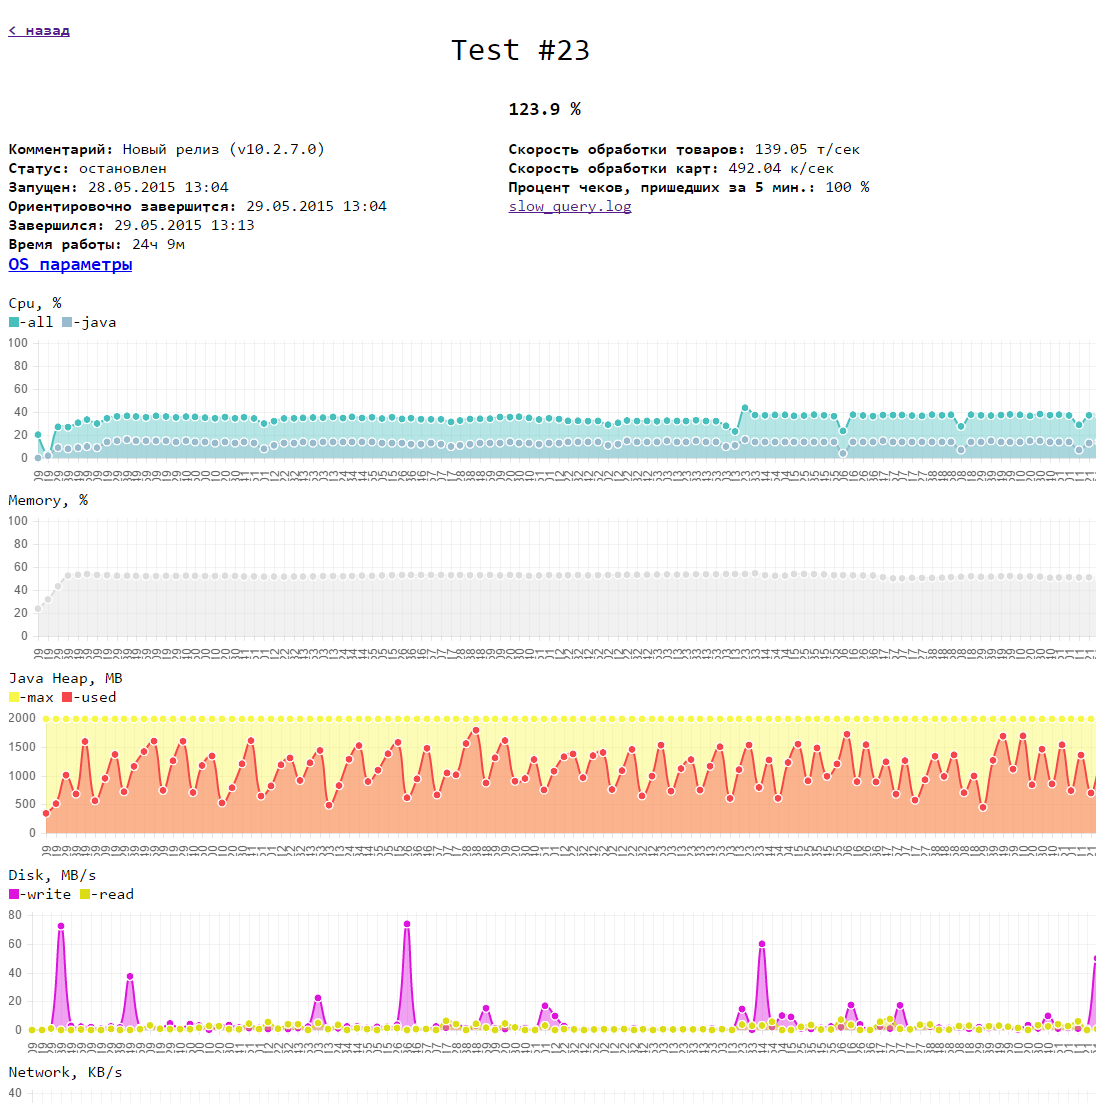
4. Ability to display all the test data on 1 page in the form of graphs. There may be additional test data (slow query log, memory analysis results ...).
What we tried:
1. JMeter - load testing system. Very specific tool. Originally developed for the load of WEB-applications, and it is felt. It is quite difficult to implement an arbitrary performance test so that load flows are created at a specific test location, so that there is a PRE test and a POST test. There are many problems with the visualization of test results (some graphs are built in and you can generate pictures on them, but still it is supposed to generate a shared page outside of JMeter). In general, it was easier to write your own test algorithm in Java than to deal with the variety of JMeter nodes and their sequence and restrictions.
2. Zabbix - monitoring system. Able to run scripts and monitor any metrics. We considered the possibility of stitching the logic of the test into scripts (I didn’t really want to do this) or render it in Java. A huge plus zabbix'a - he already knows how to monitor the main parameters of the system and you can easily add your own parameters for monitoring. Plus there are visual graphics. But we found an even simpler solution.
3. Glances - monitoring system. Allows you to monitor the main parameters of the remote machine. It is easy to install, runs as a server and has an API for HTTP / Json. Everything is very simple and convenient.
As a result, we implemented the test logic in Java, monitoring works at glances, a small web service can run tests and show their results (html, js), for charts we used chartJS
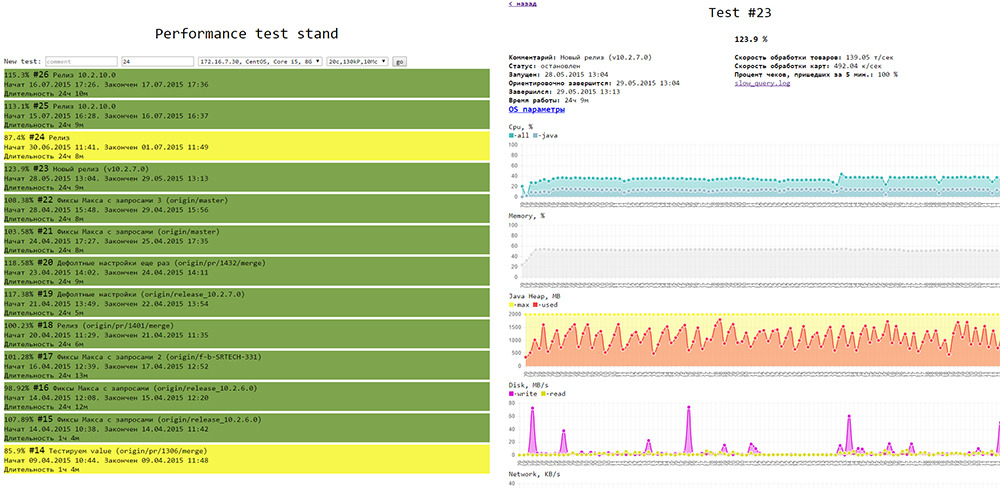
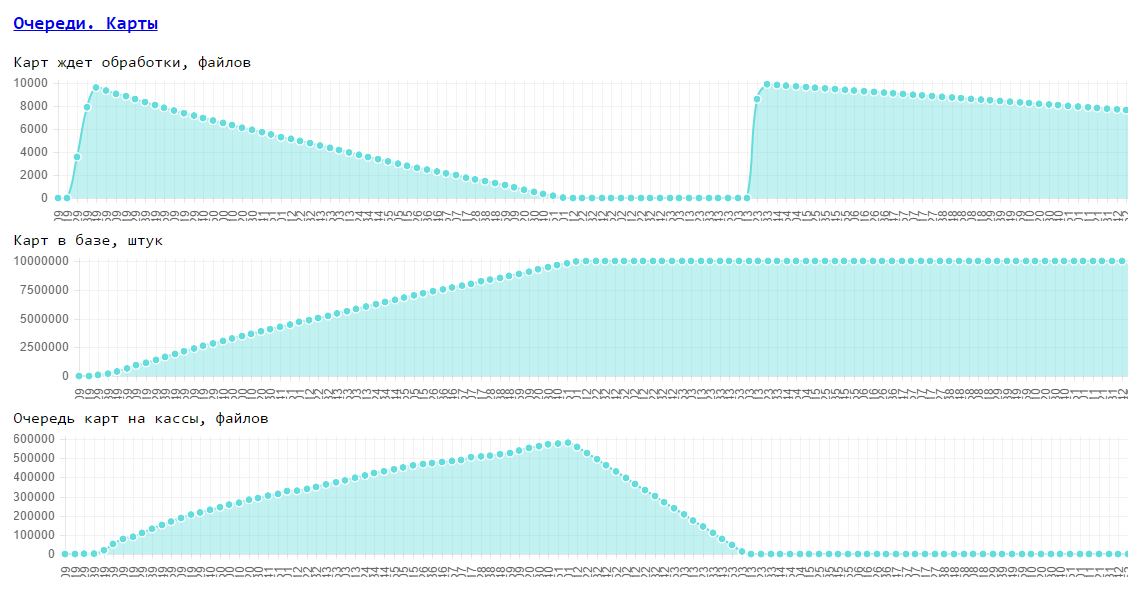
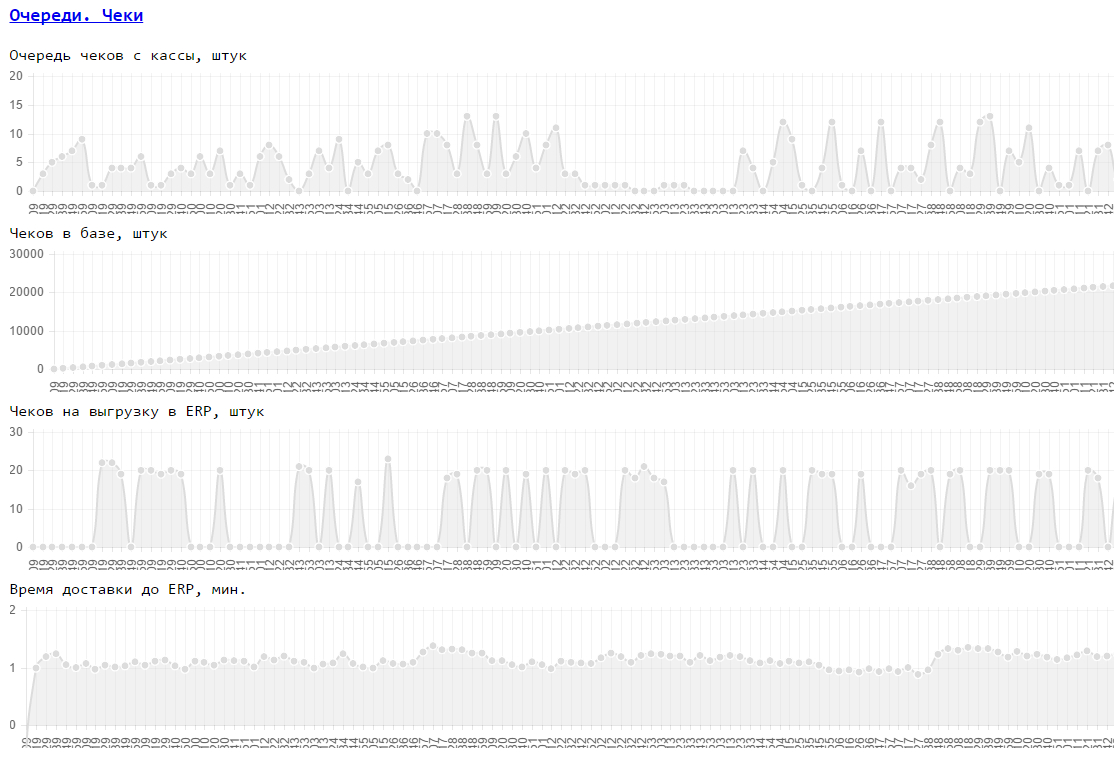
It looks like this: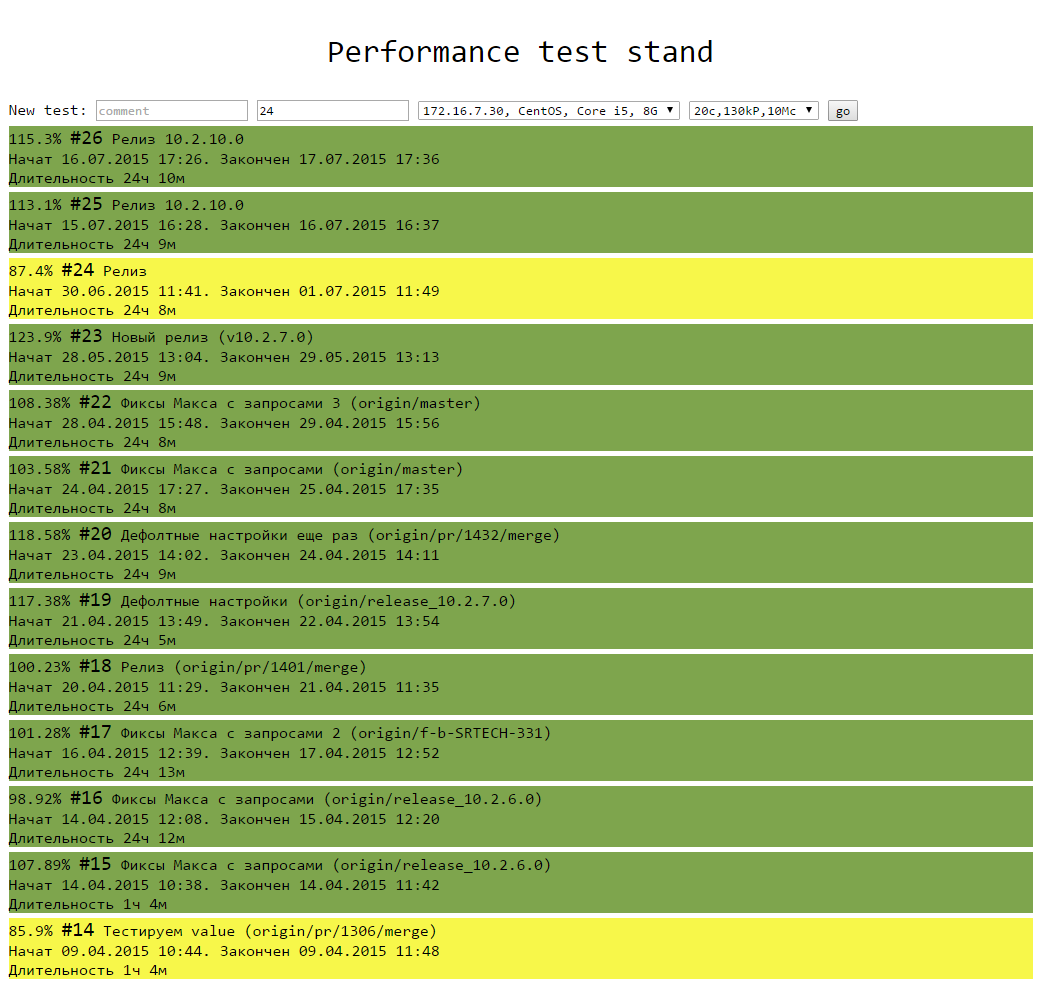

Source: https://habr.com/ru/post/262709/
All Articles