Fault detection on the example of determining the surface of an autonomous machine
 Hello!
In this article I will talk about how we did an autonomous machine based on our OS Embox , which detects a change in the type of surface on which it is traveling.
It so happened that in the New Year I was in the hands of a Chinese machine on the radio. Unfortunately, she did not go. I did not have a check from the store (the machine was a gift), and, frankly, I wanted to take it apart and look at the circuit elements. The usual way was to get the scheme, it was necessary to unsolder. Perhaps, at that very moment when I took up the soldering iron, I realized that it would definitely not be possible to return the machine to the store. In short, all winter parts of my window sill were gathering dust, until one day I was caught by an article from NASA about detecting a discrepancy in the rover.
')
Just imagine for a moment: somewhere far on the red planet, the rover is hanging, hung with sensors, on a surface that can hardly be called friendly. Therefore, it is necessary to ensure that it does not turn over, does not get stuck in the sand, does not roll down the hill, or, on the contrary, does not drive into it. How to do it? I wanted to answer such a difficult question.
The rover was not at hand, so I decided to make a machine with two sensors - a gyroscope and an accelerometer. And set the task to determine two situations:
- The machine began to go up the hill;
- The machine began to slow down sharply (for example, drove into the sand).
In this article I will talk only about the second situation, since it is the most complete in terms of implementation.
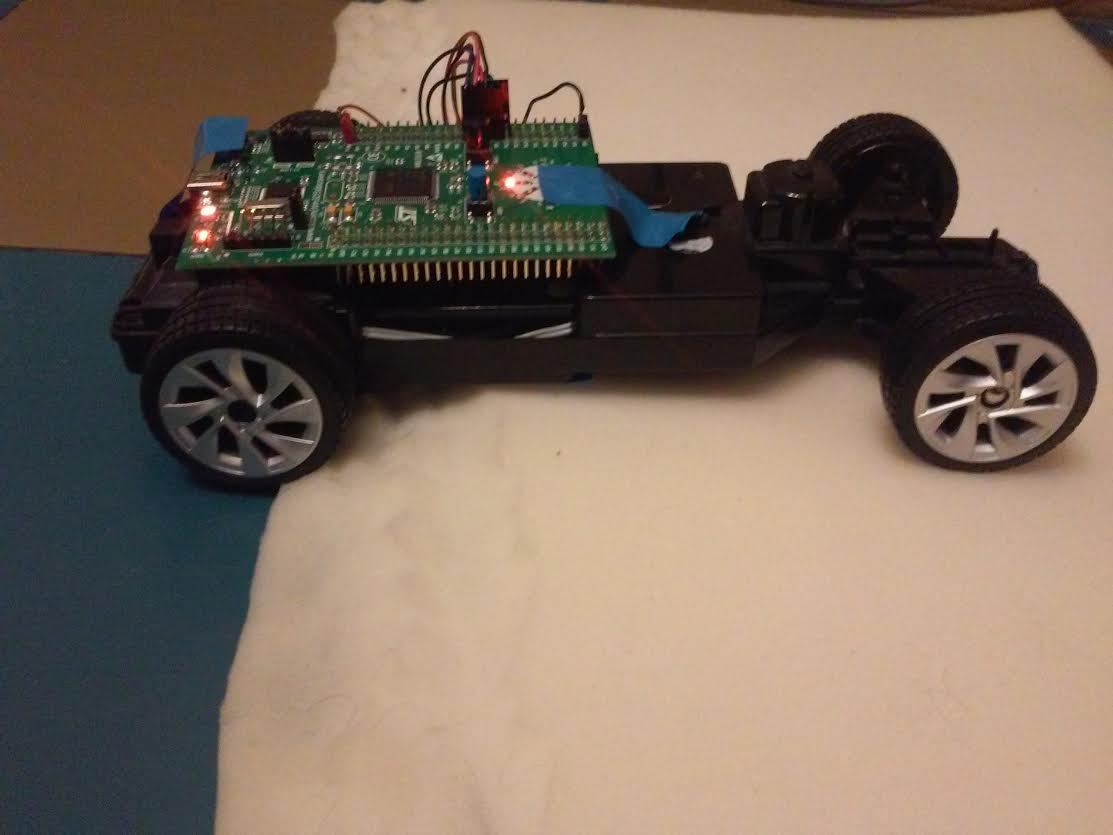
Two years ago I bought myself an STM32F3-Discovery, which included an Ecompass (magnetometer + accelerometer) and a gyroscope. Remembering that my colleagues already have experience in animating machines , I decided that I could try to apply this board.
Reviving cars
Having blown away a
When the machine started up and went, it was time to manage it. For these purposes, we have implemented several libraries : motor control, LED control, sensor library, signal filtering library, and finally, a library of alarms detection algorithms.
Test ground or 2 meters of foam rubber
Everyone knows that the first step in the software development process is writing tests (TDD) and creating a test environment. Therefore, before proceeding to the solution of the task, I began to develop methods to verify that the problem was solved correctly. Since the original task was for the rover, and I did not have the opportunity to simulate the ground well, I decided to use the available means at hand. This improvised tool turned out to be a piece of foam rubber, which, according to its characteristics, was very different from the surface of a table or floor. There was also an idea to use sand, but experiments had to be done in St. Petersburg, in which it rained constantly, so I had to restrict myself to “under-roof” methods (but, perhaps, the main reason was that I had to repeat the experiment quite often, and there was would be costly).
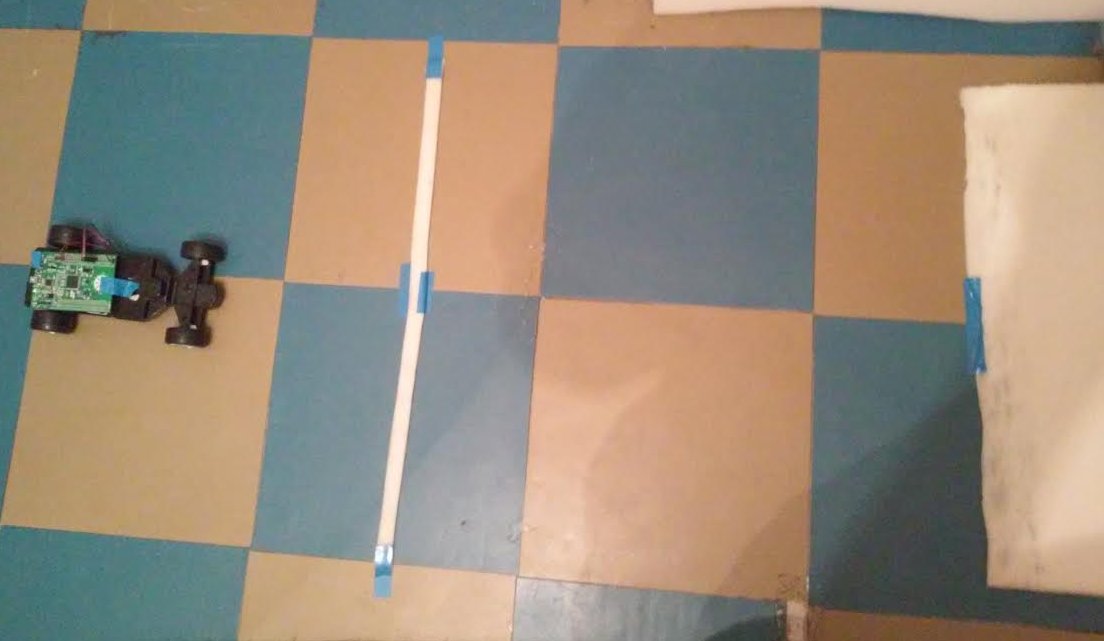
In general, as a verification of the correctness of the algorithm, I decided that the machine should go in a straight line until it decided that it hit a “bad” surface, and then just stop and turn on the LED. In general, it was assumed that there are two LEDs, because we wanted the algorithm to distinguish the problem that the machine encountered. The first is foam rubber, the second is just an inclined surface.
For testing, I ran a typewriter on a flat table surface and on a table with foam rubber attached to it. It is important that I wanted to detect not only a change in the table-> foam rubber, but at the same time ignore minor irregularities (in the photo below this is a strip of foam rubber).
Now what concerns the process of debugging the algorithm. We tuned the accelerometer to a frequency of 1344 Hz. In the polling mode, the values were read and raw were stored in flash memory. Then, the resulting values from flash memory were saved to a file by calling the flashdump command from the gdb debugger. After we had enough data files, it became possible to implement and debug algorithms in Python, and then transfer the already debugged code to the machine.
Let's return to our task.
Above, I mentioned the word frustration several times. And in practice, this is, in general, a very understandable state - when the system begins to behave unusually. But how to formalize it is unusual ?
Mathematically, this is described as “changing the probabilistic characteristics of a random process.” But this is a very general definition, we restrict ourselves to a special case. Let there be a sequence of random variables.
 In our case, these are readings from the sensors. We assume that this is a sample from a distribution with some parametric density
  . Let it also be known that at the initial time the value of the parameter is equal to some scalar
  . By this we will understand the discord . However, it is important to note that we are not interested in any changes in the density parameter, but only large ones of some h> 0. This parameter h should depend on the type of surface (that is, it is an input parameter of the algorithm that is chosen “by eye”).
Now that we have figured out what we are trying to find, we need to understand how we will do it. To detect the slowdown, we used the accelerometer readings along the axis in the direction of motion. As can be seen from the graph, the readings are noisy, so the original task is divided into two subtasks:
- noise filtering;
- frustration detection

Red marked the fragment on which the slowdown occurred. Green - uninteresting to us random irregularities. Let's now take a closer look at the filtering task.
Noise filtering
Often the task of filtering set in this way. Will consider

where y (x) is the observed variables (in our case, these are accelerometer readings), f (x) is the real signal (without noise),
 - noise (we believe that it has a standard normal distribution). Required to build an estimate
  for
for  .
.Suppose that f is continuous (in our case, this is a fairly natural assumption about the continuity of acceleration). In this case, the usual average can be used to estimate:

Where
 - many points of observation,
  - power set . But the question arises of how to choose the window size, because we know nothing about f. Is it possible to somehow choose it dynamically in order to achieve a better result? It turns out that it is possible.
How to choose a window?
A small philosophical retreat. In fact, of course, you can take a moving average, choose a window empirically and say that everything works. But every time from 10 launches, when the machine could not detect an obstacle for any reason, I began to doubt it. Therefore, let's try to get the most out of the data that we have in order to choose the window as well as possible.
I relied on the article " On the Spatial Adaptive Estimation of Nonparametric Regression ". It presents various theoretical assessments, but in this article I will not consider them, but I will tell you about the idea itself. So, the question is how to choose the best window if a priori information about the function f is unknown. To answer this question, we estimate the upper bound of the error difference as follows: |
- | rated as
Where
 ,
,  =
=  . The right side of the inequality consists of two parts - deterministic dynamic error.
  which is completely determined by the function f, and the stochastic error
  which is completely independent of f. Since the noise in our case has a standard normal distribution, the error can be limited from above to the exponent (with a certain probability):
where c> 0, some constant (Here I will not describe why this is so, I can only say that during the test I used the confidence interval for the mathematical expectation of a normal sample .)
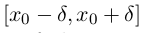
Let the choice of the optimal interval comes from
 . That is, we fixed the point and build nested intervals with the center at this point, among which we are trying to choose the best. Then, taking advantage of the boundedness of the error, the following inequality can be obtained at each of these intervals:
It is easy to verify that as i grows, the deterministic error grows, and the stochastic error decreases. Therefore, it is reasonable to choose a window that would balance these errors. In other words, you need to find the maximum I, such that

 . Denote
  and we will build the intervals of the form:
 ,
,Where
 this is the top score on
  what follows from the assumption that
  . It is clear that these segments will have a common point in the intersection - . Now it becomes clear that you need to build such intervals as long as they have a common point of intersection, and then take the last one as the window (it will be the largest). The result of applying such a filter is shown in the graphs below. It can be seen that the bursts remained almost unchanged, but the oscillations along them smoothed out.
Fig. 1. Initial raw data from accelerometer

Fig. 2. The result of the filter
Now that we have learned how to filter the noise, we move on to the second part, the detection of frustration.
Filtered Derivative Algorithm
As I wrote above, discord is a change in the probability characteristics of a random process. An example of such a probability characteristic can be the mathematical expectation. To be more precise, we are interested in the mat. waiting for a sample on some window. The graph of raw data shows that the mat. waiting somewhere around 0.

Figure 3. The red line - the average value of the sample on the window size of 200.
And now let's take the absolute value of acceleration. As can be seen from the figure, there is a surge mate. waiting This surge we will try to detect.

Figure 4. Red line - the average value of the sample on the window size of 200.
At the core of many methods of detecting disorder is the concept of likelihood function . This function allows us to estimate the density distribution parameter, which we talked about at the beginning. In other words, it gives an estimate for an unknown parameter using the well-known accelerometer reading. To understand which distribution most likely belongs to y, the likelihood ratio logarithm is used:

(I did not find an explanation of why logarithm is here, but most likely because of convenience: many popular distributions belong to an exponential family, and ln removes the exponential).
As a rule, it is interesting not to change a single value, but to change the values in a certain window. To do this, you can build the following amount:

Where
 - some filter, N - window size. Let us now once again understand what interests us? We want to track change mate. waiting for accelerometer values along the x axis. At the same time we want to track the sharp slowdown of the machine. In other words, we are interested in changing the derivative of the function.
  . Since everything is discrete, the derivative is replaced by a difference scheme:
The moment of disorder will be defined as:

that is, we count the number of changes in the derivative by more than h, and if the number of such changes is greater than
 , there was a discord. In the event that we are interested in changing the mat. waiting then the function takes the form:
Where,
 - the average of two mat. expectations - initial and threshold.
Now if as
take a triangular filter (i.e.  ) in order to take into account later data with less weight, you can get the following formula (easy to check on paper :))
Where
 . That is, we track how much the average value has changed on neighboring windows. And that's what happened for the machine:
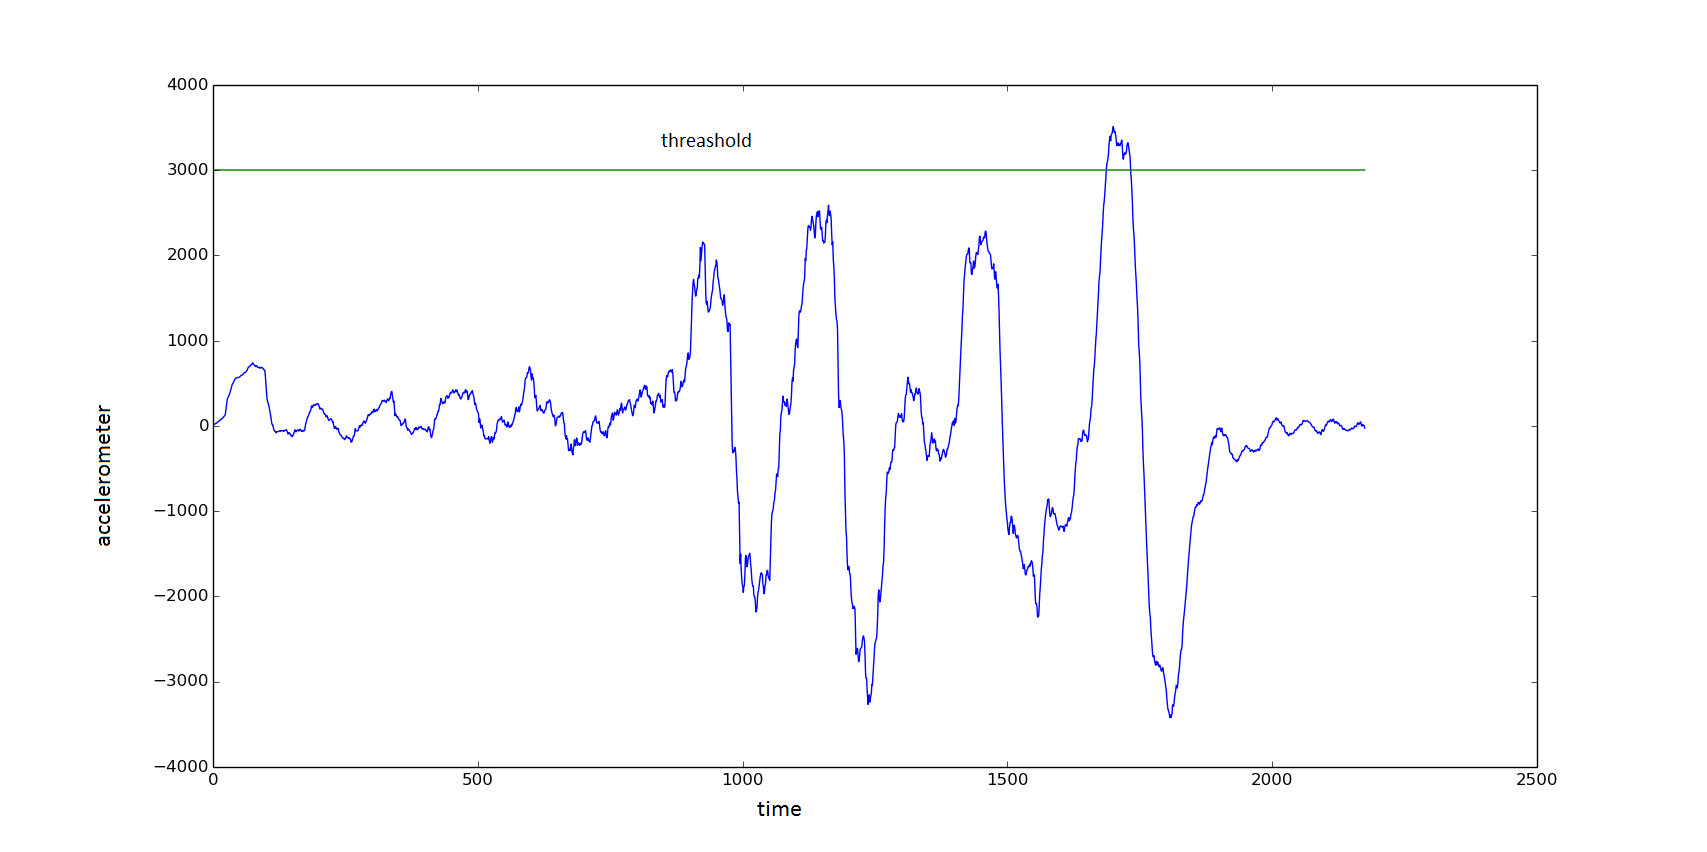
Figure 5. h = 3000 (the threshold line on the graph)
= 1.Result
The result of the two algorithms described above. Once again I remind you what should have happened - when a slowdown is detected on the foam rubber, the machine lights the LED and turns off the motors.
Conclusion
Summing up: we managed to recognize a serious slowdown of the machine, while ignoring the minor interferences in its path. With the machine, I went to TMSH 2015 , where I was just told about the choice of the window - thanks for this to the participants and teachers :)
If the article seems tolerable to you, then in the future I could tell you about our further progress - using the Kalman filter to detect inclined surfaces, analyzing the dispersion (and not the mat. Expectations in this article), and generally what methods for solving this kind of problems.
I did not provide code snippets in the article, but gave a link to the source code, since there is not a lot of code. But if you have questions on implementation, I will be glad to answer them.
PS
When I was at TMSH 2015, several guys were interested in the software inside the machine, so leave links to the code . If someone is interested, you can repeat everything that is described in the article yourself. Or maybe someone will even improve the algorithm or advise how this can be done.
Source: https://habr.com/ru/post/262685/
All Articles