Creating a map of a comfortable walk
This story is about a small project " Walking Streets ", which is designed to help people comfortably move around the city. The current stage of the project is a very early prototype demonstrating certain ideas and opportunities. At the same time, I decided to publish it in order to collect feedback from the outside world and like-minded people.
I still like cards and I love them and talk about them , and sometimes I do something like that sometimes with cards. And now the story will also be about the map service.
What makes the city fit for comfortable walking and what makes walking around the city comfortable and enjoyable? To find the answers, I asked a group of people to describe their experience of walking and tell what is important for them when they are not in a hurry, and would like to take a walk around the city.
')
It turned out that the following parameters are important to them:
Reflecting further, we (I and a group of caring acquaintances to whom I told ideas) came to the conclusion that it is possible to help pedestrians from both sides at the same time: to improve urban space, make the environment more convenient, or create services for pedestrians to help make their walk more comfortable. However, it usually begins with an analysis and clarification of the current situation. So the idea came to make a tool for interactive study of the urban environment at the first stage.
The very first prototype of the service was:
The first version of the prototype used fictional data about several environmental parameters. The main idea: a convenient interface for studying the terrain and selecting a place for those parameters that are relevant for each person personally.
A few words about how I made this prototype:
Having tested the first prototype on friends, it was decided to refine this concept and use the real data as the next step. It also became clear that in the first stages, it is worthwhile to abandon the weakly measured parameters, since people perceive some properties of the street in different ways: it seems comfortable to someone, but not to others. In the future, such indices will be added, but they will already be based on user ratings within a sufficient number of user ratings for this.
I really wanted the data for the project to be open and accessible, so that anyone could add important information for him, experiment with the data and explore it himself.
Where to get the real data? There are no such open data that people need for Moscow, and therefore we will collect them on our own, and in order not to only collect data and still have time to do something interesting, we have limited the study area to two parts of districts Yakimanka and Zamoskvorechye within the Garden Ring.
 Urban Explorer Recruitment
OpenStreetMap turned out to be the most suitable base for the project, in addition to the set of available tools and technologies, each pedestrian in the city has the opportunity to mark or clarify the data under study, the OSM map is created and edited by users.
As a result, after a series of field studies and experiments, we collected some parameters about the city streets and we had a small interactive project with real data, which we called “ Walking Streets ”
The project tells 4 stories about the city in the area we studied: the width of the sidewalks, the accessibility of the environment (entrances to buildings, stairs), noise on the street and interesting places.
Now this is not a complete user service that could solve all the problems of comfortable moving around the city, rather, it is a slightly more elaborated version of the prototype, which we publish in order to collect feedback, find out which points should be worked out in more detail or completely redone it.
About each data slice we will tell more:
Almost all the services we are used to using mean that the street marked on the map is suitable for walking. In reality, this is not the case. The pavement is not always on both sides, sometimes it ends suddenly, sometimes it can be very narrow and inconvenient.
We decided to tell the story of how wide the sidewalks in our area were and created a special map of sidewalks . On a narrow sidewalk (width less than 1 meter) it is inconvenient to disperse with oncoming passersby, and if you are walking with a company, it’s inconvenient to communicate and move in single file.
We have identified several categories of pavement width, and showed on which sidewalks which company can comfortably walk. By clicking on the map for each marked sidewalk you can find out the specific width value.
Sidewalk map
In the central areas with historical buildings there are many narrow streets and the pavement can be purely symbolic. We found several places where the sidewalk suddenly narrows to several tens of centimeters, you can find these places on the map. At the time of the study, Bolshaya Ordynka was reconstructed and looked like a construction site, it was difficult and uncomfortable to navigate through it.
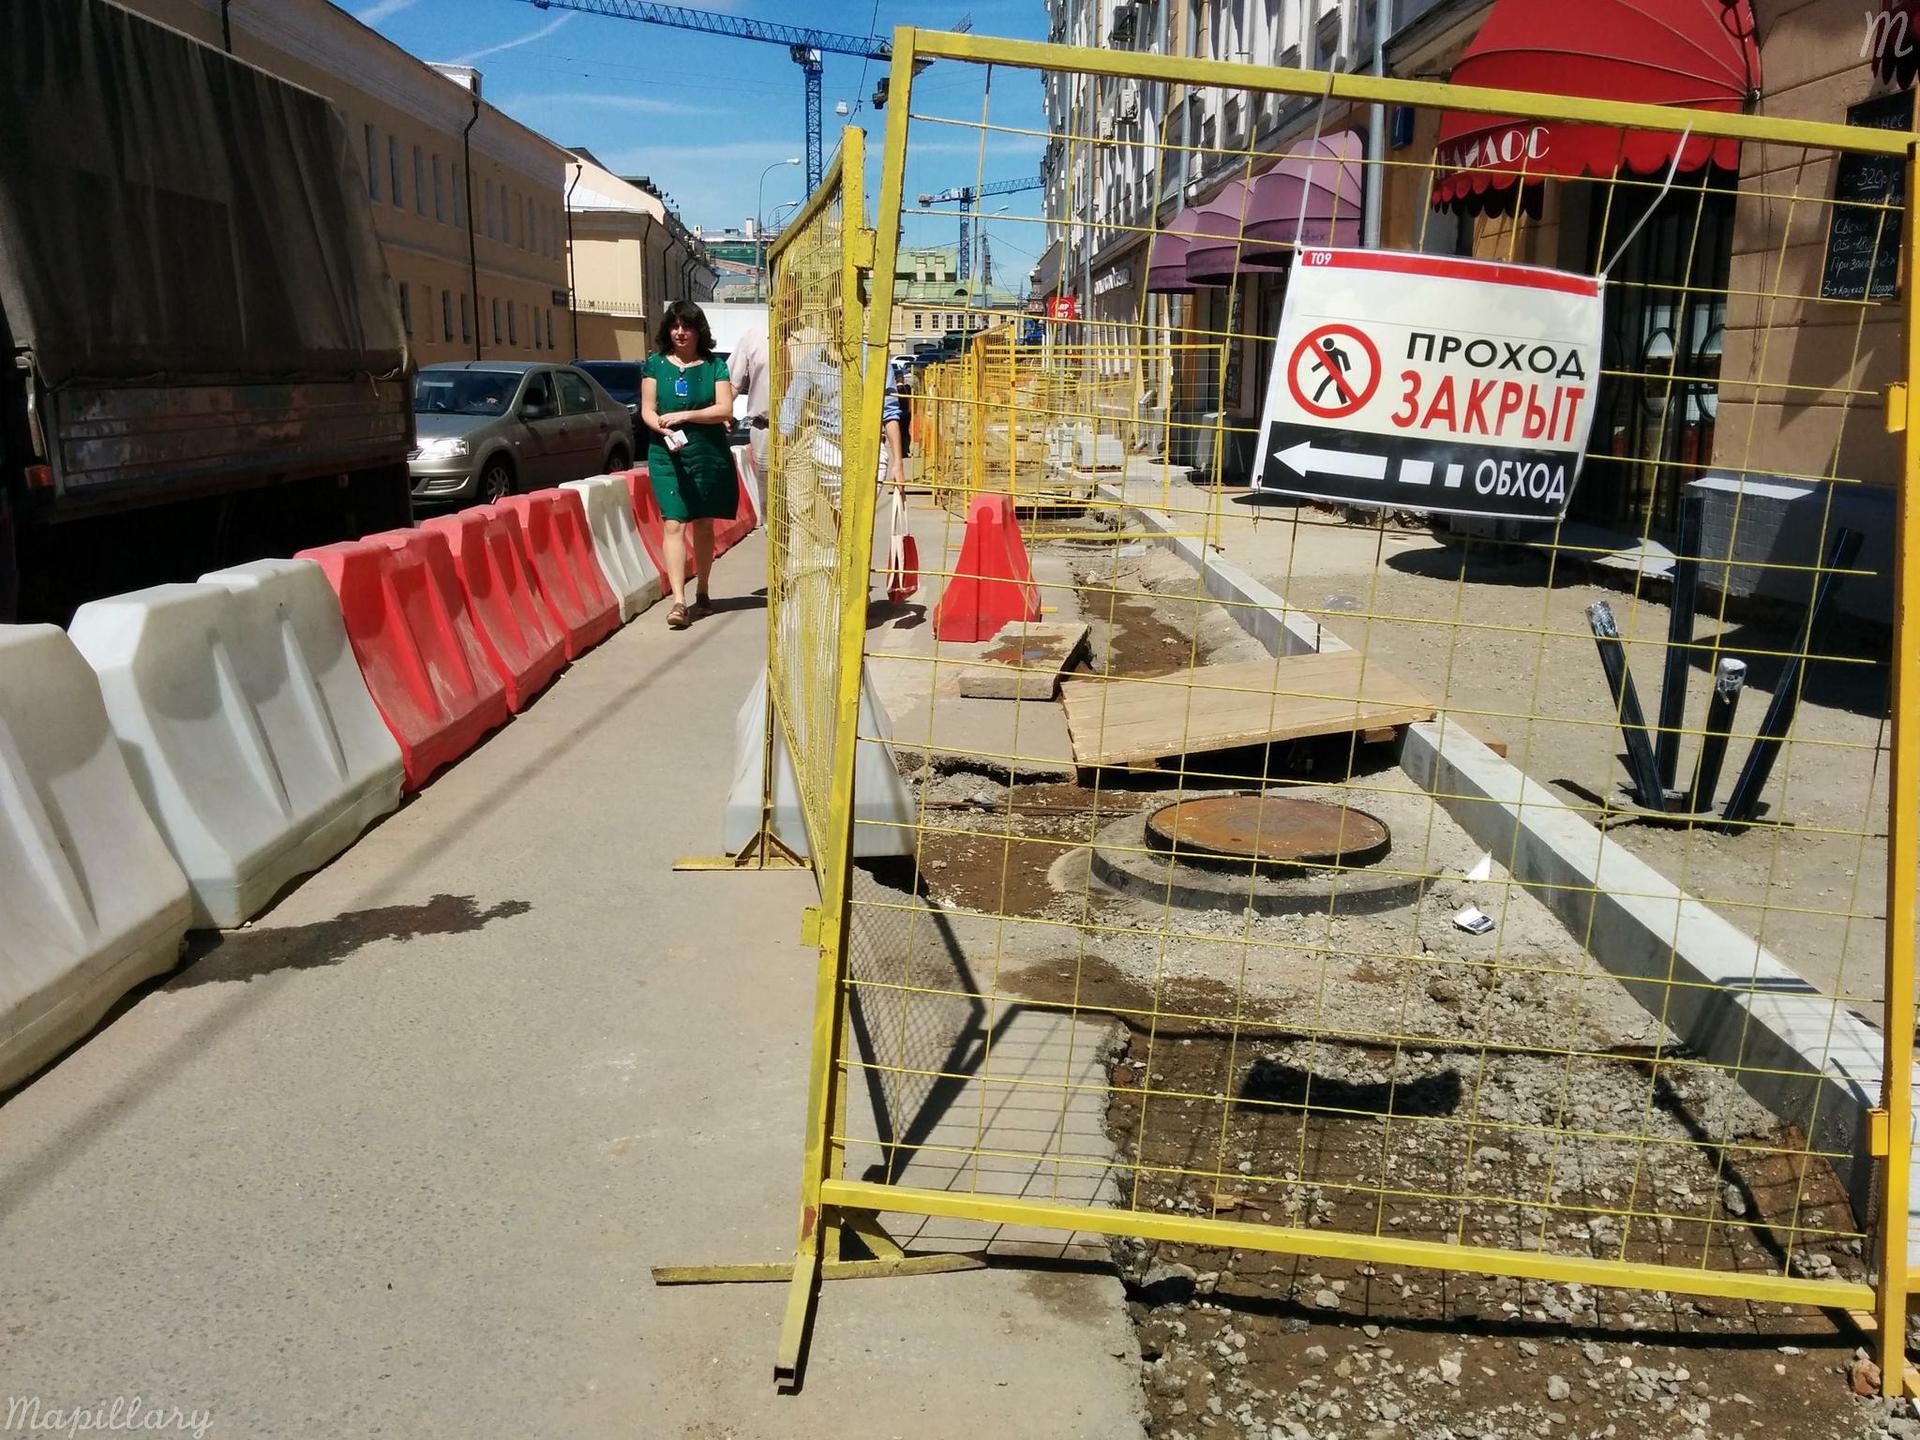
Sidewalk reconstruction on Bolshaya Ordynka, July 2015
During the collection of data on pavements, the route was photographed using the Mapillary application. In the sidewalk cards via the API, we load the nearest photos from there to show the current status.
Now it is known about 92 kilometers of sidewalks and their width. In the studied area, the average width of the sidewalks is 2 meters 18 centimeters. Expectedly wide sidewalks in the selected area were on Bolshaya Yakimanka Street - every 5 meters wider, this is a big street. In the historical streets, the sidewalks are traditionally narrow, on average 1–1.5 m. However, there were several medium-sized streets, where the sidewalk is wide enough and convenient. For example, Novokuznetskaya , Tatarskaya and Bakhrushina , Malaya Ordynka and lanes - Staromonetny, Pyzhevsky , half of the 1st Spasonalivkovsky and Kazan lanes .
Speech about disabled citizens: wheelchair users and young parents with prams. We created a map of accessibility in the area under study.
For people with disabilities, environmental requirements are higher, and if for a mother with a baby carriage, one or two low steps are not a very big obstacle, although it is also unpleasant, for disabled people it is often an insurmountable barrier.
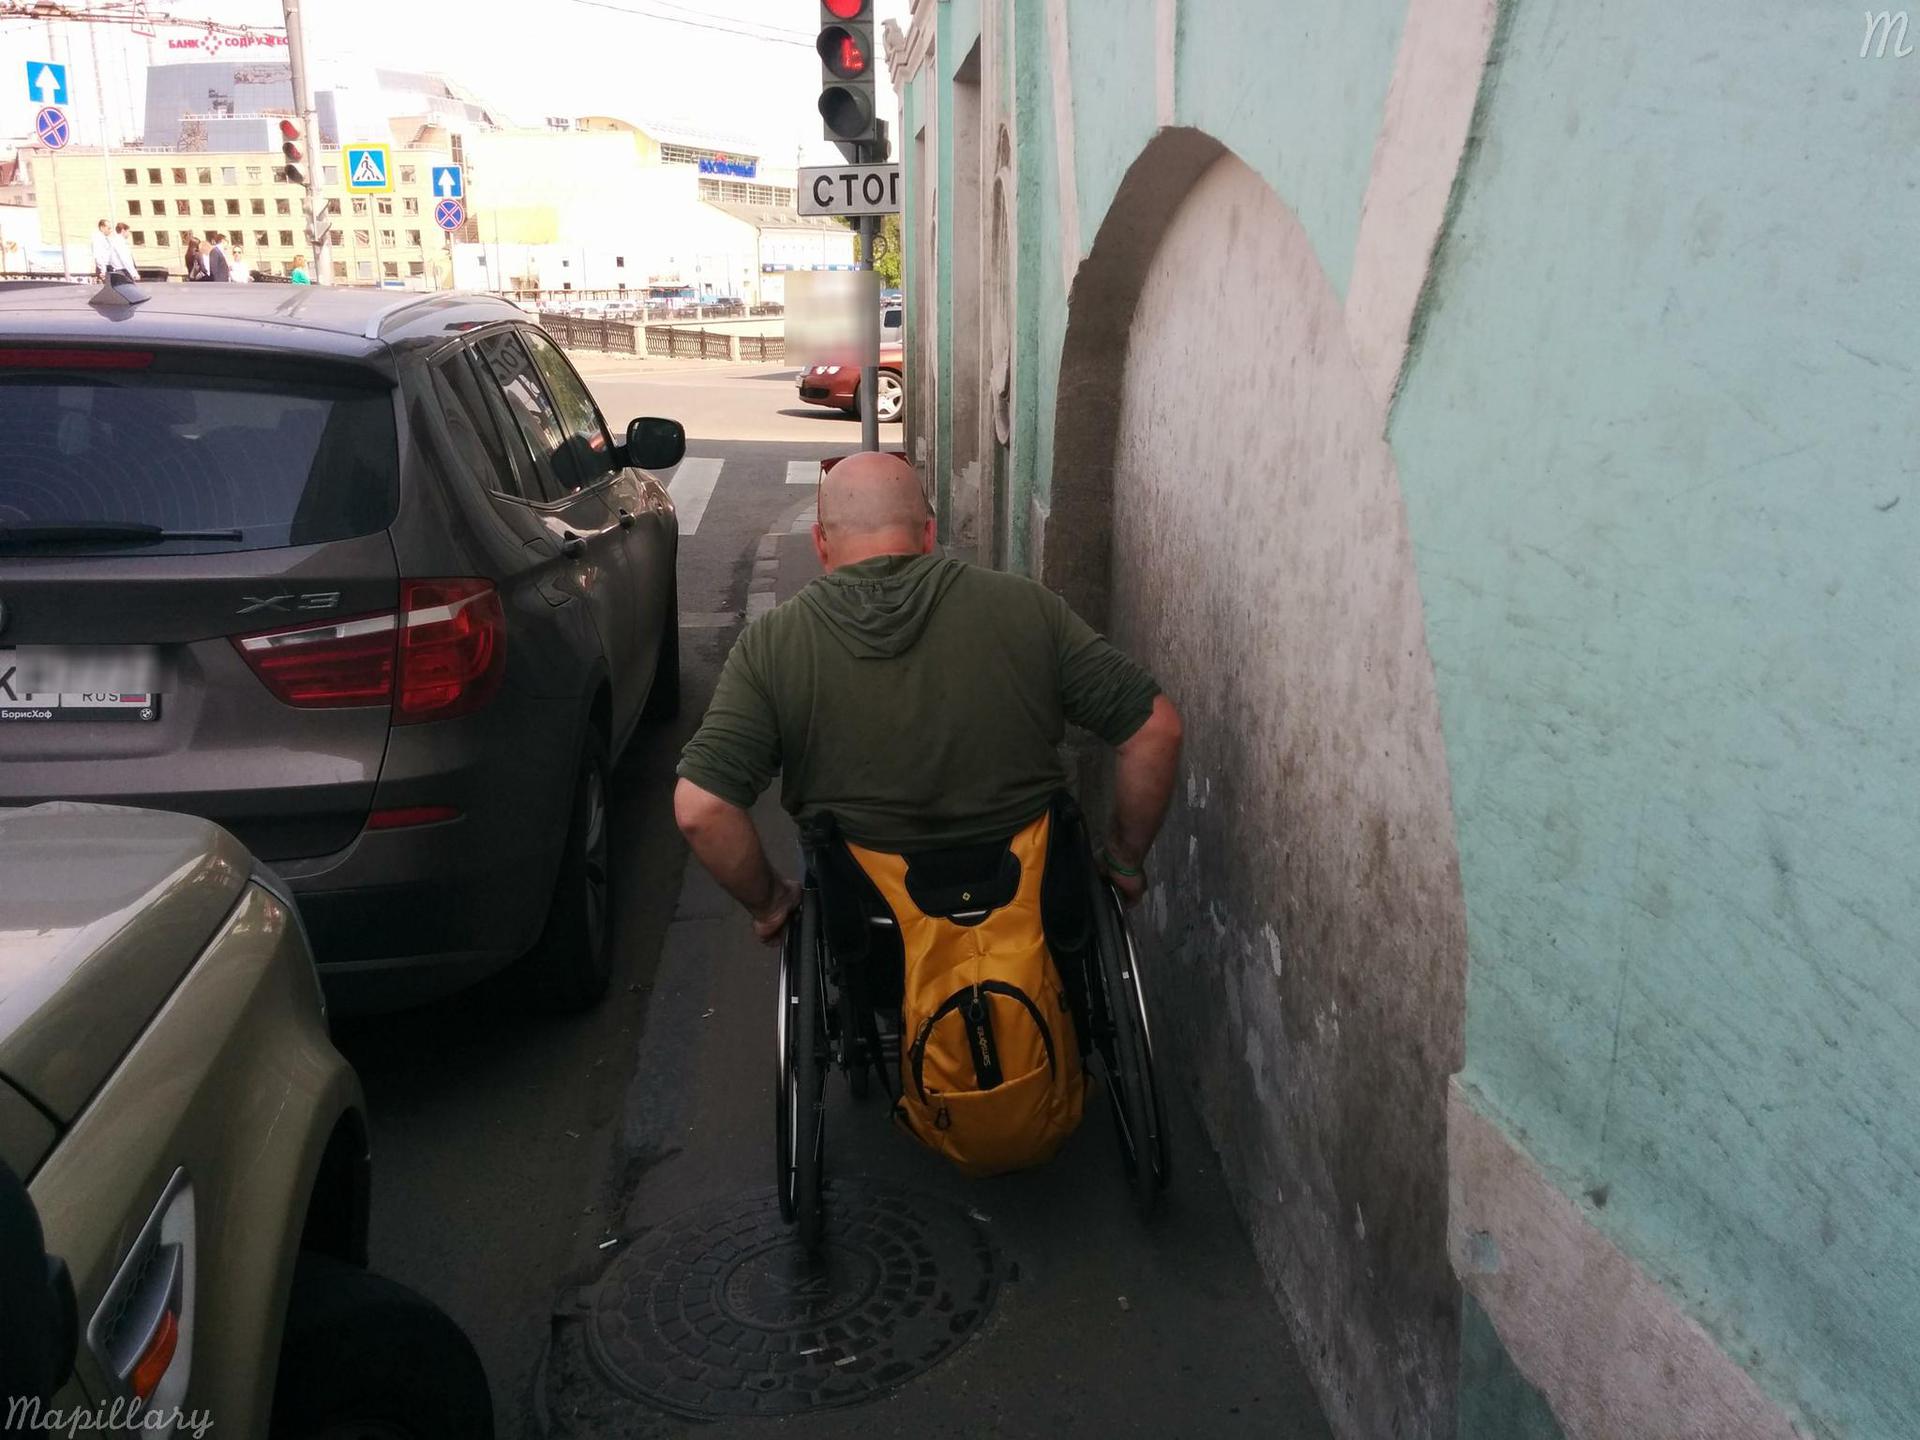
Igor and the narrow sidewalk on Kadashevskaya Embankment
Igor Gakov:
The same applies to moving with a pram. After a couple of walks with a stroller, the perception of the city and the route of movement changes. Worth trying at least once is definitely an interesting experience.
Evaluating the availability of establishments, we began by checking the entrances to establishments and buildings using three categories:
“ Available ” (green) - at the entrance there are either no steps above 7 cm, or the owners of the establishment have taken care to install a convenient ramp. The width of the entrance door is not less than 60 cm.
“ Restrictedly available ” (yellow) - one or two steps at the entrance or a low border: in a wheelchair, most likely, you cannot get into this institution without outside help, and you can easily get into the baby carriage.
“ Inaccessible ” (red) - it’s difficult to get into a school with a pram or in a wheelchair. Institutions and places have fallen into this category, at the entrance to which a steep staircase without a ramp or a high porch awaits you, or you have to climb or descend the stairs to another floor.
In the surveyed area, we checked 203 places and found out that 103 of them are inaccessible (50.7%), 68 are limited accessible (33.5%), and only 32 places are accessible for people with limited mobility (15.8%).
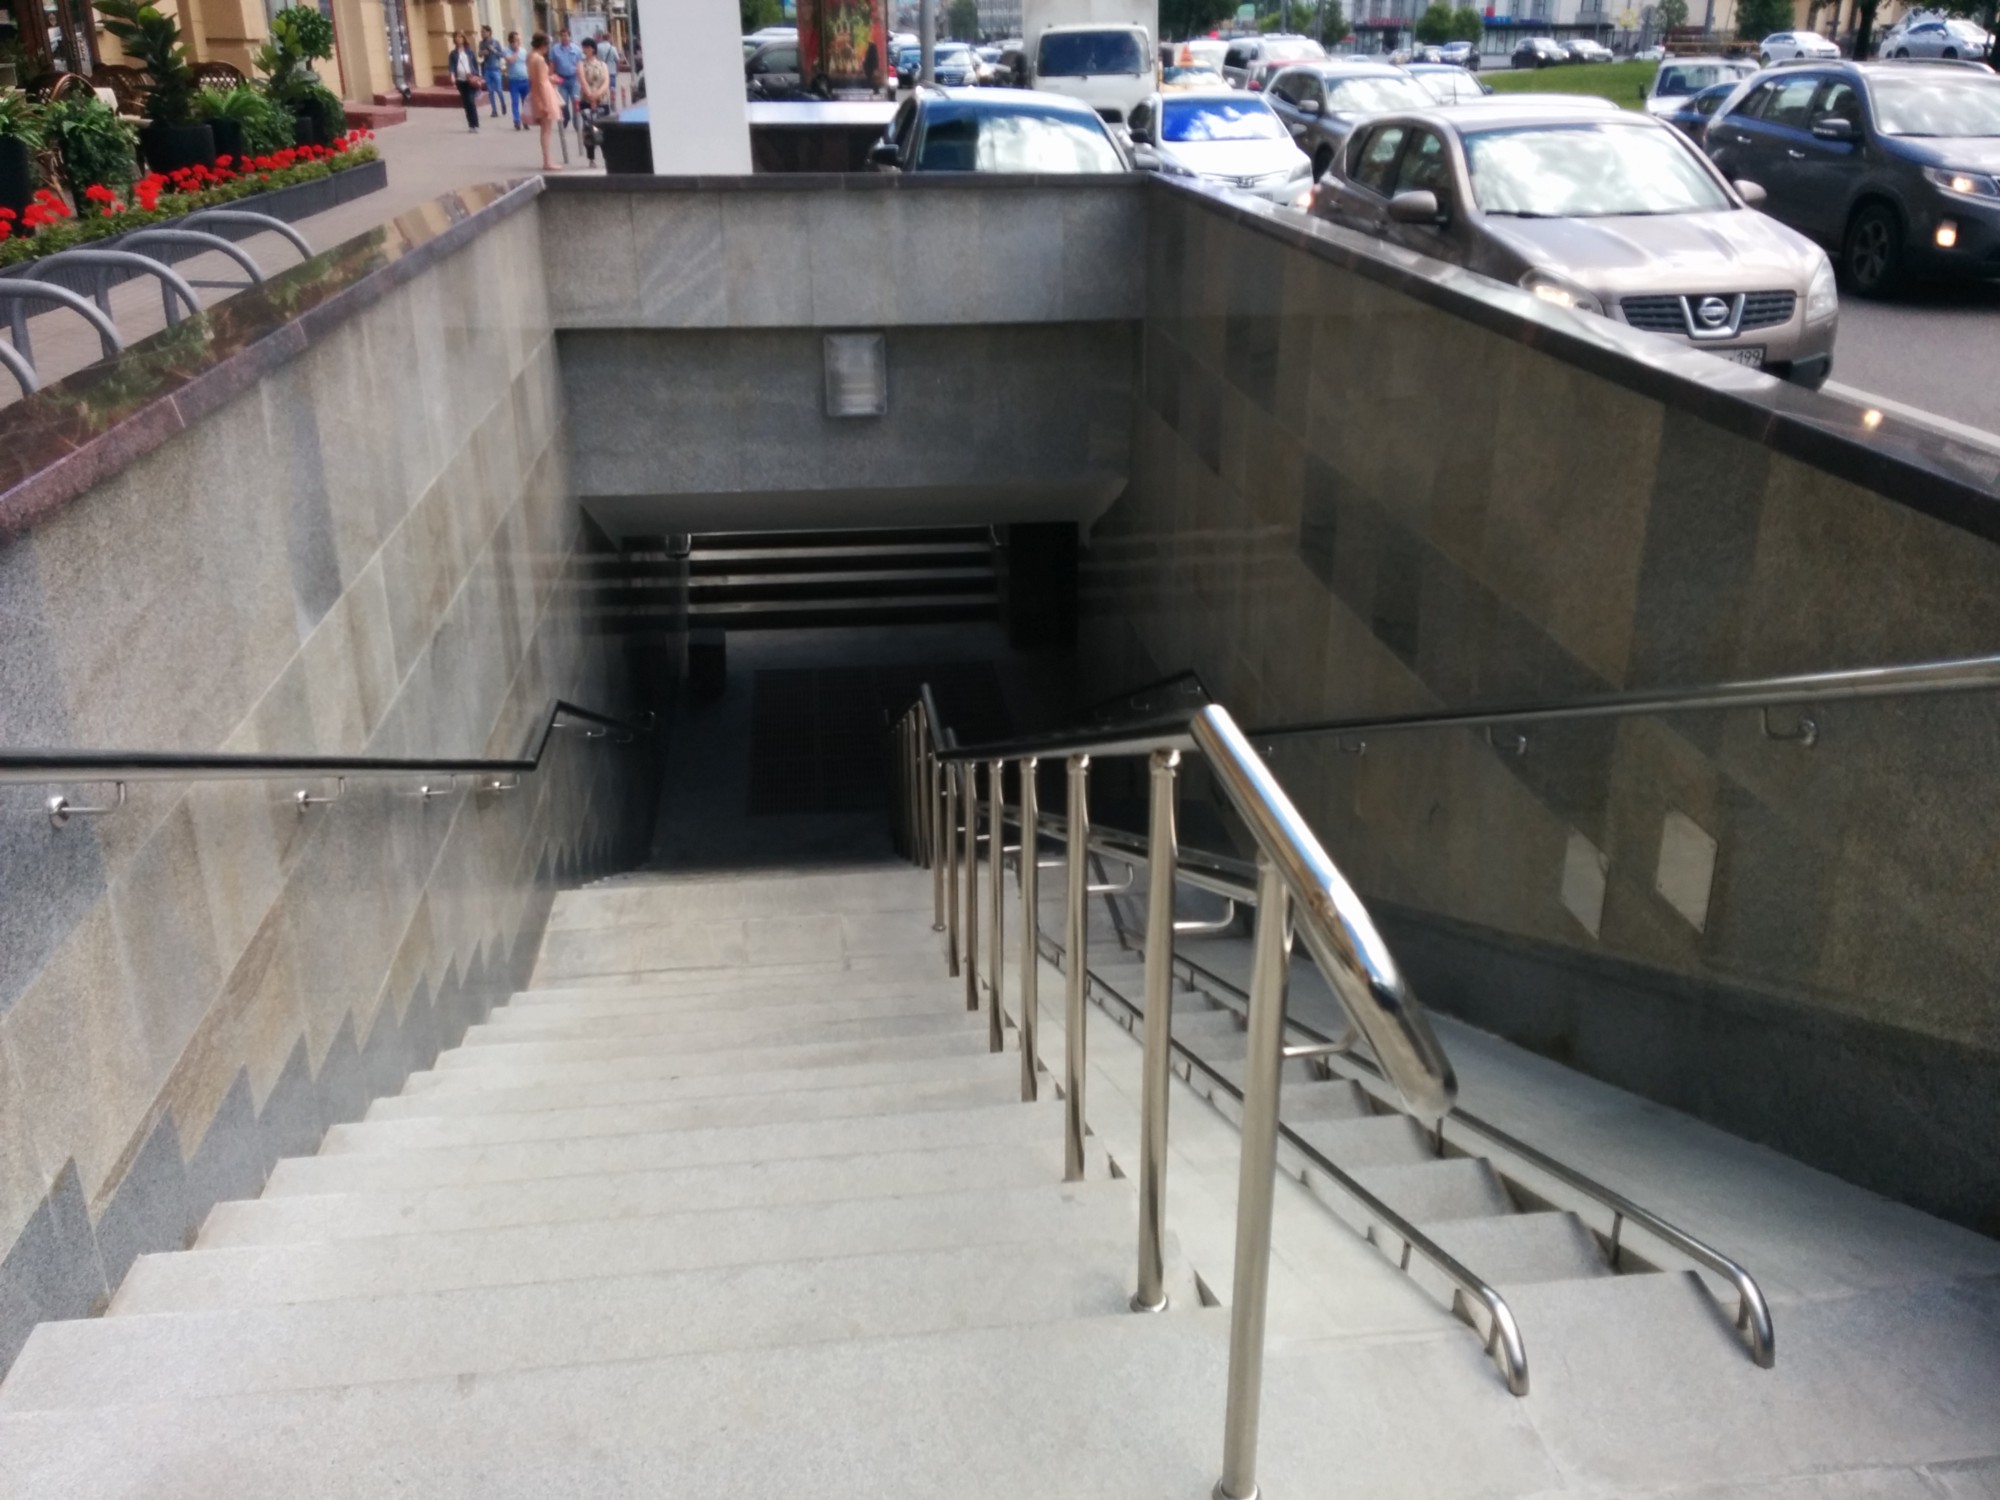
Another serious obstacle is the steps of underground passages and street stairs. There are seven underground passages on the explored site: three on Bolshaya Yakimanka and four large passages on the Garden Ring. Transitions on Yakimanka are equipped with convenient congresses without steps, and people in wheelchairs can use them. And from the crossings on the Garden Ring, it is possible to consider as adapted for disabled people only the passage to Paveletskaya: elsewhere, the steps of the underground passages are not always equipped with convenient ramps.
As for the sidewalks, for the objects we show pictures of the nearest terrain from Mapillary .
At this stage, high curbs and other obstacles on the sidewalks were not taken into account, but this is in the plans. We also plan to learn how to build pedestrian routes, taking into account data on the accessibility of the environment. For example, in St. Petersburg, the guys are already doing a similar service .
As people noted in the survey - the opportunity to walk in a quiet and peaceful place plays an important role for comfortable walking. Sources of street noise are various: construction, traffic, public transport or crowds.
In the practice of research of the urban environment noise mapping is actively used - but this is a rather labor-intensive method: you need to count all the sources of noise and build an accurate model.
At the first stage, we decided to go in a simpler way, and made a series of spot measurements of the noise level while walking around the city. Basically, measurements were taken on weekdays, in the period of 9 am to 19 pm.
Noise level data was collected using InstaDecibel . This application allows you to accompany each measurement with a photo explaining when the measurement was made and what the terrain looks like. We published all measurement results in a special Instagam account .
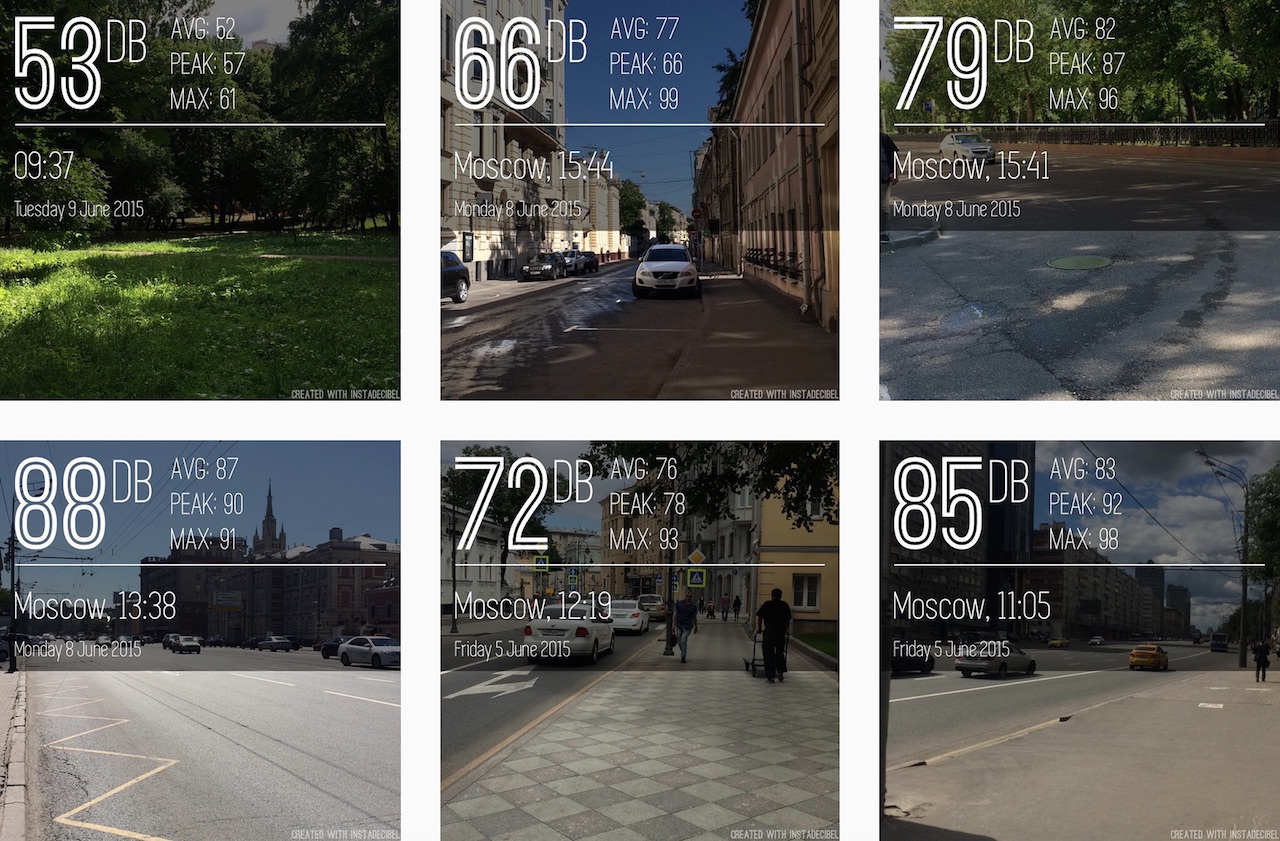
As a result, it turned out such a noise level map :
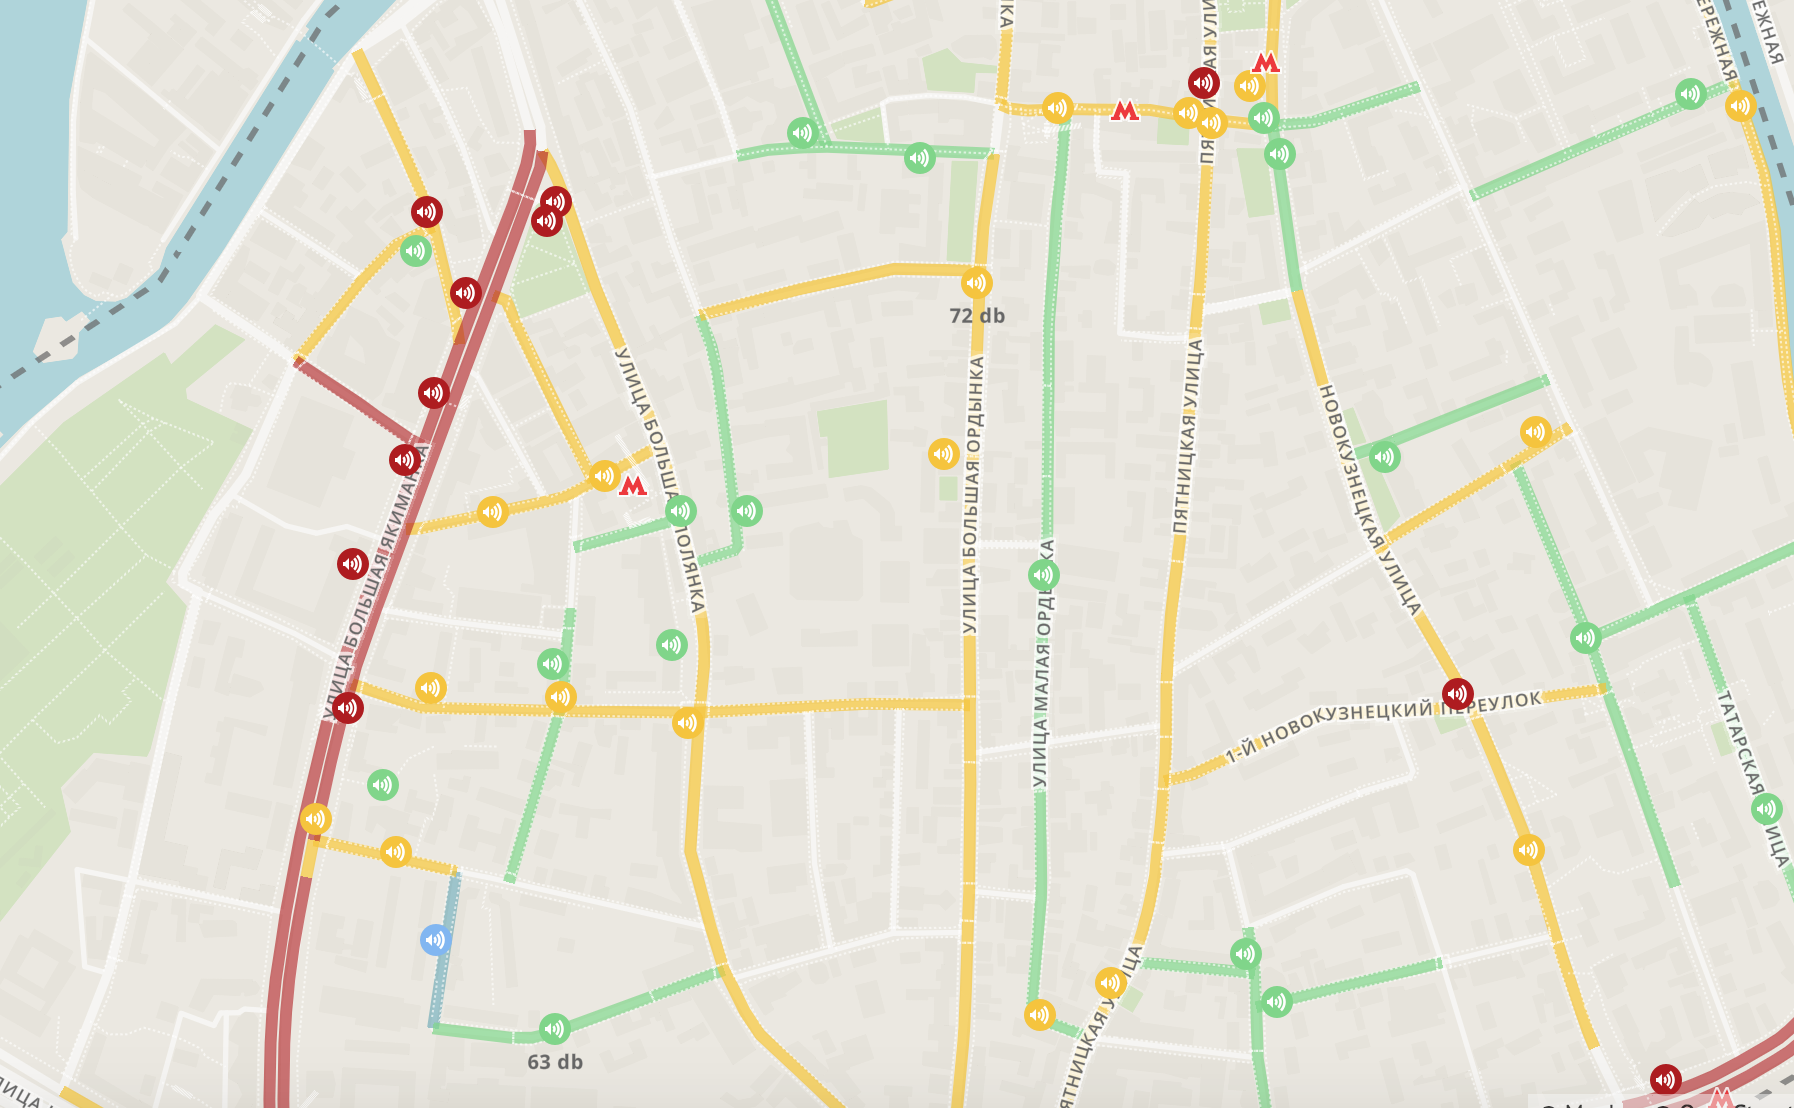
Less than 60 dB (blue) in the center is extremely rare, you need to look for very quiet courtyards, and on small streets, where cars occasionally pass and there is no dense traffic, the level of street noise is 60–70 dB (green): you can comfortably communicate, listen music
The streets are slightly larger, where there are more cars or in pedestrian areas with large crowds of people (for example, near the Tretyakovskaya metro station), the street noise is 70–80 dB. In such conditions, a quiet voice is no longer possible to talk.
On large highways, many cars are stable, so the noise level in active time is above 80 dB. This is uncomfortable conditions for a walk.
We are now thinking about how we can organize noise measurements in the future collectively and experiment with possible options.
There are countless guides with collections of interesting places. Typically, these collections are experts. We decided to experiment and find open data about interesting places and automatically compile a selection for our area.
Phillip Katz reports :
“There are dozens of available POI (points of interest) sources on the modern Internet, starting with the magnificent Foursquare base. However, the sources of current data under an open license, of course, much less. In our case, Wikipedia served as an excellent source.
Using Wikipedia as a source of geodata is very interesting. Only in this way we found that there are articles about places in the city written only in foreign languages; in other words, some things about Moscow Russian-speaking user simply can not read, these data are hidden from us, remaining accessible, for example, to experts in Norwegian (or rather, those who use this segment of Wikipedia for queries about Moscow). It would be interesting to explore how many of these 'hidden' points in different cities of the world and what they actually tell about. However, articles with a large number of translations, language clusters, correlation of spatial and linguistic and temporal coordinates, the history of edits about geolocations - all this carries a large field of opportunities for the development of the project.
Wikipedia, as you know, does not have an API, instead offering to boldly collect data directly from web pages. At the same time, the resource has a massive archive of various metrics and data, including full dumps in several formats. We used JSON format.
It must be said that the data model is rather exotic: each page (item) consists of an unstructured set of 'statements' (statement) and an array of internal references to the same article in other languages; Read more about the model here .
Although it seems to be an option to download everything in one file and it seems simple, it contains its own complexity: ordinary computers are not ready to load a full dump weighing about 20 GB into RAM, and therefore read it. For streaming a file, that is, reading it line-by-line, storing only a few lines in the RAM at any given moment, I used the wonderful ijson module from Ivan Sagalayev.
Further work was not very difficult - for each page on Wikipedia, I check if it has geolocation attributes, and if it has, they are not in the range of interest to me. If it hits, I will keep its Russian name and link, and if there is no such thing, English (if there is no such language either, the first one is kept in the queue). To simplify life, I also set up a simple categorizer of the most common type of pages - streets, monasteries and churches, squares and museums, etc. recognized by acc. words in the title. In the appendage, I mark the articles without the Russian version (about Moscow! There were a few dozen such) and I consider in a separate column the number of languages for the translation of the article. Processing the entire database took overnight - by morning a small csv with 7 thousand POIs.
X axis - the number of article views per month; Y is the number of languages of the article (June, 2015).
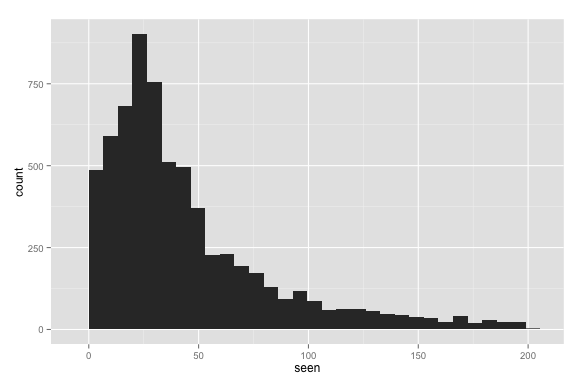
The last stage is the ranking. In order to simplify the work of the server, using simple R commands, we build a histogram of site statistics, and see if it is possible to find a visible reason for categorization. This is not difficult - the histogram clearly shows the levels of the 'universal' articles (for example, the article 'Russia' indicating the latitude and longitude of the capital), with statistics of more than 75,000 page views per month. With a large margin comes the second group of elements - a little less universal (for example, 'Moscow'), with more than 2,000 views, and then, at the very beginning, from zero to 500 views receive the bulk. Based on the histogram, they were divided into three groups: up to 100, up to 500 and more. In total, there were 5 point value rankings. Data is ready to use.
Histogram of statistics of viewing articles with coordinates in Moscow
In the study area, there is not the largest category, and therefore there are only four categories of popularity - the marks on the map of four sizes. A little later, we visualize this data for the whole city. ”
Since Wikipedia articles with coordinates are most often about popular places, the most successful illustration of each object was photos from Panoramio.
For those who read this line: Surprise! The project does not have its own backend. We use cloud storage on Mapbox, and the whole project is a static page using several APIs.
I'll tell you more about how it all works.
The biggest work in the project is data preparation and preprocessing. I collected the environment for this on a local computer, somewhere the data was uploaded to Postgres, and somewhere I just used the GeoJSON format.
For example, the pavement width [width] is the standard road tag in OpenStreetMap, so you can use any dataset Planet.osm . For example, the availability of seats uses the [wheelchair] tag, which is not in Planet.osm, so I used Overpass-turbo to upload data from OSM.
An indispensable tool for viewing and working with any geodata formats - Quantum GIS , I already told about it in screencasts about the visualization of geodata.
For processing Wikipedia data, Philip developed a special toolkit - WikiGeoParser
The prepared data is imported into Mapbox . To do this, use the Mapbox Design Studio:
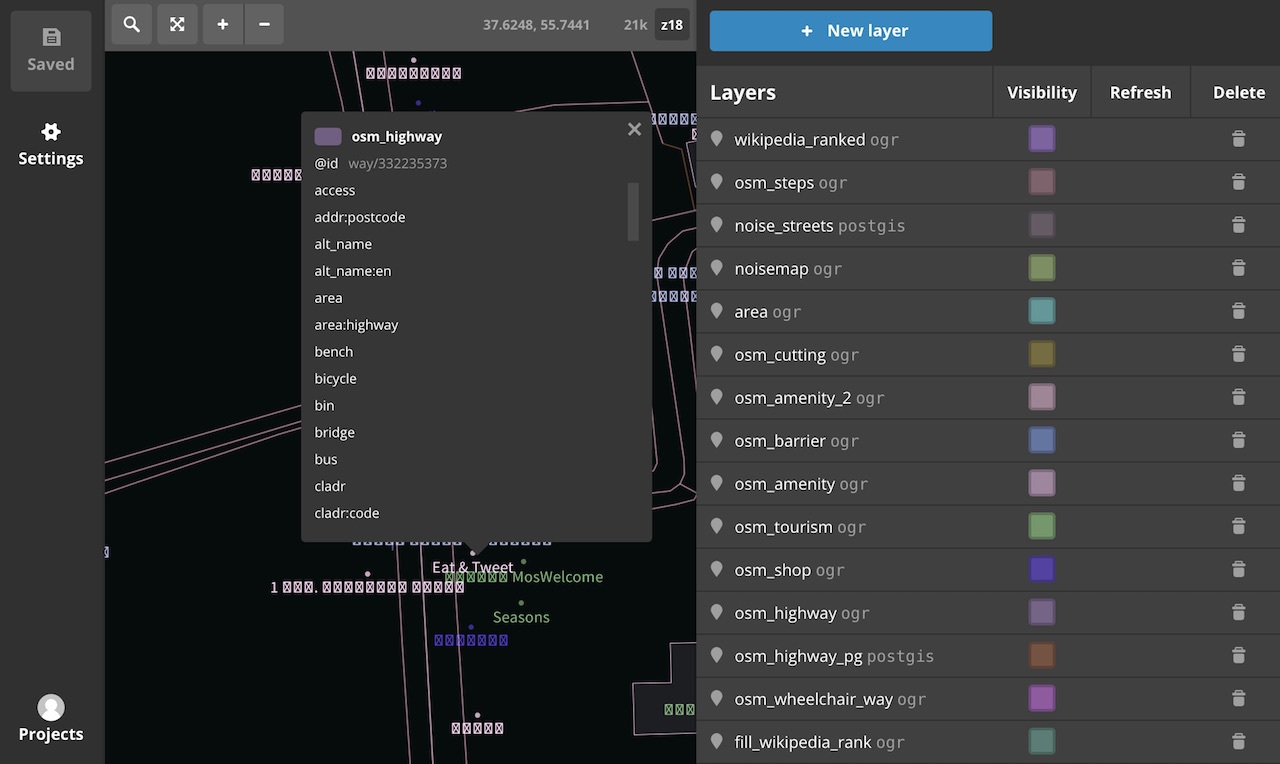
Work with data in Design Studio
The Mapbox GL API for Java Script is used to display the imported data. A map mode switch uses class switching for a map style, as in this example .
Out of habit, to manage the DOM on the page, I used the familiar D3.js (I am not a front-endander, so I can be strange).
Of the UX-chips, characteristic map projects worth noting is the memorization of the current state of the map (I use location.hash). So that you can always copy the URL from the address bar and share the desired part of the map with the currently selected mode.
Actually, this and all that is. A simple JavaScript application in the browser.
Not very slim non-development project code published on GitHub :)
The Walking Streets project is just beginning, and the current version is not the end user service, but only an early prototype, an interactive story about the current conditions of movement in a small area. We continue to experiment.
In the near future: expand the research area to the center of Moscow, and begin to develop a pedestrian routing service that takes into account the studied characteristics of the city.
Now we need help on two fronts:
Data collection and correction :
In OpenStreetMap, the data we need is small, but there are all the tools and capabilities to tag them.
You can help the project with the layout of data on the sidewalks and the accessibility of the environment: to do this, just walk around the city a little to enter data in the OpenStreetMap project. To make it easier to deal with this, we have prepared a detailed instruction on data collection , and to coordinate the efforts to collect data, we started a special group on Facebook .
Even if you are not in the center of Moscow and are ready to help with other districts and cities - help! We hope that we will be able to expand the territory of the project in the future. This data will be useful not only for us, but for all OSM projects that will use it. Including you yourself can do something interesting with the collected data.
According to the first reviews after the launch of the prototype, we found that many people want to help with collecting data about the noise level on the street. In the near future we will come up with a decision on how to collectively collect these measurements.
If you do not really want to deal with edits in OpenStreetMap, it will be useful if you just photograph pavements using Mapillary - this will help OSM community members to map the map more precisely.
Backend / Infrastructure :
There are two hot tasks that you want to do in the near future:
- Now the data update is arranged primitively and occurs in manual mode, I reload files and update the local database. Need to automate
- To make the service more useful than just a map with layers of data, we dream of launching pedestrian routing taking into account the collected parameters of the urban environment.
We are looking for a backend. If you are such a developer (C ++, Python, Node.js, Postgres) who wants to join the project team - please write me karmatsky (at) gmail.com and discuss the terms of cooperation.
The plans - a bunch of different experiments with open geodata in large volumes and the connection of new layers.
It would be great to get any feedback about the project and discuss project ideas in comments.
Comfortable walk to you!
Project team: Andrei Karmatsky , Philip Katz , Igor Gakov . Thanks for the advice of Ilya Zverev and Timofey Samsonov .
Development and design: Urbica is a design studio specializing in interactive projects about the urban environment.
I still like cards and I love them and talk about them , and sometimes I do something like that sometimes with cards. And now the story will also be about the map service.
What makes the city fit for comfortable walking and what makes walking around the city comfortable and enjoyable? To find the answers, I asked a group of people to describe their experience of walking and tell what is important for them when they are not in a hurry, and would like to take a walk around the city.
')
It turned out that the following parameters are important to them:
- the presence of trees, greenery on the street;
- the presence on the way of institutions where you could eat or drink a cup of coffee;
- Smaller people and cars, quiet streets;
- the opportunity to see something interesting or learn something new along the way;
- wide and flat pavement.
Reflecting further, we (I and a group of caring acquaintances to whom I told ideas) came to the conclusion that it is possible to help pedestrians from both sides at the same time: to improve urban space, make the environment more convenient, or create services for pedestrians to help make their walk more comfortable. However, it usually begins with an analysis and clarification of the current situation. So the idea came to make a tool for interactive study of the urban environment at the first stage.
The very first prototype of the service was:
The first version of the prototype used fictional data about several environmental parameters. The main idea: a convenient interface for studying the terrain and selecting a place for those parameters that are relevant for each person personally.
A few words about how I made this prototype:
- I took the OpenStreetMap data from the GIS-Lab website
- I imported them to the Postgres local database using osm2pgsql
- I added fields with parameters to the tables of interest to me and got the “fish” data
- I took TileMill from MapBox , styled the map and visualized the parameters of the streets, imported tiles into the Mapbox account
- Sketched a static page with a map of Mapbox.js
- For photos of places I used Panoramio API, and popular places
Having tested the first prototype on friends, it was decided to refine this concept and use the real data as the next step. It also became clear that in the first stages, it is worthwhile to abandon the weakly measured parameters, since people perceive some properties of the street in different ways: it seems comfortable to someone, but not to others. In the future, such indices will be added, but they will already be based on user ratings within a sufficient number of user ratings for this.
I really wanted the data for the project to be open and accessible, so that anyone could add important information for him, experiment with the data and explore it himself.
Where to get the real data? There are no such open data that people need for Moscow, and therefore we will collect them on our own, and in order not to only collect data and still have time to do something interesting, we have limited the study area to two parts of districts Yakimanka and Zamoskvorechye within the Garden Ring.
Urban Explorer RecruitmentOpenStreetMap turned out to be the most suitable base for the project, in addition to the set of available tools and technologies, each pedestrian in the city has the opportunity to mark or clarify the data under study, the OSM map is created and edited by users.
As a result, after a series of field studies and experiments, we collected some parameters about the city streets and we had a small interactive project with real data, which we called “ Walking Streets ”
The project tells 4 stories about the city in the area we studied: the width of the sidewalks, the accessibility of the environment (entrances to buildings, stairs), noise on the street and interesting places.
Now this is not a complete user service that could solve all the problems of comfortable moving around the city, rather, it is a slightly more elaborated version of the prototype, which we publish in order to collect feedback, find out which points should be worked out in more detail or completely redone it.
About each data slice we will tell more:
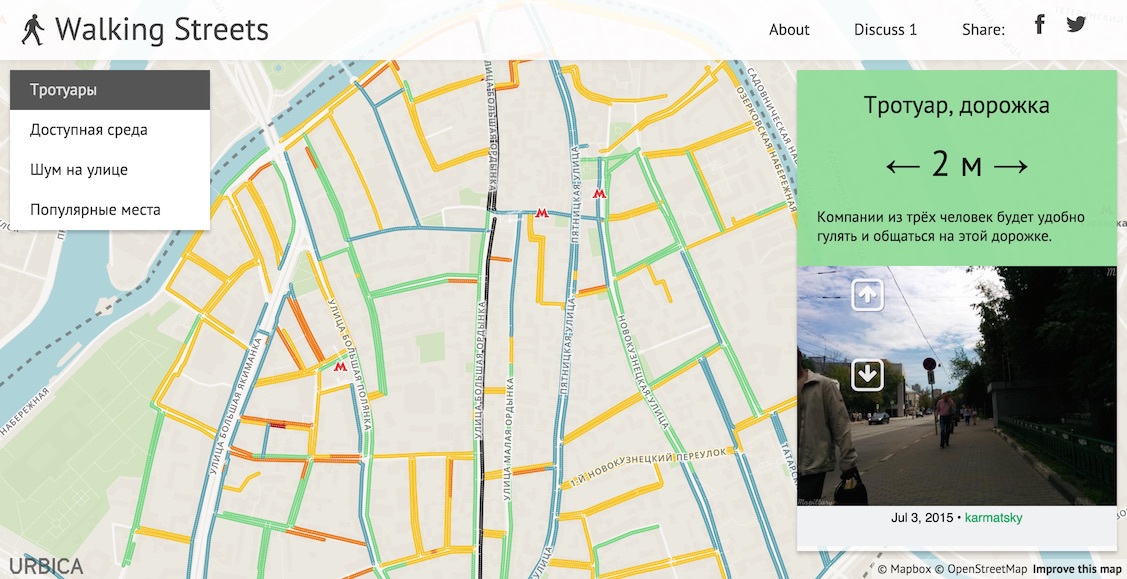
Sidewalks
Almost all the services we are used to using mean that the street marked on the map is suitable for walking. In reality, this is not the case. The pavement is not always on both sides, sometimes it ends suddenly, sometimes it can be very narrow and inconvenient.
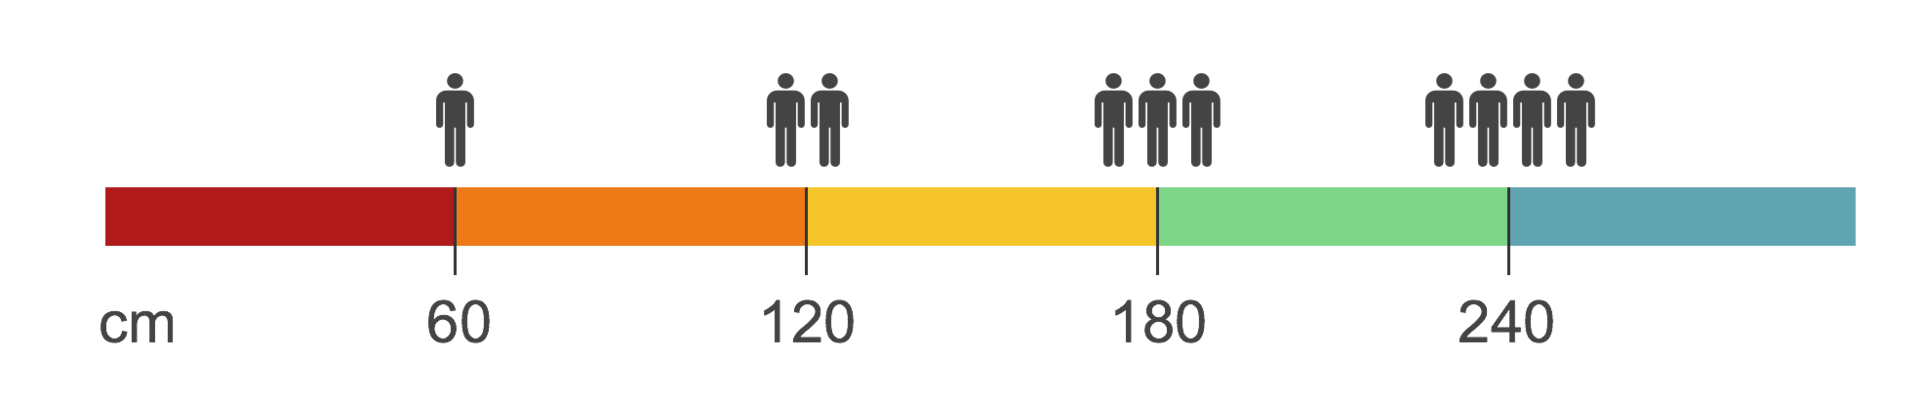
We decided to tell the story of how wide the sidewalks in our area were and created a special map of sidewalks . On a narrow sidewalk (width less than 1 meter) it is inconvenient to disperse with oncoming passersby, and if you are walking with a company, it’s inconvenient to communicate and move in single file.
We have identified several categories of pavement width, and showed on which sidewalks which company can comfortably walk. By clicking on the map for each marked sidewalk you can find out the specific width value.
Sidewalk map
In the central areas with historical buildings there are many narrow streets and the pavement can be purely symbolic. We found several places where the sidewalk suddenly narrows to several tens of centimeters, you can find these places on the map. At the time of the study, Bolshaya Ordynka was reconstructed and looked like a construction site, it was difficult and uncomfortable to navigate through it.
Sidewalk reconstruction on Bolshaya Ordynka, July 2015
During the collection of data on pavements, the route was photographed using the Mapillary application. In the sidewalk cards via the API, we load the nearest photos from there to show the current status.
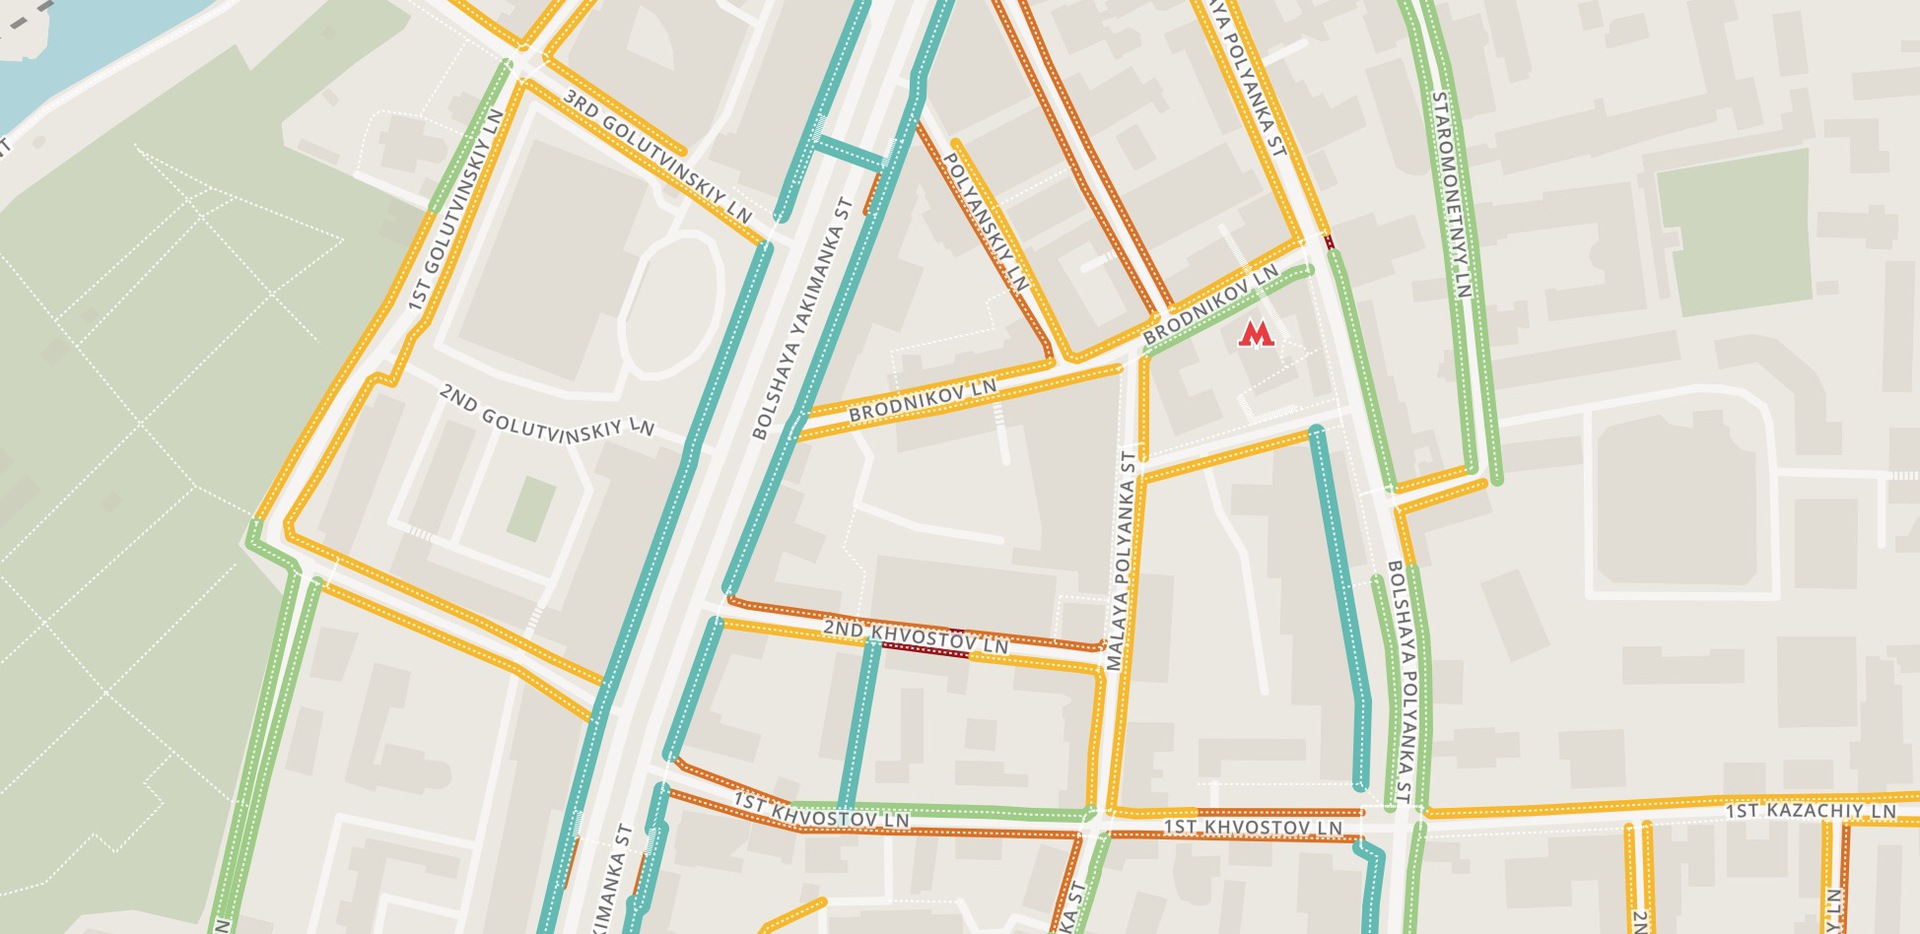
Now it is known about 92 kilometers of sidewalks and their width. In the studied area, the average width of the sidewalks is 2 meters 18 centimeters. Expectedly wide sidewalks in the selected area were on Bolshaya Yakimanka Street - every 5 meters wider, this is a big street. In the historical streets, the sidewalks are traditionally narrow, on average 1–1.5 m. However, there were several medium-sized streets, where the sidewalk is wide enough and convenient. For example, Novokuznetskaya , Tatarskaya and Bakhrushina , Malaya Ordynka and lanes - Staromonetny, Pyzhevsky , half of the 1st Spasonalivkovsky and Kazan lanes .
Environment availability
Speech about disabled citizens: wheelchair users and young parents with prams. We created a map of accessibility in the area under study.
For people with disabilities, environmental requirements are higher, and if for a mother with a baby carriage, one or two low steps are not a very big obstacle, although it is also unpleasant, for disabled people it is often an insurmountable barrier.
Igor and the narrow sidewalk on Kadashevskaya Embankment
Igor Gakov:
“In any city in the world there are a lot of people who can be called mobile. These are parents with small children in wheelchairs (often up to 5 years during long walks), elderly people and people with disabilities using all sorts of devices for getting around the city (strollers, scooters, supports, etc.).
The main criterion for a pleasant walk for them is a well-organized urban infrastructure: the lack of steps and the presence of various ramps at the entrance to any institution, properly constructed pedestrian crossings and exits from sidewalks. ”
The same applies to moving with a pram. After a couple of walks with a stroller, the perception of the city and the route of movement changes. Worth trying at least once is definitely an interesting experience.
Evaluating the availability of establishments, we began by checking the entrances to establishments and buildings using three categories:
“ Available ” (green) - at the entrance there are either no steps above 7 cm, or the owners of the establishment have taken care to install a convenient ramp. The width of the entrance door is not less than 60 cm.
“ Restrictedly available ” (yellow) - one or two steps at the entrance or a low border: in a wheelchair, most likely, you cannot get into this institution without outside help, and you can easily get into the baby carriage.
“ Inaccessible ” (red) - it’s difficult to get into a school with a pram or in a wheelchair. Institutions and places have fallen into this category, at the entrance to which a steep staircase without a ramp or a high porch awaits you, or you have to climb or descend the stairs to another floor.
In the surveyed area, we checked 203 places and found out that 103 of them are inaccessible (50.7%), 68 are limited accessible (33.5%), and only 32 places are accessible for people with limited mobility (15.8%).
Another serious obstacle is the steps of underground passages and street stairs. There are seven underground passages on the explored site: three on Bolshaya Yakimanka and four large passages on the Garden Ring. Transitions on Yakimanka are equipped with convenient congresses without steps, and people in wheelchairs can use them. And from the crossings on the Garden Ring, it is possible to consider as adapted for disabled people only the passage to Paveletskaya: elsewhere, the steps of the underground passages are not always equipped with convenient ramps.
As for the sidewalks, for the objects we show pictures of the nearest terrain from Mapillary .
At this stage, high curbs and other obstacles on the sidewalks were not taken into account, but this is in the plans. We also plan to learn how to build pedestrian routes, taking into account data on the accessibility of the environment. For example, in St. Petersburg, the guys are already doing a similar service .
Noise in the street
As people noted in the survey - the opportunity to walk in a quiet and peaceful place plays an important role for comfortable walking. Sources of street noise are various: construction, traffic, public transport or crowds.
In the practice of research of the urban environment noise mapping is actively used - but this is a rather labor-intensive method: you need to count all the sources of noise and build an accurate model.
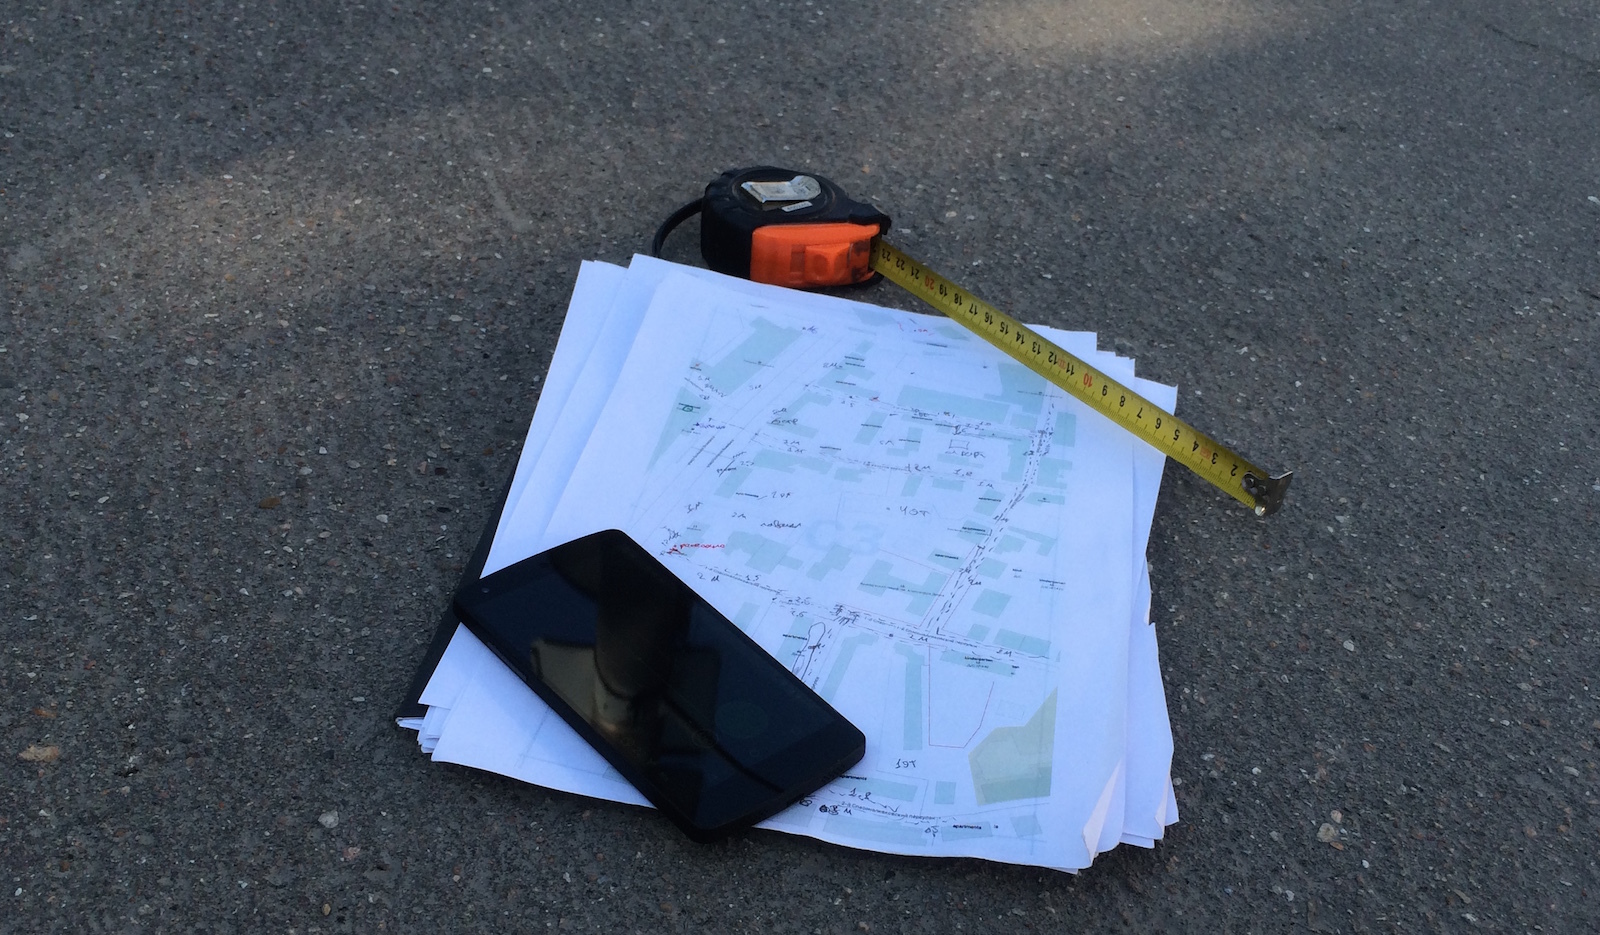
At the first stage, we decided to go in a simpler way, and made a series of spot measurements of the noise level while walking around the city. Basically, measurements were taken on weekdays, in the period of 9 am to 19 pm.
Noise level data was collected using InstaDecibel . This application allows you to accompany each measurement with a photo explaining when the measurement was made and what the terrain looks like. We published all measurement results in a special Instagam account .
As a result, it turned out such a noise level map :
Less than 60 dB (blue) in the center is extremely rare, you need to look for very quiet courtyards, and on small streets, where cars occasionally pass and there is no dense traffic, the level of street noise is 60–70 dB (green): you can comfortably communicate, listen music
The streets are slightly larger, where there are more cars or in pedestrian areas with large crowds of people (for example, near the Tretyakovskaya metro station), the street noise is 70–80 dB. In such conditions, a quiet voice is no longer possible to talk.
On large highways, many cars are stable, so the noise level in active time is above 80 dB. This is uncomfortable conditions for a walk.
We are now thinking about how we can organize noise measurements in the future collectively and experiment with possible options.
Interesting places
There are countless guides with collections of interesting places. Typically, these collections are experts. We decided to experiment and find open data about interesting places and automatically compile a selection for our area.
Phillip Katz reports :
“There are dozens of available POI (points of interest) sources on the modern Internet, starting with the magnificent Foursquare base. However, the sources of current data under an open license, of course, much less. In our case, Wikipedia served as an excellent source.
Using Wikipedia as a source of geodata is very interesting. Only in this way we found that there are articles about places in the city written only in foreign languages; in other words, some things about Moscow Russian-speaking user simply can not read, these data are hidden from us, remaining accessible, for example, to experts in Norwegian (or rather, those who use this segment of Wikipedia for queries about Moscow). It would be interesting to explore how many of these 'hidden' points in different cities of the world and what they actually tell about. However, articles with a large number of translations, language clusters, correlation of spatial and linguistic and temporal coordinates, the history of edits about geolocations - all this carries a large field of opportunities for the development of the project.
Wikipedia, as you know, does not have an API, instead offering to boldly collect data directly from web pages. At the same time, the resource has a massive archive of various metrics and data, including full dumps in several formats. We used JSON format.
It must be said that the data model is rather exotic: each page (item) consists of an unstructured set of 'statements' (statement) and an array of internal references to the same article in other languages; Read more about the model here .
Although it seems to be an option to download everything in one file and it seems simple, it contains its own complexity: ordinary computers are not ready to load a full dump weighing about 20 GB into RAM, and therefore read it. For streaming a file, that is, reading it line-by-line, storing only a few lines in the RAM at any given moment, I used the wonderful ijson module from Ivan Sagalayev.
Further work was not very difficult - for each page on Wikipedia, I check if it has geolocation attributes, and if it has, they are not in the range of interest to me. If it hits, I will keep its Russian name and link, and if there is no such thing, English (if there is no such language either, the first one is kept in the queue). To simplify life, I also set up a simple categorizer of the most common type of pages - streets, monasteries and churches, squares and museums, etc. recognized by acc. words in the title. In the appendage, I mark the articles without the Russian version (about Moscow! There were a few dozen such) and I consider in a separate column the number of languages for the translation of the article. Processing the entire database took overnight - by morning a small csv with 7 thousand POIs.
X axis - the number of article views per month; Y is the number of languages of the article (June, 2015).
The last stage is the ranking. In order to simplify the work of the server, using simple R commands, we build a histogram of site statistics, and see if it is possible to find a visible reason for categorization. This is not difficult - the histogram clearly shows the levels of the 'universal' articles (for example, the article 'Russia' indicating the latitude and longitude of the capital), with statistics of more than 75,000 page views per month. With a large margin comes the second group of elements - a little less universal (for example, 'Moscow'), with more than 2,000 views, and then, at the very beginning, from zero to 500 views receive the bulk. Based on the histogram, they were divided into three groups: up to 100, up to 500 and more. In total, there were 5 point value rankings. Data is ready to use.
Histogram of statistics of viewing articles with coordinates in Moscow
In the study area, there is not the largest category, and therefore there are only four categories of popularity - the marks on the map of four sizes. A little later, we visualize this data for the whole city. ”
Since Wikipedia articles with coordinates are most often about popular places, the most successful illustration of each object was photos from Panoramio.
Project without backend
For those who read this line: Surprise! The project does not have its own backend. We use cloud storage on Mapbox, and the whole project is a static page using several APIs.
I'll tell you more about how it all works.
The biggest work in the project is data preparation and preprocessing. I collected the environment for this on a local computer, somewhere the data was uploaded to Postgres, and somewhere I just used the GeoJSON format.
For example, the pavement width [width] is the standard road tag in OpenStreetMap, so you can use any dataset Planet.osm . For example, the availability of seats uses the [wheelchair] tag, which is not in Planet.osm, so I used Overpass-turbo to upload data from OSM.
An indispensable tool for viewing and working with any geodata formats - Quantum GIS , I already told about it in screencasts about the visualization of geodata.
For processing Wikipedia data, Philip developed a special toolkit - WikiGeoParser
The prepared data is imported into Mapbox . To do this, use the Mapbox Design Studio:
Work with data in Design Studio
The Mapbox GL API for Java Script is used to display the imported data. A map mode switch uses class switching for a map style, as in this example .
Out of habit, to manage the DOM on the page, I used the familiar D3.js (I am not a front-endander, so I can be strange).
Of the UX-chips, characteristic map projects worth noting is the memorization of the current state of the map (I use location.hash). So that you can always copy the URL from the address bar and share the desired part of the map with the currently selected mode.
Actually, this and all that is. A simple JavaScript application in the browser.
Not very slim non-development project code published on GitHub :)
We need help
The Walking Streets project is just beginning, and the current version is not the end user service, but only an early prototype, an interactive story about the current conditions of movement in a small area. We continue to experiment.
In the near future: expand the research area to the center of Moscow, and begin to develop a pedestrian routing service that takes into account the studied characteristics of the city.
Now we need help on two fronts:
Data collection and correction :
In OpenStreetMap, the data we need is small, but there are all the tools and capabilities to tag them.
You can help the project with the layout of data on the sidewalks and the accessibility of the environment: to do this, just walk around the city a little to enter data in the OpenStreetMap project. To make it easier to deal with this, we have prepared a detailed instruction on data collection , and to coordinate the efforts to collect data, we started a special group on Facebook .
Even if you are not in the center of Moscow and are ready to help with other districts and cities - help! We hope that we will be able to expand the territory of the project in the future. This data will be useful not only for us, but for all OSM projects that will use it. Including you yourself can do something interesting with the collected data.
According to the first reviews after the launch of the prototype, we found that many people want to help with collecting data about the noise level on the street. In the near future we will come up with a decision on how to collectively collect these measurements.
If you do not really want to deal with edits in OpenStreetMap, it will be useful if you just photograph pavements using Mapillary - this will help OSM community members to map the map more precisely.
Backend / Infrastructure :
There are two hot tasks that you want to do in the near future:
- Now the data update is arranged primitively and occurs in manual mode, I reload files and update the local database. Need to automate
- To make the service more useful than just a map with layers of data, we dream of launching pedestrian routing taking into account the collected parameters of the urban environment.
We are looking for a backend. If you are such a developer (C ++, Python, Node.js, Postgres) who wants to join the project team - please write me karmatsky (at) gmail.com and discuss the terms of cooperation.
The plans - a bunch of different experiments with open geodata in large volumes and the connection of new layers.
It would be great to get any feedback about the project and discuss project ideas in comments.
Comfortable walk to you!
Project team: Andrei Karmatsky , Philip Katz , Igor Gakov . Thanks for the advice of Ilya Zverev and Timofey Samsonov .
Development and design: Urbica is a design studio specializing in interactive projects about the urban environment.
Source: https://habr.com/ru/post/262493/
All Articles