My vision of road events
Being a pedestrian, I always looked with interest at the agony of colleagues about how, when and on which route to drive home on their personal car - because the information from Yandex.Traffic does not always reflect reality. And then I found it interesting to have a slightly different look at what is happening on the roads of the city. What came out of this can be seen below.
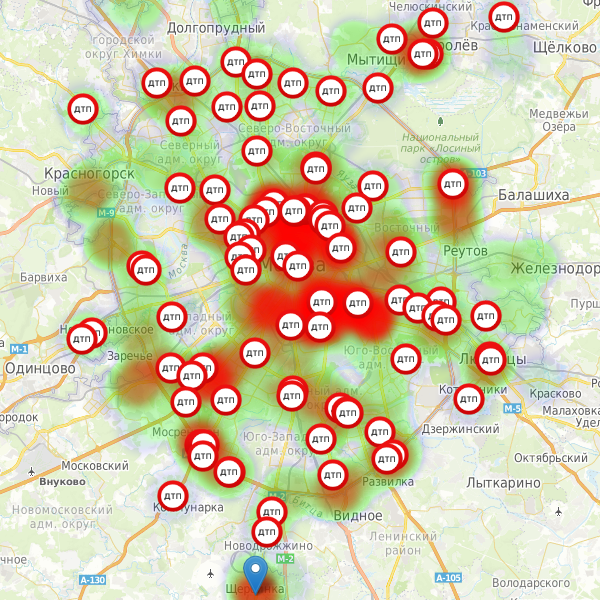
Yandex.Maps provide the user with interactivity in the form of the ability to create event labels or simply text messages on a map. I decided to use all these messages as an information flow for visualization. The flow needs to be structured somehow. There are some ways of structuring here - coordinates and time. As a rule, tags are placed where something is happening. Accordingly, if you group the tags by proximity to each other and sort them by publication time, you can get something like chatch by specific zone. And later, from this chaos of tags, you can isolate quite meaningful information about who is to blame and when it will all end.
After grouping messages, an open field of data analysis capabilities opens (searching for detours, timely notifying that something is happening on the planned route ... and many, many others). But, since it is still not clear what this will all end up with, and maybe it all started in vain ... I decided to postpone it all until better times. In order not to complicate the project, which, even without publishing, I want to rewrite.
')
Once I told my pedestrian colleague what I was going to do, and he threw an idea to me. Why not introduce a certain index (let's call it the “Lousy Index”), which would symbolize a purely subjective indicator of uncomfortable being on the streets of the city. The workload of the city, the difference between the temperature and the "perceived" temperature, the strength of the wind , humidity ... I spent many hours searching for information on what is considered to be comfortable indicators. I was particularly bothered by the formula for calculating the “Apparent temperature”. As I managed to find out, the reference formula does not exist, and for a long time scientific works appear at regular intervals, which introduce their corrective coefficients and new variants of calculations. And after more careful reflection, I abandoned this indicator altogether. Why is it needed? But I came across another interesting index, Heat Index . Actually, there are more questions than answers about the index (“Scabs”), and here I would like to hear the opinions of people. Is it necessary, if necessary, what and how should it influence it?

For a long time, while I was watching the events on the roads of Moscow and St. Petersburg, I managed to find out what motorists are most interested in and what they do not like.
Muscovites are most interested in: when the repair is over (in the place where he (she) is in traffic), what happened there, where the young ladies of a well-known profession stand. And the inhabitants of the city of summer residents, Yandex (and most often it is mentioned that he lied to them in some way) and a certain “Tsar” do not like it.
In St. Petersburg, the situation is a bit different, residents of the city are very interested in when bridges are being erected and whether they have opened bridges. And they are indignant about the special operations of law enforcement agencies to identify laughing substances on the roads.
“And what about the situation in my (un) beloved <put the name of the city> ?” - you ask?
Alas, nothing interesting in cities other than Moscow and St. Petersburg, can not be seen. Although sometimes it happens ...
Stack. Nothing special. Node.Js, express.js, React.Js, mongodb, socket.io. The weak point of the application architecture is WebSocket, or rather the number of simultaneously open connections. I did some small load tests and expect from the minimum droplet on the digital ocean that it will pull out 4 thousand (at least) simultaneous connections. In any case, it will be interesting. And, if that, the occasion will be confused with the load balancing and autoscaling settings. But it will be (?) A completely different story.
Yandex company, information from the services which I used
Companies Rostelecom, namely sputnik.ru. Which kindly provided cdn for maps in Russia (http://sputnik-maps.imtqy.com/).
Vladimir Agafonkin for the Leaflet.heat plugin
Project
Github
PS If my ideas in any way copy someone's project, it would be interesting to get acquainted with it.
What is what
Yandex.Maps provide the user with interactivity in the form of the ability to create event labels or simply text messages on a map. I decided to use all these messages as an information flow for visualization. The flow needs to be structured somehow. There are some ways of structuring here - coordinates and time. As a rule, tags are placed where something is happening. Accordingly, if you group the tags by proximity to each other and sort them by publication time, you can get something like chatch by specific zone. And later, from this chaos of tags, you can isolate quite meaningful information about who is to blame and when it will all end.
What can you do about it?
After grouping messages, an open field of data analysis capabilities opens (searching for detours, timely notifying that something is happening on the planned route ... and many, many others). But, since it is still not clear what this will all end up with, and maybe it all started in vain ... I decided to postpone it all until better times. In order not to complicate the project, which, even without publishing, I want to rewrite.
')
One day in the life of Moscow (Monday 07/14/2015)
I want more interesting tsiferok
Once I told my pedestrian colleague what I was going to do, and he threw an idea to me. Why not introduce a certain index (let's call it the “Lousy Index”), which would symbolize a purely subjective indicator of uncomfortable being on the streets of the city. The workload of the city, the difference between the temperature and the "perceived" temperature, the strength of the wind , humidity ... I spent many hours searching for information on what is considered to be comfortable indicators. I was particularly bothered by the formula for calculating the “Apparent temperature”. As I managed to find out, the reference formula does not exist, and for a long time scientific works appear at regular intervals, which introduce their corrective coefficients and new variants of calculations. And after more careful reflection, I abandoned this indicator altogether. Why is it needed? But I came across another interesting index, Heat Index . Actually, there are more questions than answers about the index (“Scabs”), and here I would like to hear the opinions of people. Is it necessary, if necessary, what and how should it influence it?
Interesting facts from the life of cities
For a long time, while I was watching the events on the roads of Moscow and St. Petersburg, I managed to find out what motorists are most interested in and what they do not like.
Muscovites are most interested in: when the repair is over (in the place where he (she) is in traffic), what happened there, where the young ladies of a well-known profession stand. And the inhabitants of the city of summer residents, Yandex (and most often it is mentioned that he lied to them in some way) and a certain “Tsar” do not like it.
In St. Petersburg, the situation is a bit different, residents of the city are very interested in when bridges are being erected and whether they have opened bridges. And they are indignant about the special operations of law enforcement agencies to identify laughing substances on the roads.
“And what about the situation in my (un) beloved <put the name of the city> ?” - you ask?
Alas, nothing interesting in cities other than Moscow and St. Petersburg, can not be seen. Although sometimes it happens ...
And finally, the technical side
Stack. Nothing special. Node.Js, express.js, React.Js, mongodb, socket.io. The weak point of the application architecture is WebSocket, or rather the number of simultaneously open connections. I did some small load tests and expect from the minimum droplet on the digital ocean that it will pull out 4 thousand (at least) simultaneous connections. In any case, it will be interesting. And, if that, the occasion will be confused with the load balancing and autoscaling settings. But it will be (?) A completely different story.
thank
Yandex company, information from the services which I used
Companies Rostelecom, namely sputnik.ru. Which kindly provided cdn for maps in Russia (http://sputnik-maps.imtqy.com/).
Vladimir Agafonkin for the Leaflet.heat plugin
Links
Project
Github
PS If my ideas in any way copy someone's project, it would be interesting to get acquainted with it.
Source: https://habr.com/ru/post/262119/
All Articles