Beginner site optimization guide. Part 2
Part 1
Establishing a well-defined and formal optimization process in an organization is a very useful practice since it:
')
At the general planning level, I would recommend arranging optimization planning meetings 1-2 times a week, at which it is necessary:
Completion criteria are complex and even are commercial secrets. I will define the minimum necessary conditions for declaring the test “completed”. There are no generally accepted standards, and the criteria depend mainly on the views of your team. We have developed the following criteria for ourselves:
Creating a new optimization test can follow the same pattern as product development. I recommend the following basic structure:
First you need to decide on what to concentrate efforts. We used the following list:
The question of improving the page is as big as the question of the user interface, and is beyond the scope of this article. You can improve the texts, design forms, display media data, render pages, appearance, accessibility ...
I advise you only to collect ideas together - use the power of the whole team to look for new ideas. Include not only designers, but also developers, copywriters, business analysts, marketers, testers ... A good idea can come anywhere.
The plan is the basis of any test. At the top level, it is used for planning, communicating and documenting the experiment, and moreover, it teaches the team to correctly and clearly formulate goals and analyze the results.
A good plan should be the following items:
Here is a sample test plan .
Usually they follow the path of product development - but since the test is simpler than a full-fledged product, I use the light version of the path.
But to lower for speed should be minor things - you can not do the documentation, but do not need to save on the quality of design. Do not forget to make basic checks on usability options.
Check the quality of tests as carefully as any other code. I recommend at least functional, visual and analytical tests.
Plus optimization tests in that you can arrange any targeting. You can target different options to specific browsers, platforms, audiences, etc. Suppose your team checked the work of only one A / B test - for desktop browsers, but not for mobile browsers. Then you can test its results exclusively for desktop users. If you still have any problems with the display in mobile browsers, they will not affect the test results.
At the end of quality checks and decision making on targeting, tests should be run. There are a few things to keep in mind.
The first principle is so obvious that it is not spoken of. But I very often heard statements like “after the launch of a new design, our sales / conversions increased - it means that the new design is better”.
The problem is that you do not know what other factors could affect the work of the project before and after the launch of a new design. Perhaps the conversion would have increased, thanks to the promotion of the brand, seasonal fluctuations, or simply on the occasion. Therefore, all options must be checked in parallel. Only in this way can we eliminate extraneous influence.
One of the A / B tests that we conducted was used on the film description page on the Latin American website DIRECTV. We increased the size and visibility of the “Ver adelanto” button (viewing the trailer), deciding that if people watched the trailer, it would encourage them to buy movies from the site.
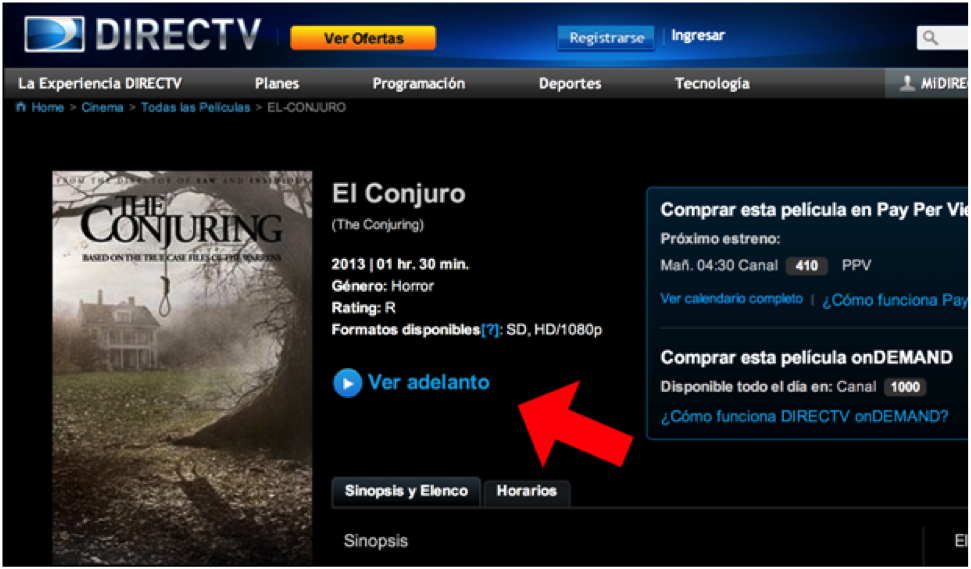
And so it happened - in a few weeks we saw an increase in the number of purchases by 4.8%. In a year, such an increase would result in an increase of $ 18,000 in profits. Fortunately, since we also monitored other parameters of the site, we saw that this option reduced purchases of channel packages (HBO, Showtime) by as much as 25%. It would be much more reduced profits. Therefore, we did not introduce this option in production.
It is important to remember that changes can affect your site unpredictably. Always keep track of different metrics.
Tests must reach an acceptable level of statistical significance.
In one of the presentations, the consultant reported that the preliminary tests of e-mail segmentation showed promising results.
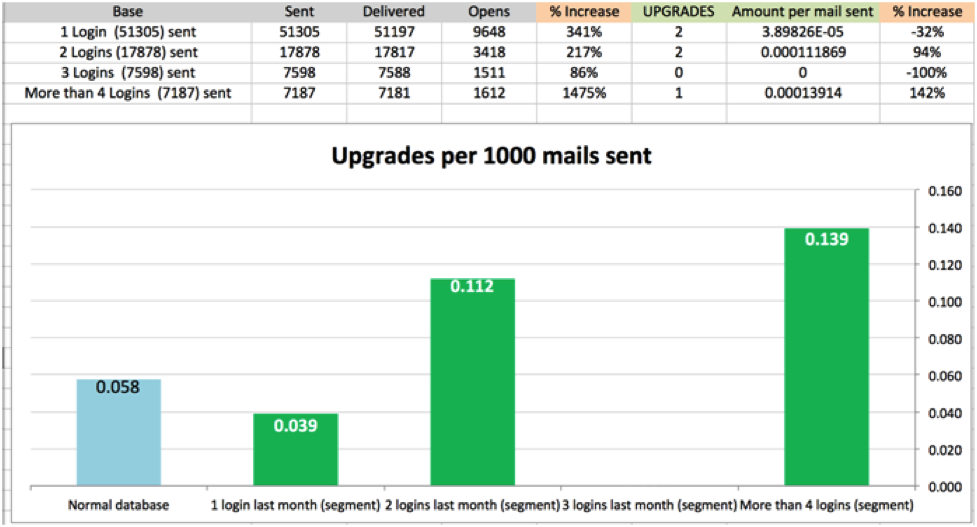
On the graph, the last segment of users (logged in more than 4 times per year) had a conversion of 0.00139% (0.139 upgrades per 1000 emails). And although this conversion is very small, according to the consultant, it shows a 142% increase, which is a good result.
Without even mentioning the questionable benefits of this statistics (is it proposed to send emails only to users who have logged in more than four times?), There is another problem in the test. If you look at the “Upgrades” column, you will see that the results were derived from only five cases of the upgrade order. Five out of forty eight thousand sent letters. It turns out that plus / minus one order would radically change all the statistics.
Although this is not an example of an optimization test, but simply a study of email segmentation, it contains an important lesson: do not announce the winner without typing an acceptable amount of statistics.
What is “acceptable”? The concepts “significant” (95% confidence) and “highly significant” (99% confidence) in the results are accepted in science. And the fact that they, respectively, have a 5% and 1% chance that your conclusions are wrong. In addition, the more statistics you need to collect, the more time it will take. I would recommend to focus on results in the region of 90-95% confidence, depending on the importance of the situation.
In an article on the site AnalyticsInspector.com, Yan Petrovich describes the problem of premature termination of tests. The test was conducted on a popular site for only one day, and at the end it was announced that the winning option increased the conversion rate by 87% with 100% confidence.
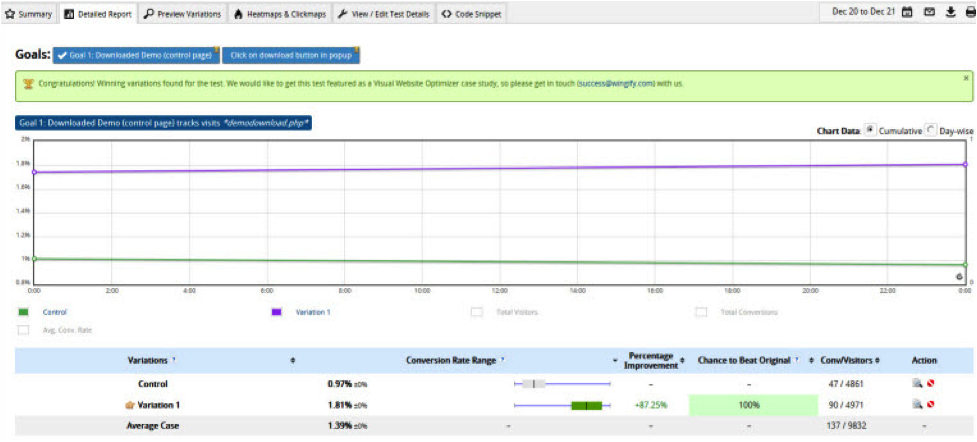
Jan writes: “If we stopped the test right then and tapped each other on the shoulder, we would make a mistake. We didn’t test our test on Friday or Monday traffic. But since we didn’t stop the test, the real result was completely different. ”
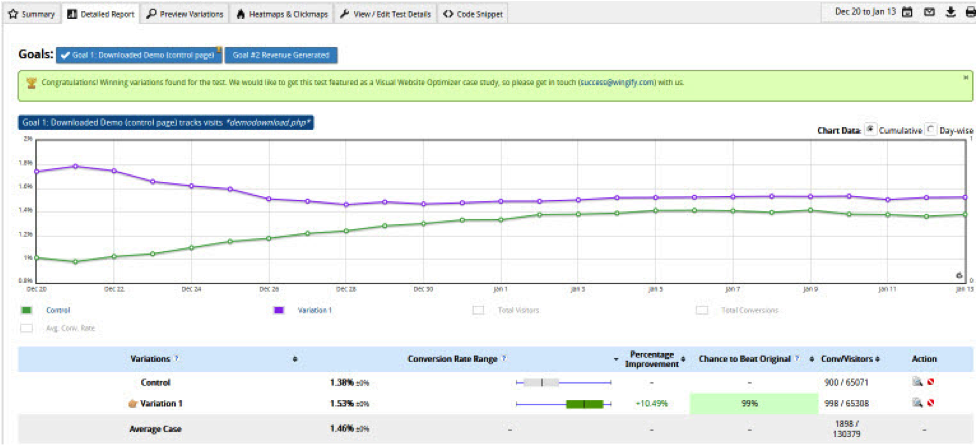
After four weeks it became clear that the new design, although it worked better than the control one, showed an improvement of only 10.49%.
Do not forget about the short-term fluctuations in the behavior of site visitors, take into account the difference between working days and weekends and seasonal traffic.
At the end of the test, when you press the stop button, you need to collect the results into a report. The report may be a continuation of the plan from step 2, but with the following additional sections:
It is very good to include graphs and various details in the “results” section so that those who are familiar with the report can themselves follow the trends and analyze the data. This will add credibility to your research and will attract people to the optimization program.
The discussion is useful for explaining the details and describing the reasons for the results. It should make the team think about user behavior and develop further product improvements.
Optimization process
Establishing a well-defined and formal optimization process in an organization is a very useful practice since it:
- organizes workflow and sets real deadlines
- sets quality control standards and reduces errors
- adds weight to the whole operation - the logic of the process can be explained to the owners of the company
')
At the general planning level, I would recommend arranging optimization planning meetings 1-2 times a week, at which it is necessary:
- View current tests to see if you need to stop them or recognize them as “completed” (see below). For completed tests there are two possibilities:
- there is a clear winner. In this case, it is necessary to develop its output in production.
- There is no clear winner in the current control group. In this case, you need to determine whether additional study of the issue is required, or whether you just need to stop the experiment.
- Review data sources and think about new test ideas.
- Discuss and assign priority to any new ideas.
How to understand when the test is completed?
Completion criteria are complex and even are commercial secrets. I will define the minimum necessary conditions for declaring the test “completed”. There are no generally accepted standards, and the criteria depend mainly on the views of your team. We have developed the following criteria for ourselves:
- Time. Tests must go at least two weeks to smooth out fluctuations associated with the days of the week.
- Statistical confidence. We used a confidence interval of 90-95%
- Stability in time. Options should be at least a week in place.
- Total number of conversions. At least 200 pcs.
Creating a new optimization test can follow the same pattern as product development. I recommend the following basic structure:
- data analysis
- search for ideas for improvement
- development of test options
- writing a test plan
- development
- quality control
- test run
- analysis of results and reporting
Step 1: Data Analysis
First you need to decide on what to concentrate efforts. We used the following list:
- Recent product releases, or pages that are not yet optimized.
- Especially valuable pages:
- Highly profitable (basket, description of expensive products, etc.)
- Highly visited (home page)
- Special strategic places that are important for some other reason.
- Pages with bad stats:
- Low conversion
- High percentage of care
Step 2: Search for ideas for improvement
The question of improving the page is as big as the question of the user interface, and is beyond the scope of this article. You can improve the texts, design forms, display media data, render pages, appearance, accessibility ...
I advise you only to collect ideas together - use the power of the whole team to look for new ideas. Include not only designers, but also developers, copywriters, business analysts, marketers, testers ... A good idea can come anywhere.
Step 3: Writing a test plan
The plan is the basis of any test. At the top level, it is used for planning, communicating and documenting the experiment, and moreover, it teaches the team to correctly and clearly formulate goals and analyze the results.
A good plan should be the following items:
- Test name
- Description
- Goals
- Opportunities (what we get in case of success)
- Methodology
- Expected test dates
- Resources (who will work on it)
- Metrics to track
- Completion criteria
- Options (screenshots of different designs that visitors will see)
Here is a sample test plan .
Step 4: Test Design and Development
Usually they follow the path of product development - but since the test is simpler than a full-fledged product, I use the light version of the path.
But to lower for speed should be minor things - you can not do the documentation, but do not need to save on the quality of design. Do not forget to make basic checks on usability options.
Step 5: Quality Control
Check the quality of tests as carefully as any other code. I recommend at least functional, visual and analytical tests.
Plus optimization tests in that you can arrange any targeting. You can target different options to specific browsers, platforms, audiences, etc. Suppose your team checked the work of only one A / B test - for desktop browsers, but not for mobile browsers. Then you can test its results exclusively for desktop users. If you still have any problems with the display in mobile browsers, they will not affect the test results.
Step 6: Launch
At the end of quality checks and decision making on targeting, tests should be run. There are a few things to keep in mind.
Options need to be shown simultaneously
The first principle is so obvious that it is not spoken of. But I very often heard statements like “after the launch of a new design, our sales / conversions increased - it means that the new design is better”.
The problem is that you do not know what other factors could affect the work of the project before and after the launch of a new design. Perhaps the conversion would have increased, thanks to the promotion of the brand, seasonal fluctuations, or simply on the occasion. Therefore, all options must be checked in parallel. Only in this way can we eliminate extraneous influence.
Track multiple conversion metrics
One of the A / B tests that we conducted was used on the film description page on the Latin American website DIRECTV. We increased the size and visibility of the “Ver adelanto” button (viewing the trailer), deciding that if people watched the trailer, it would encourage them to buy movies from the site.
And so it happened - in a few weeks we saw an increase in the number of purchases by 4.8%. In a year, such an increase would result in an increase of $ 18,000 in profits. Fortunately, since we also monitored other parameters of the site, we saw that this option reduced purchases of channel packages (HBO, Showtime) by as much as 25%. It would be much more reduced profits. Therefore, we did not introduce this option in production.
It is important to remember that changes can affect your site unpredictably. Always keep track of different metrics.
Tests must reach an acceptable level of statistical significance.
In one of the presentations, the consultant reported that the preliminary tests of e-mail segmentation showed promising results.
On the graph, the last segment of users (logged in more than 4 times per year) had a conversion of 0.00139% (0.139 upgrades per 1000 emails). And although this conversion is very small, according to the consultant, it shows a 142% increase, which is a good result.
Without even mentioning the questionable benefits of this statistics (is it proposed to send emails only to users who have logged in more than four times?), There is another problem in the test. If you look at the “Upgrades” column, you will see that the results were derived from only five cases of the upgrade order. Five out of forty eight thousand sent letters. It turns out that plus / minus one order would radically change all the statistics.
Although this is not an example of an optimization test, but simply a study of email segmentation, it contains an important lesson: do not announce the winner without typing an acceptable amount of statistics.
What is “acceptable”? The concepts “significant” (95% confidence) and “highly significant” (99% confidence) in the results are accepted in science. And the fact that they, respectively, have a 5% and 1% chance that your conclusions are wrong. In addition, the more statistics you need to collect, the more time it will take. I would recommend to focus on results in the region of 90-95% confidence, depending on the importance of the situation.
The duration of the tests should take into account natural variations (working days, weekends, etc.) and be stable over time.
In an article on the site AnalyticsInspector.com, Yan Petrovich describes the problem of premature termination of tests. The test was conducted on a popular site for only one day, and at the end it was announced that the winning option increased the conversion rate by 87% with 100% confidence.
Jan writes: “If we stopped the test right then and tapped each other on the shoulder, we would make a mistake. We didn’t test our test on Friday or Monday traffic. But since we didn’t stop the test, the real result was completely different. ”
After four weeks it became clear that the new design, although it worked better than the control one, showed an improvement of only 10.49%.
Do not forget about the short-term fluctuations in the behavior of site visitors, take into account the difference between working days and weekends and seasonal traffic.
Step 7: Analysis and Reports
At the end of the test, when you press the stop button, you need to collect the results into a report. The report may be a continuation of the plan from step 2, but with the following additional sections:
- results
- Discussion
- Further steps
It is very good to include graphs and various details in the “results” section so that those who are familiar with the report can themselves follow the trends and analyze the data. This will add credibility to your research and will attract people to the optimization program.
The discussion is useful for explaining the details and describing the reasons for the results. It should make the team think about user behavior and develop further product improvements.
Source: https://habr.com/ru/post/261941/
All Articles